
Welcome to the new Traders Laboratory! Please bear with us as we finish the migration over the next few days. If you find any issues, want to leave feedback, get in touch with us, or offer suggestions please post to the Support forum here.

Spydertrader
-
Content Count
389 -
Joined
-
Last visited
Posts posted by Spydertrader
-
-
... in this post ...If anyone has experienced difficulty with the above link, it should take you to post #110.
- Spydertrader
-
I have Dotted, Orange and Light green Lateral Formations. Does any of them end on wrong bar?You should arrive at the answer you seek by applying the answers in this post onto your annotated chart snippet.
HTH.
- Spydertrader
-
Drawing tapes to translating bars should rarely cause anyone difficulty. After all, connecting higher lows and higher highs (or lower highs and lower lows) represents the easiest of all tapes to draw. However, the majority of our trading day contains bars which do not show translation. We've already discussed some of these examples (Stitch & Lateral Formations), but what about the other internals?
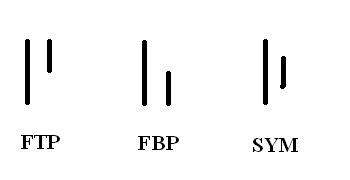
Perhaps, a bit of differentiation with respect to Pennants can provide some clarity. The quickest bit of differentiation results from what type of Pennant the market has created.
Flat Top Pennant (FTP)
Flat Bottom Pennant (FBP)
Symmetrical Pennant (Sym)
(Examples Attached)
What else might differentiate these three - from each other and from the rest of the market?
Grab a clean copy of Friday's 5 minute ES chart, and begin to look for subtle differences - again, between the three examples and between all three examples and the rest of the market day.
I'll start you off with one ...
Two of the three Pennants already have a 'built in' way to draw a trend line. The third example requires another bar in order to determine which trend line presents a correct view of the market.
Group the various differences together in order to form a consistant view (based on context), and apply that view onto all congruent contexts.
Take some time to focus on what develops after the market creates these pennants.
HTH.
- Spydertrader
-
For the purposes of this discussion, you have simplified matters by gathering all of these non-traverse fractals into a single fractal which is called 'the tape'.One cannot 'gather together' that which does not exist.
While certainly, additional trading fractals (beyond skinny, medium and thick) do exist, they reside not 'in between' skinny and medium, but rather, below (or faster than) a skinny line.
As a result, we rarely see them. However, when we do see these faster (than skinny line) fractals, they operate in the exact same fashion as all other fractals (skinny, medium and thick) which we see each and every day.
While the remainder of your question provides logical points which one can observe as correct or incorrect - simply by viewing a thoroughly annotated chart, the question leaves out one very important point.
What role (if any) does 'context' play in the application of your conclusion?
One can, quite easily, find themselves far 'off track' simply by applying the correct rule to the in-correct context. For this very reason, I have recommended everyone learn to differentiate the 'subtle differences' which develop time after time.
To that end, I plan to post another differentiation drill later this weekend.
While you may feel that I have failed to answer your question sufficiently, if you read my response closely, you should see that I have provided you valuable direction.
HTH.
- Spydertrader
-
28)
That's some list you have there.
However, I encourage everyone to keep this process as simple as possible.
For example, those who focus making decisions and taking action at the end of a bar, have no need for Pro-Rata Volume (a calculation which anticipates future, at end of bar, Volume as a function Current Volume [now]). One observes PRV while learning to transition from 'taking action' at end of bar to taking action intra-bar.
Some other things (on your list) give the appearance of redundancy.
In other words, no need to focus on a laundry list of items.
- Spydertrader
-
So should we be placing focus on the valleys and their pace levels ( or pace increases ) at points 1 and points 3 ?
While noting the various Pace changes might help someone to see what I have described in this thread, plenty of other, more critical, information exists, other than, observing Pace transitioning across pink, red, blue and green lines.
- Spydertrader
-
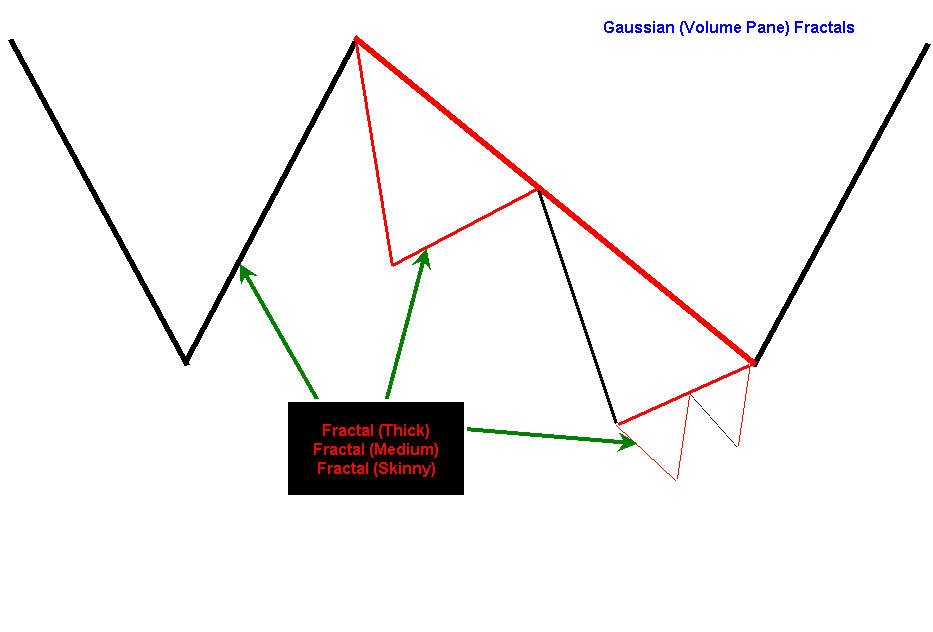
I wonder about 1. I have spent a fair amount of time trying to undertand fractals and there application to financial data series. It seems pretty clear that a single fractal dimension can not describe financial data series.Fractal One: Thin Lines - "Short Term Trend" (aka 'Tape')
Fractal Two: Medium Lines - "Intermediate Term Trend" (aka 'Traverse')
Fractal Three: Thick Lines - "Longer Term Trend" (aka 'Channel')
Each of the above three fractals does in fact describe, in a crystal clear fashion, a financial data series. Since trends overlap, so too do we see each of the above three fractals overlap.
They are in fact multifractals i.e the fractal dimension is not constant.See Attached.
R2R 2B 2R or B2B 2R 2B always remains constant. By definition, the components of one fractal exist on all fractals - irrespective of scale. Applying the fractal rules in a consistant fashion represents a challange most people face.
I wonder if it actually matters or not but refering people to investigate fractals is likely to add to their confusion rather than bring clarity. It might help to spell out which properties are the important ones?I have not "instructed people to investigate fractals." I have instructed people to "understand the definition" of the word - a definition I posted several times - including linking to pictures of same (for those more visually oriented).
I wonder if it is to do with guassian distributions? (which would tie in with fractals). Financial data series absolutely do not have gaussian distributions.If the word "Gaussian" provides you difficulty, replace the word with another. Hiking up and down Volume Mountains provides the same mental picture. However, take care not to add words which did not exist in the original discussion. The word Gaussian stands alone, and does not require, nor should one include, the word 'distributions' in the discussion.
HTH.
- Spydertrader
-
Do you mean signals provided by the Gaussian sequences or the the volume bars themselves?Depending on the context, the answer comes from the former, the latter or both.
- Spydertrader
-
While I do understand that volume is the most important part of a chart, do we still need price for context?Correct.
Is anything below a traverse considered a tape?All poodles are dogs, but not all dogs are poodles. Better to learn to define something by what it is, rather than, by what it is not.
While I do understand what fractals are, it seems real hard to apply this principle consistently to volume.The very same sequences repeat over and over again, every day, all day long. Nothing changes. You've known them for years.
No need to overcomplicate things.
Take it step by step, and you'll soon begin to see how the subtle differences create monumental changes in the information signalled to you from the market.
- Spdyertrader
-
"Tapes" may have 'kinks' which is what I believe Spyder said in the post following your most recent post.Spyder said no such thing.
The market has no anomolies, kinks, irregularities or unresolved circumstances.
B2B 2R 2B
R2R 2B 2R
That's it.
Possible problem areas for people to perfom a mirror check ...
1. Do I understand the definition of the word fractal?
2. Do I apply said defintion onto the market in a consistant fashion?
HTH.
- Spydertrder
-
I hope Spyder or others will chime in and set me straight.As stated in this post...
Three choices exist, and we call these three choices tapes, traverses and channels (skinny, medium and thick; or L1, L2 & L3 if you prefer different nomenclature).
No more 'Chubby' tapes.
No more 'Faster Fractal' Traverses.
No more Lateral 'Movement.'
Tapes build Traverses and Traverses Build Channels.
HTH.
- Spydertrader
-
Is this one part in the correct direction in volume / price relation ?
A danger exists with using older charts to find one's way. First, depending on the discussion (at the specific point in time of the chart's creation) annotation convention may differ in an effort to highlight the specific area under discussion. In other words, a discussion with respect to a 'faster fractal traverse' would see those areas highlighted in the annotated chart, and possibly, very few (if any 'actual' tapes), whereas currently, this discussion only considers three fractals - tape, traverse and channel (or if you prefer, skinny, medium and thick; L1, L2 & L3). Second (as is the case with this specific chart), the previous annotation convention may not apply to the current discussion at all. For example, note the Gaussians on the chart you attached. They only show two levels. Moving forward, we want to focus on 'seeing' all three levels of Gaussian activity and only three levels.
Again, I don't want to discourage the use of older charts. I just want to caustion everyone to view these artifacts as intended at the time of their creation, and not, from the vantage point of an improved knowledge plateau.
HTH.
- Spydertrader
-
Thank you for your time, Spyder.
I wish you tremendous success in your future endeavors.
- Spydertrader
-
For the gaussians to tell us what has been created, am I correct in assuming that we use the volume sequences b2b2r2b or r2r2b2r?Always and without exception.
- Spydertrader
-
As far as I understand the nature of the above mentioned process and am able to educe its appropriate modus operandi, I would associate it with falsifying the theories in critical rationality.
Whether through falsification or validation, the entire process begins with starting at a baseline of understanding. Whatever information comprises said baseline matters little, but the baseline of understanding must exist in order to begin. Currently, you have provided an annotation baseline which fails to provide you any worthwhile information
With your knowledgeable answers I hoped to falsify my theories about some relationships between price and volume and move on. This would be really helpful, I thought.
The whole purpose of this thread involves learning a process one which shows how (and where) to differentiate that which people believe from that which actually exists.
However, you appear to favor a different process. You (along with a few others) seem to feel having me provide answers to your questions represents the best and most efficient path toward success. I've suggested (instead) a path whereby the individual learns to obtain their answers from the one location which is always right - the market.
By the way, my last question didn’t have anything to do with annotations at all (Gaussians are Gaussians, do they have anything to do with annotations?). But I guess that was my fault, because I asked it.
Not all that long ago, you simply refused to place Volume on your charts - opting instead to learn about the Price / Volume Relationship by using Volatility as a proxy. To be clear, everyone should feel entitled to learn about the Price / Volume Relationship in any manner they feel best suits their needs.
Understand, I really do not care whether or not you follow the advice provided in this thread (or others), nor do I hold any ill will toward you in any way shape or form. However, if you can't see something (which exists right in front of your face), and several people advise you how you can go about the process of learning to see it, perhaps something of value can be gleaned from following directions.
HTH.
- Spydertrader
-
would the information provided by the Gaussians to the right of the marked ftt in the attached chart suffice, in order to unambiguously classify "this something" as a traverse. If so, would it be dominant or non-dominant one?
Your Gaussians have no variation in line thickness, nor do they show variation in color (red or black), nor have you chosen to show Price annotation in this specific example. I'm gonna' go out on a limb here and suggest, perhaps, creating thoroughly annotated charts provides more information to the trader than you currently have the ability to see.
So how about you give creating a thoroughly annotated chart a try. Even if you get everything incorrect at first, you'll (at least) start to learn the process (finally).
- Spydertrader
-
Are you aware of situations where the trendline-Gaussian correlation falls apart?
lj
No such circumstance exists - ever.
- Spydertrader
-
Could you post a few charts with examples of tapes on them, that look like traversesIt appears you continue to miss my point.
Whatever something "looks like" in the Price Pane falls under the catagory of unimportant because a tape does not ever look like a traverse (or anything else) when observing the Volume Pane.
You can call something a tape, traverse or channel (hell, call it a goat if you like) by looking at a Price Pane, but Volume always indicates exactly what the market has built for you to see.
Without exception.
Three choices exist, and we call these three choices tapes, traverses and channels (skinny, medium and thick; or L1, L2 & L3 if you prefer different nomenclature).
No more 'Chubby' tapes.
No more 'Faster Fractal' Traverses.
No more Lateral 'Movement.'
Tapes build Traverses and Traverses Build Channels.
Again, whatever something "looks like" in the Price pane does not matter in the slightest. The Gaussians always tell you what the market has created.
Without a doubt, if asked, a roomful of traders would provide as many answers with respect to what the market created across most of today (7-20-2009). Again, if one chooses to look at what today's 'something' "looks like" by observing the Price Pane, a variety of opinions develop. However, only one possible accurate answer exists, and it resides in the signals the market has provided in The Volume Pane.
HTH.
- Spydertrader
-
So in Neoxx's example with price blocked out and with the gaussians drawn in we should know it was a traverse. On other examples, (of traverses) it might not be so clear.Absolutely correct. In this example, Volume told you everything required to arrive at a correct decision. In most every other example, such is not the case. Hence, Jack's frequent posts on, "how one could almost do this with Volume alone."
- Spydertrader
-
Was applying it outside the "boundaries" a reference to the question being only about it being a traverse?No.
Neoxx asked about this specific example. He wanted to know, (paraphrased), "Whether or not one would still know a traverses existed if a trader had no access to the Price pane." Applying my answer to all Traverses (and not just this specific example) represents an action 'outside the boundaries of the question.'
Was your answer to Neoxx with or without the gaussians already drawn in, as in that specific example?The Gaussians existed (were already drawn on the chart snip), prior to, Neoxx posting his question.
I walked through the alternatives. Any comments or other things that should have been taken into consideration?The entire point of these discussions represents my attempt to motivate people to learn the process of differentiation. As we noticed recently while observing the discussions between romanus and PointOne, people 'see' things differently (please note: I did not use the terms, 'correctly' or 'incorrectly'). People also interpret words and phrases differently based on their own internal 'filters' which resulted from various life experiences. As such, learning the process of differentiation represents the best way for someone to know the intended meaning of words and phrases equals what the presenter intended, and more importantly, that the recipient understood as accurate and precise.
For example,
"The YM leads the ES." represents a true and accurate statement. However, "The YM Leads the ES at points of change," represents, not only a true and accruate statement, but one which is more precise.
I once made the error of adding a different qualifier to the original assertion. My mental filters decided I had heard the words, "The YM leads the ES all the time," when nobody had inferred nor implied such a thing. Only when I differentiated all possible meanings of the original phrase did I arrive at the correct interpretation.
To that end, I started this thread.
- Spydertrader
-
What I notice...By quoting Neoxx and highlighting certain areas of the quote, when I used the phrase "anything jump out at you?" I was referring to the orange highlighted section of Neoxx's question in that Neoxx chose to request an answer for this specific example only, and not, all examples.
- Spydertrader
-
 :confused:If the price pane were blanked out in this example, should we still know we have a traverse rather than a tape?
Neoxx used the phrase "in this example" in his question. You didn't notice the highlighted orange section within the portion of his post I quoted? Since Neoxx chose to discuss this example instead of all examples, he has provided boundaries for his question.
Your post applied my answer (to his question) outside those boundaries. In other words, my answer does not apply to all examples - only this one.
:confused:With no reference to price, the attached examples would seem legitimate alternatives.Everything is not always what it appears to be (at first glance).
I encourage everyone to look at what appear to be "legitimate alternatives" in this case, and by doing so, test said conclusions against known circumstances in an effort to determine whether or not the statement represents a valid conclusion.
You arrived at a specific conclusion. That being, the attachments you posted represent "legitimate alternatives" to what I have stated. I encourage everyone to compare these "legitimate alternatives" against known areas of the market where one knows what the market has provided. In other words, one needs to compare and contrast the "legitimate alternatives" against an area of the market where the same thing occurs and determine if the conclusion of "legitimate alternatives" represents a valid viewpoint or wishful thinking.
- Spydertrader
-
Are there any great services, free or not, that nicely preset upcoming market announcements? i.e. earnings, job numbers, etc...Several examples ....
- Spydertrader
-
Would you please take the peculiarities of this specific "tape" apart if this indeed is one?One begins with the knowledge that all markets exist on a fractal basis. By understanding the correct definition (here is another for those with a more visual orientation) of the word 'fractal' (and applying said understanding onto the market itself) one can then understand how no anomalies, exceptions or peculiarities can exist - ever.
- Spydertrader
The Price / Volume Relationship
in Technical Analysis
Posted
You've already annotated the flaws on the chart attached to your previous post.
- Spydertrader