
Welcome to the new Traders Laboratory! Please bear with us as we finish the migration over the next few days. If you find any issues, want to leave feedback, get in touch with us, or offer suggestions please post to the Support forum here.

Spydertrader
-
Content Count
389 -
Joined
-
Last visited
Posts posted by Spydertrader
-
-
Any comments would help.Your green lines do not represent a Lateral Formation.
HTH.
- Spydertrader
-
As part of the morning Pre-Flight Check, a trader needs to know where the market has ended its sequences from the previous trading day (16:15) with respect to the three trading fractals (tape, traverse and channel [or skinny, medium and thick - if you prefer] annotated on the ES five minute chart.
But what if you don't know? Then what?
Simply, let the market tell you by reaching a point of certainty.
To be clear, everyone should already know. After all, the market has been closed all weekend, and no additional data has arrived on the chart (nor will it until tomorrow morning). However, in the event where the trader doesn't realize certainty exists (such as the case may be), how can the trader learn to see that which currently appears obscured?
Start by determining what you believe you see on your chart. Then set about the task of determining what the market needs to do in order to confirm, but also, what the market needs to do to invalidate, that which you believe. Do you have a tape? A Traverse? A Channel?
At what point does the market say, "Hey Dude! Whatever the hell you thought you saw, it should be pretty clear it can't happen now." At what point does the market say, "Nicely done. You realy nailed that one."
Mark these points on your chart.
Now, wait for the market to do its thing.
What answer did the market give you? More importantly, how can you apply that which the market has told you onto the next set of sequences?
So, based on where you think you are (with respect to the market sequences), how can you know you had things correct (or incorrect, as the case may be) for tomorrow morning?
What must the market do?
Again (as I have said many times), you already know the answers, you just do not yet realize it.
- Spydertrader
-
Then could you possibly be referring to the Lateral Traverse here as in the Lateral ( price container ) ' TRAVERSED ' and not a Traverse as in the complete build of sequences ( volume construct ) that eventually builds a channel?It is entirely possible that you have articulated the attached chart's annotations in that 'traversed' (verb) differs from 'traverse' (noun). However, since I annotated my charts based on the context (back then) of the conversation (again, at the time posted) within the thread, I could not say for sure as I have no idea what the thread focused on back in October 2008. It is for this reason that I do not recommend reviewing old charts - other than through the lenz of whatever the context was at the time of the charts creation. For example, someone looking at a chart from January to September 2007 might wonder why I no longer annotate hitches, dips and stalls. Of course, once they read October 2007 initial (5 part) post, things become quite clear.
To locate that specific chart's context, simply review the thread at the time of its creation.
In this thread, I have placed the focus on 'learning to learn' from the market itself, understanding the process of differentiation and focusing on how one knows the market has provided certainty.
One need not 'go back in time' to focus on these things.
If you wish to see everything needed, focus on the current market (specifically from 7/13/2009 to present day).
I plan to post a drill covering this time period within the next few days.
HTH.
- Spydertrader
-
In this example there is a lateral formation. This lateral formation is labeled a traverse.No. Actually, it isn't labeled as you have indicated. The attached chart shows a label containg the words Lateral Traverse - two words; not one word. Unless you have determined the words Lateral Traverse, and the single word, Traverse represent the same things, I could not have done as you suggest in your post.
Is this lateral formation also a traverse ?The market defines a Traverse based on Volume. The market defines a Lateral Formation based on Price. What answer does the market provide with respect to your question?
- Spydertrader
-
I'm aware of that IBGS and Lateral Movement are wordings used no more.I don't recall suggesting that an Intra-Bar Gaussian Shift no longer exists. Perhaps, you could link to the comment where I indicated not to use the acronym IBGS.
Is the post (see the attachment) still effective for Lateral Formation?Find a lateral which provides an example. From the point in time where the market provides the indicator desired, annotate two ways: one where the Lateral Formation ends, and the other where the Lateral Formation continues. Which method does the market determine as true and accurate?
- Spydertrader
-
SpyderAre these non dominant lateral traverses accurate as how they would be annotated currently, if this example was todays data ?
The attached chart shows annotations titled Lateral Traverses. The Lateral Differentiation Drill focuses on Lateral Formations.
- Spydertrader
-
Wednesday 5 August 2009 - hi all, I have 3 fractals on the vol plane! Now, whether it is correct........!You have improved significantly in a short period of time. Stay focused, and when you find yourself confused, wait until the market provides you certainty - one way or the other. Then, work your way back to locate the correct answer.
- Spydertrader
-
So it wasn't necessarily about the snippet (in a vacuum). It was the bigger picture, what came before it should have told us WMCN.That which developed before the snippet told you, in the most unambiguous way possible, what the snippet would be.
- Spydertrader
-
Your statement above presumes that you know how I view the market. Maybe you do and maybe you don't.Seriously? Setting aside, for the moment, how simple it is to know where someone sits mentally, simply by reading the questions they ask, you've frequently posted your exact views on several topics leaving no room for error, interpretation or guesswork.
When such views represent a direct conflict with what the market dictates as true and accurate, one need not be Sherlock Holmes in order to figure things out.
In other words, there is no maybe about it.
I don't really care.No problem. You wouldn't be the first (nor likely the last) to disregard my advice. Some eventually come to their senses and find themselves wondering why it took so damn long to listen, while others, simply, never make it back to the reservation.
Whichever path people choose matters very little to me. In fact, I, most certainly, care even less than you.
The test of my hypothesis about things which differentiate tapes from traverses simply failed.Excellent. Except I haven't been discussing tapes vs traverses with respect to where you blew right past the red barn.
HTH.
- Spydertrader
-
I am well aware that the interpretation was invalid. What I am presently doing is determining why that was so by focussing on discovering the meaningful differences between romanus' and ehorn's Gaussians and their associated trendlines.And what I am attempting to get you to see is that your first error, while certainly including the area you currently find yourself differentiating, begins in a location seperate from your current efforts.
You missed the red barn, not because you chose the incorrect portion of the fork in the road, but rather, because you cannot know a fork in the road even exists under your current view.
HTH.
- Spydertrader
-
Why do you need a looping function? Just for bar coloration?If the rudimentary 'TradeSense' programming language allowed for recursive functions of any kind, I wouldn't need any additional functionality, but currently, the TN programming language does not allow for such things due to how the 'engine' calculates functions upon chart load (or program startup).
In other words, I cannot 'gate' Bar Coloration on the current Bar based on the color of the previous bar - unless I do it case by case. Not only is such a paradigm time consuming, it also turns what should be 2 - 3 lines of code into 30 - 40 lines of code. Ugh!
I have a conference call scheduled for next week in an effort to stress (for about the sixth time) the importance of adding global / state variable and recursion functionality to the platform. A quick review of the TN forums indicates I am not the only one who wishes to see this addition.
- Spydertrader
-
If the market shows his/my interpretation to be in error ...Think for a moment.
The market had already invalidated the interpretation. In addition, something must have indicated what to expect next, prior to, the market creating the posted snippet. - something which should have told you exactly what the market had to create.
This isn't a 'fork in the road' type of error as you postulate. Clearly, having the ability to differentiate what you believe exists in the chart snippet from that which the market created does help. However, the other, far more important lesson is that you missed something before the snippet developed - something which should have, and would have, told you exactly what the snippet had to be.
Lastly, one need only the ES five minute chart to see this something take place.
It is very clear to me Spyder, that since June of 2006, you have been iterated countless times by the market.Nothing has changed from November 1998 (when Jack first began posting on USENET) - other than the removal of the MACD and The Stochastic Indicators - through the Question from Grob / Hershey threads and both Futures Journals.
While the focus may have changed (e.g. we now only discuss using an ES chart without medium or fine tools, while making decisions and taking action EOB vs Intra-Bar), if you feel the fundamental information presented has changed, it isn't a result of altering the information presented. It is instead a result of an alteration in the mental filters in the mind of the recipient.
So where did romanus and me screw up?
You simply drove right by the red barn and neglected to turn left.
- Spydertrader
-
Gotta go with romanus. Let's see.Obtaining the correct (or incorrect) answer remains far less important as understanding why (or why not) a particular solution represents a true and accurate statement (or not).
- Spydertrader
-
Spyder, have you changed something about the coloring functions in Trade Navigator since your PVTools?
Yes, but I have yet to completely code for all possible scenarios. Due to the limited capability of the Trade Navigator coding language ('TradeSense' doesn't currently allow for global / state variables or contain a 'looping' function), I only realize that the bar coloration code has missed a specific case scenario when I 'see' it form on the chart (When a specific example has no coding function, the current settings render the bar color blue instead of red or black). Once completed (hopefully, by the end of next quarter), I plan to make the changes available for free.
- Spydertrader
-
Three Different Viewpoints ....
but only one represents the correct answer as provided by the market.
Remember, this isn't about how one 'views' the market, or how a trader 'interprets' the market, or even, about how one 'sees' the market (or any other gradient verbiage). This is about differentiating that which you believe you see, from that which, the market as actually provided.
Whatever a trader believes they see in the chart snippet, must also apply to every other thing on the same fractal. If the solution does not, then it cannot represent the correct answer.
Why something is correct or incorrect represents a far more important thing than simply obtaining the correct answer itself.
- Spydertrader
-
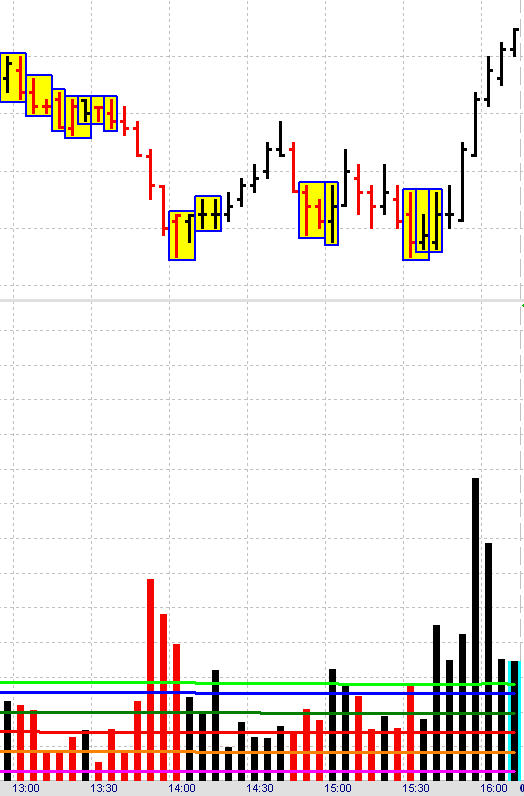
Take a look at the attached Chart snip from today (08/04/2009) ...
What did the market form?
How do you know?
If you know neither answer ...
How many different ways can you annotate the chart snippet? Test to determine which of those ways represent the only correct method.
HTH.
- Spydertrader

-
Is there something I need to alter to understand the correct procedure please?1. In the Volume Pane, you'll need three fractals, not just two.
2. In the Price Pane, your trend lines do not show a consistant application of the fractal nature of the market.
- Spydertrader
-
trying to get to the right ballpark.......I recommend begining the process of learning how to locate the 'correct ballpark' by annotating Price Bars two by two (using the examples shown earlier in the thread). Once one understands the correct procedure required for annotation, one can then begin to see how the process of refining one's technique brings things right into focus.
Currently, you have attempted to create a medium size and larger picture, but without the added benefit of the building blocks which make up the details.
Begin with these smaller pieces and build from there. In such a fashion, you'll soon see how letters form words, and words become sentences. It is within these sentences that the market tells its story.
- Spydertrader
-
I guess this is really helpful for somebody.Your posts continue to confirm observations made long ago: You simply refuse to engage your brain, prior to, engaging your mouth (or in this case, keyboard). Several people have attempted to assist your understanding, but instead of listening to, and learning from, their advice, you have, instead, chosen a different path - one which clearly fails to motivate others to continue their assistance.
Jb, Roman and Lj have each provided you with helpful advice. I encourage you to review their recent posting history.
If you don't much care for the advice of these three, I suggest you follow your own advice instead ...
I won't bother you anymore with my posts.- Spydertrader
-
I am confident that both dominant and non-dominant laterals exist.If I understand your post correctly ....
After careful, thorough and purposeful obervation (Monitor), you notice subtle differences between two different types of laterals (Analysis) determining a dominant and non-dominant correlation exists (Decision) which results in holding one's current position (Action).
Hmmm. Doesn't appear at all you need me to shed any light on anything.
Nicely done.
- Spydertrader
-
I guess ... a useful discussion would be to compare contexts: like 1335 and 1550 laterals,Actually, this would be a very good discussion for people to have. Do these two areas represent the same thing or different things? If different, why? If same, what does one know about WMCN based on this context?
or 1120 and 1210 outside bars,
Another set of areas which represent a very good focus for discussion exist here. However, for a far different reason than one might think. These two areas, on my chart, do not present as Outside Bars. Instead, they appear as 'stitches.' Knowing this, does anything change in terms of analysis? Why? or why not?
or 1140 and 1525 spikes,
Again, these two areas represent great points where 'something' has changed in terms of market direction. Between the two examples, do they represent 'sameness' or something different in each? If same, why? if not, why not? Also, the word 'spike' might represent a 'murky' way of describing these two events. In other words, one might not fully realize at what point something that is not a 'spike' becomes a spike? Perhaps a better, more precise, description exists here (one which includes both areas, but represents more binary [than gradient] thinking) - and a description which might help to clarify what actually takes place.
Coming with clear examples, clearly explaining your thought process and conclusions, then asking for comments, would get everybody much more from this thread.

For me, it comes down to a very simple set of choices - either these pages have value, or they do not. If value does not exist, then people should stop reading immediately, and find something worthwhile to do with their extra time. If value does exist, then did it devlop by accident, or by design?
Perhaps (just a small possibility, mind you), the reasons, behind why the format for this specific thread differs from all others, exists just outside everyone's current level of vision.
Perhaps, I want everyone to learn a much bigger, more important lesson.
While I understand the frustration which can devlop when someone struggling to locate answers fails to see the overall design and intent of my posts, just because an individual cannot 'see' something, doesn't mean that something isn't there.
Learn the process of differentiation, and the answers everyone seeks reveal themselves as a result.
- Spydertrader
-
Sesame Street actually points out the correct answer.In the exact same fashion as Sesame street, the market provides all answers required of the trader. One simply needs to go and look.
To set tasks and never give an explanation is no way to achieve transference.I have designed the tasks / drills in such a way as to provide for everyone the initial steps toward differentiation - to learn how to see the differences between that which people believe they see from that which actually exists. I have not designed the tasks as a 'quiz' for receiving grades.
Some have found this process (of learning differentiation) extremely helpful. A few have experienced a lightening strike as a result.
Transference results from a fully differentiated mind. In other words, people don't need me to provide answers for them, nor do they need another thread full of posts. They only need the market and their own brain.
As such, already have you that which you need.
- Spydertrader
-
What else might differentiate these three - from each other and from the rest of the market?
This is too vague.
Sesame Street teaches young children how to look for differences in things by using muppets and singing songs.
[ame=http://www.youtube.com/watch?v=tZIvgQ9ik48]YouTube - One of these things is not like the other things.[/ame]
Since "context" has never been defined, this is also too vague.
An online dictionary defines context as ...
"the set of circumstances or facts that surround a particular event, situation, etc."
Applying this definition, we can understand hearing someone yell, "Fire!" - while observing an execution by firing squad provides a far different meaning than hearing someone yell, "Fire!" while sitting in a crowded movie theater.
In the latter, the word 'fire' represents a 'noun' (i.e. "Something is burning"). In the former, the word 'fire' represents a 'verb' (i.e. "Pull the trigger and shoot the guy").
Context (the location or circumstances which surround the event) alters the meaning of the word.
Certainly, everyone can think of circumstances (or events) whereby the context in which the trader views Price and Volume (Monitor) alters the meaning (analysis) of what the market has signalled.
HTH.
- Spydertrader
-
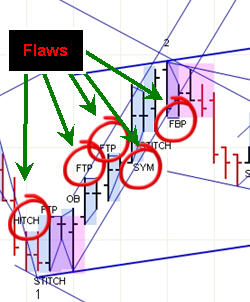
Is the reduction in vol the flaw in this lat?See Attached.
- Spydertrader
The Price / Volume Relationship
in Technical Analysis
Posted
I plan to post something on this period very soon. Hopefully, by the end of the week.
- Spydertrader