
Welcome to the new Traders Laboratory! Please bear with us as we finish the migration over the next few days. If you find any issues, want to leave feedback, get in touch with us, or offer suggestions please post to the Support forum here.

Spydertrader
-
Content Count
389 -
Joined
-
Last visited
Posts posted by Spydertrader
-
-
I shall obviously have to look through 27 years worth of charts to "compare and contrast"so any thoughts on the above and any assistance on "comparing and contrasting" are appreciated.
Step by step, follow these directions ...
Rather than saying, "the market tests the Lateral Boundary created at Bar 1," subsitute the words, "the market creates the Lateral Boundary with Bar 1." Now, run this test across both examples under discussion (as well as other examples from The Lateral Formation Drill (and follow up). Does each example conform do this definition?
Run the test on TIKI's chart. One Lateral meets the definition. One does not. (For now - and throughout this discussion for 5 weeks now) we only care about Laterals which meet the definition.
Using the above (re-worded) defintion, everyone should be able to create (in their mind's eye and on paper) three possible examples of a Lateral which conforms to the examples provided in The Lateral Formation Drill (and follow up), but also represent entirely different things from each other.In other words, Three possible ways exist for this one type of Lateral (begins with a Sym pennant, and some bar in the future creates a boundary with Bar 1 of the Sym). What are those three ways? Two of those ways exist within the Lateral Formation Drill itself.
Good. Now, set aside Volume (for just a moment) and determine if all of the examples under discussion form in the exact same (as our reworded definition) way. Those that do not form in such a fashion fall into a different pile.In other words, we have defined something based on price, and we will use (later) Volume to note the differences amongst the various examples of things within this specific pile of Laterals (as defined above). However, before one can move to seeing subtle differences (step two), a trader must first complete step one - locate three ways the object definied above can form - without looking at Volume (yet).
- Spydertrader
-
I believe you are absolutely correct. The quoted definitions presuppose that an observer is able to define what "fractal" IS in some way that is consistent across all contexts.I haven't presupposed anything.
Of the three 'things' which dictate what annotations belong on a chart (context, order of events and [differentiation of the actual] objects), I simply started with the easiest of the three.
In addition, knowing how Price must exit a specific lateral type provides opportunity for people to earn real money every time they see a certain 'thing' appear on a chart.
Lastly, Within the last two days, I've provided several examples of how one applies the scientific method for moving forward in an effort to show people what they must do in order to untangle that which they find confusing.
Unfortunately, very few have seen as beneficial that which has been posted over the last 2 days.
- Spydertrader
-
how can they both be correct?Please review the post to which you refer - especially the quoted portions of the previous posters. You should note, one individual's (Ezzy) quote refers to a sequence of events. I indicated a correct set of annotations with a response to direction only.The second individual (TIKI) referred to how an Outside Bar formed (Price making a higher high [over the previous bar] prior to closing below the bar's open). I indicated he had posted a correct analysis with respect to the Outside bar only.
- Spydertrader
-
For the sake of clarity will you please define what this "one sort of lateral" is that you are referring to instead of repeatedly referring to other posts that were equally confusing.I do not understand what you find confusing about the following ...
Just to clarify the chart snippets I posted contained a gray shaded lateral and a red shaded lateral.It is only the red shaded lateral that meets the requirements of the drill.
As such, please click on Tiki's posted chart ...
Once again, we are only discussing one type of Lateral (See Tiki's posted chart to see the difference).
I was also quite clear with this post
I assume (do to the differences in shading [red vs gray] of your example laterals) you understand the second lateral represents the current discussion lateral example (whereas the first example does not).- Spydertrader
-
Please point out what part of these instructions you find confusing ....
Rather than saying, "the market tests the Lateral Boundary created at Bar 1," subsitute the words, "the market creates the Lateral Boundary with Bar 1." Now, run this test across both examples under discussion (as well as other examples from The Lateral Formation Drill (and follow up). Does each example conform do this definition? Does today's (9:45 AM)?Please post your efforts with respect to these instructions ....
Lastly, once one has determined the exact similarities of things, then one can look for the differences which indicate what must come next. Using the above (re-worded) defintion, everyone should be able to create (in their mind's eye and on paper) three possible examples of a Lateral which conforms to the examples provided in The Lateral Formation Drill (and follow up), but also represent entirely different things from each other.- Spydertrader
-
Only a guess mind you....Once again, we are only discussing one type of Lateral (See Tiki's posted chart to see the difference).
and in my response to Sambrown
For now, we want to stay focused on this specific type of Lateral (from the Lateral Formation Drill (and follow up) setting aside (for another day and time) those which do not conform.- Spydertrader
-
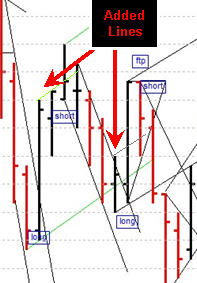
Feedback or comments welcome.See Attached.
I added a 'light green' and a 'light gray' line to your annotations. Remember to always annotate in a thorough fashion. Once you learn to annotate 'adjacent bars' correctly (and thoroughly), move onto combining the individual containers in such a fashion where these containers match the Gaussian lines within the Volume Pane.
HTH.
- Spydertrader
-
To David's question, this area threw me because I was looking for increasing volume to confirm a point 3, for the last 2B. Is that not the case for sub-fractals? We can see the price movement only on the 5 min for this example.Of course you looked for increasing Volume to confirm your Point Three, but what you failed to note was that the context was different here. Price found itself inside a Lateral. In such a case, the failure of the market to provide that which you anticipate is in fact, the signal for change.
I believe Jack used to call it, "What wasn't that?"
Again, the whole point of the exercise is for a trader to learn how to know which direction Price must head as it exits the Lateral.
HTH.
- Spydertrader
-
Unfortunately that post did not help me in any way because I have yet to understand what it is you are alluding to with respect to differentiating lateralsWell, I provided a crystal clear definition today for the creation of one type of Lateral. Last night, I posted that there existed three possible ways for such a lateral to form. Today, I suggested whether the very same type of Lateral formed on increasing or decreasing Volume might represent a subtle difference - in other words, a way one can know how the market plans to exit the lateral in question.
It now seems that the boundary of a lateral is defined by a bar within the lateral and something is implied by whether or not it has incr or decr volume. This could take forever..............Once again, we are only discussing one type of Lateral (See Tiki's posted chart to see the difference).
- Spydertrader
-
I thought that the 2r had to close outside the b2bIt does. Perhaps, you only assume the 2R ends at Bar 1.
this is getting very subjective if we are going intrabarCome on now.
You already found the answer (based on your view of the YM), but based on only using the ES (and not the YM together), you felt you could not 'see' that which exists.
O.K. Fair enough.
However, what reason (stumbling block or obstacle) prevents people from seeing things as they should (in this specific example)? We have several choices ...
1. The YM lied.
2. This whole process is really subjective and only works in hindsight.
3. Some people do not view Outside Bars correctly.
4. Some people still need to understand the words written in the picture of this post.
5. The person providing instruction could do a much better job at teaching.
Think, for a moment, what do the words "Intra-Bar Gaussian Shift" mean? A shift in the direction of a Gaussian Line.
- Spydertrader
-
This is what I have thrown together for that full cycleI assume (do to the differences in shading [red vs gray] of your example laterals) you understand the second lateral represents the current discussion lateral example (whereas the first example does not).
Price did head higher before it closed lower than its open on bar 1 today
Winner. Winner. Chicken Dinner. A subtle difference for sure.
- Spydertrader
-
How's this for b2b? Sequence ending at 9:55.Nicely done, daniel san.
As long as your Gaussian line weights have indicated nothing more than direction (Dom to Non-Dom to Dom), then yes, you have outlined the correct order of events.
Remember, we have not given a name to this specific container as of yet. Make sure your Gaussian annotations do not inadvertantly give an incorrect name to something, which in reality, exists as an entirely different thing (thereby sending you mentally 'off fractal').
- Spydertrader
-
YM suggests completion of a sequence at 09:54 but I fail to see how I should "see" a sequence completing on the ES at 09:55. At that time I have not had increasing B for the 2B.I refer you to this post earlier today ...
Price moving in the dominant direction (after a completed Volume Sequence) on decreasing Volume tells you a very specific thing.Also, See Jokari Window.
- Spydertrader
-
Is this the B2B2R2B to which you refer?Close, but not quite. Your annotations progress into the next set of events
To give yourself a hint. Take a look at the YM for this period of time. Does it make things clearer?
Please note, this is not a recommendation to use the YM for trading signals (at this time), but rather, a suggestion to use the YM as a tool for locating that which some might find difficult to see.
- Spydertrader
-
I don't understand why the 1st bar of this lateral is dominant, and had categorized it as non-dominant because it was a 2 to 3 of the previous down move ending 16:05 Friday. And it closed in the presumed non-dom direction.Isn't context a wonderful thing?
Certainly you'll agree (based on the fact that the market itself exists on a fractal basis) that even a non-dominant move (of a slower thing) must be built by a Full (Dom to Non-Dom to Dom) Cycle of a faster thing. Unless (and until) the faster thing completes its required order of events, the slower thing cannot continue.
Are you saying 16:05 to 10:05 was a dominant move and not a non-dom retrace, with the lateral's 1st bar closing dominant (long)?I have simply attempted to remind you of that which you already know - a Non-Dominant move (Up) must contain components which complete a certain order of events - irrespective of the number of fractals faster it creates across the entire movement. The Lateral in question represents a Dominant lateral because it develops in the same direction in which the market has shown dominance (in this specific case, B2B) and prior to the completion of the order of events required for this specific fractal.
Or is it Dominant for it's fractal only?With nested fractals, all dominance changes prior to the completion of a slower fractal apply to the specific (faster) fractal being built.
Or Dominant because the first part of the bar made a lower low 1st (and 16:05 to 10:05 was non-dom) in the dominant direction?Bar 1 (9:45) of this specific example closed in the same direction that the market provided dominance (in this specific case - B2B) for this specific fractal. The market did so prior to the formation of Bar 1 of this specific lateral.
Hence, we have a dominant lateral.
Now, in the words of Mr. Miyagi, show me B2B.
HTH.
- Spydertrader

-
Can you 'see' a completed Volume Cycle before the formation of the Lateral?Unfortunately, no. Would you be kind enough to point it out?Start with 16:05 PM (of the previous market day) and (of course) remove the overnight gap.
Everyone should then have the ability to walk through Points 1, 2 & 3 (B2B 2R 2B), or at bare minimum find B2B. If anyone cannot perform this task, then they do not fully comprehend this post and its accompanying attachment.
Focus on the words, and not just the picture.
Please note: I did not provide a 'word' associated with this particular container. Since the market exists within a fractal framework, we shouldn't need to. Please resist the urge to define the container itself. Instead focus on that which must build all containers, and then (at some point in the future) differentiate the containers from each other (just as we did this morning with a lateral).
- Spydertrader
-
I will look deeper into the drills to do more analysis.Just be careful not to overcomplicate things. Review the posts over the last 24 hours while looking at a screen shot of the various examples. Everything should fall right into place with respect to which of the things belong together - and which do not. For now, we want to stay focused on this specific type of Lateral (from the Lateral Formation Drill (and follow up) setting aside (for another day and time) those which do not conform.
Step by step, and piece by piece, one can then learn to differentiate that which one believes exists from that which the market has actually provide.
- Spydetrader
-
Today's 9:45 lateral boundary was created by 9:55 bar with a decreasing volume.Good. Now, set aside Volume (for just a moment) and determine if all of the examples under discussion form in the exact same (as our reworded definition) way. Those that do not form in such a fashion fall into a different pile. Next, look at context (VE's, declining pace or accelerating pace, etc.), and finally, check the order of events. Can you 'see' a completed Volume Cycle before the formation of the Lateral?
Now, bring Volume back into the analysis. Price moving in the dominant direction (after a completed Volume Sequence) on decreasing Volume tells you a very specific thing.
10:05 bar tried to break the boundary but failed and price exited the other direction.There is no try to, attempts to, or 'makes an effort to' do something. In a binary world there is only does or does not.
Did the market do that which was anticipated? Then a reason must exist for it to have done so. Locate the reason (as we have done here), and you'll know exactly what to expect the very next time the market provides the same scenario.
HTH.
- Spydertrader
-
I presumed in the past that the dominant lateral always exited in the opposite direction, and the non-domainant lateral in the same direction.Your statement provides an excellent example for seeing how the process of differentiation works.
You have created a 'working hypothesis' (presumption, thought, guess) - and one which you can look to the market to see whether or not the market concurs with your assessment. At 9:45 this morning, the market created yet another one of these example laterals (in the same fashion as The Lateral Formation Drill [and follow up]). Bar 1 (of today's formation) moved in the dominant direction. Price did exit this specific Lateral Formation in the opposite direction to Bar 1 (just as you anticipated). However, looking at The Lateral Formation Drill (and follow up), we can see that your hypothesis is not always proven correct. As such, something else must be at work here.
Does the difference have something to do with the lateral boundary test?
As humans, we use words to convey a thought or idea, but we also use words to portray certain characteristics of objects in certain ways (we attempt to 'paint a mental picture' in the 'mind's eye' of the listener). Perhaps, we can reword your statement here in an effort to paint a more accurate representation of what information is really important, while at the same time, provide an easy solution for avoiding any lingering confusion moving forward.
Rather than saying, "the market tests the Lateral Boundary created at Bar 1," subsitute the words, "the market creates the Lateral Boundary with Bar 1." Now, run this test across both examples under discussion (as well as other examples from The Lateral Formation Drill (and follow up). Does each example conform do this definition? Does today's (9:45 AM)?
Lastly, once one has determined the exact similarities of things, then one can look for the differences which indicate what must come next. Using the above (re-worded) defintion, everyone should be able to create (in their mind's eye and on paper) three possible examples of a Lateral which conforms to the examples provided in The Lateral Formation Drill (and follow up), but also represent entirely different things from each other. These differences (combined with order of events and context) tell the trader exactly what the market needs to provide.
HTH.
- Spydertrader
-
Are they acutally labeled correctly?Yes.
Isn't the first one also non-dom?
No.
rs5 has labelled the laterals based on the direction (Dom vs Non-Dom) of Bar 1.
- Spydertrader
-
Also the lateral boundary test is not at the same side.The Second Lateral (the 'non-dom' labled example) does not conform to the examples in The Lateral Formation Drill (and follow up). Understand why it does not.
- Spydertrader
-
Ignoring the rule that an IBGS with Increasing Volume terminates a LateralBefore one can concern themselves with how something ends, one must (for certain) know how that something begins. Adding uneccesary paramters provides nothing but uneeded complexity. As such, one need not consider (at this point) how any sort of Lateral examples end.
Remain focused on how any example begins in order to see whether or not any lateral you see conforms to the examples provided by The Lateral Formation Drill (and follow up). After you know you have an appropriate example, then you can determine what (if any) subtle differences (in the formation of the object itself) differ in such a way where one has the ability to clearly 'see' what information the market has provided. Finally, by combining this information with context and order of events one can know exactly to annotate a different thing on the chart's Volume Pane.
HTH.
- Spydertrader
-
In other words, how can one KNOW in real time that 1135-1215 and 1220-1240 tapes represent medium \R and medium /B as opposed to skinny r2r and skinny 2b of the container that one may think is moving the Price from Point 2 to Point 3 of the Traverse.You cannot see what the market has provided because of a bias caused by vocabulary. For now, try not to think in terms of 'tapes' building 'traverses' and 'traverses' building 'channels.' Instead, think in terms of 'fractals' (pipes, tubes, containers or pathways [whatever works best for you]) without names where one fractal builds another moving up to slower and slower fractals, but also, where one fractal is built by something faster moving downward.
Remove the overall bias by deleting your Gaussians, and look for an alternative way to annotate the area from 10:20 AM to 11:30 AM. For it is here where the real annotation error resides.
Once you can see why the 10:20 AM to 11:30 AM area cannot result in your current annotations, you'll have the answer to your question.
HTH.
- Spydertrader
-
Lateral Drill Study in progress.........Looks to me that you've already found the answer to the question, "What makes the examples all the same?"
- Spydertrader
The Price / Volume Relationship
in Technical Analysis
Posted
I never looked at the Gaussians supplied by TIKI. As such, I cannot speak to their accuracy. However, my comments about said "Chicken Dinner" did pertain exclusively to the correct analysis of the Outside Bar provided by TIKI.
The Lateral to which you refer did form in the dominant direction (Bar 1 of the Sym), it did form on decreasing Volume (again, bar 1 of the Sym and the black bar which formed an equal high with the Sym Bar 1 ) and it did form by a third bar creating an 'upper boundary' with Bar 1 of the Sym. However, these are not the only things known at the time. With respect to Order of Events you had a completed sequence (across a non-dominant segment of a larger trend). Context also played a role (although not important in this specific example. As a result of these three things, Price had to exit through the lower part of the specific lateral in question.
The day's second example (beginning at 12:50) formed in the same fashion (with subtle Volume differences), but the Order of Events was different (again context played next to no role in this specific example as well). As such, the outcome was different.
HTH.
- Spydertrader