
Welcome to the new Traders Laboratory! Please bear with us as we finish the migration over the next few days. If you find any issues, want to leave feedback, get in touch with us, or offer suggestions please post to the Support forum here.

Spydertrader
-
Content Count
389 -
Joined
-
Last visited
Posts posted by Spydertrader
-
-
Volume leads Price. Always. And without exception.
In order to comprehend how the above statement (both in concept and in practice) represents a true and accurate assessment of market dynamics, a trader needs to understand the basic structure of all markets and how such markets operate. Since all markets represent a fractal nature, it turns out, Mandelbrot had it right all along. By correctly and thoroughly applying a framework, in an effort to ‘see’ the various fractals operating on a market, a trader can begin to see the Price / Volume Relationship at work – all day, every day.
Succinctly, unless and until the components of one fractal reach completion, the next slower fractal cannot begin. It trading terms, unless and until the Volume Cycle Sequences reach completion, the current Price Trend cannot end.
In general terms: if Volume is increasing, then the Price Trend is continuing.
Such is the essence of the Price / Volume Relationship.
Much debate has ensued over the years with respect to whether or not Volume represents helpful and / or useful information with respect to understanding Price change. In addition, those individuals who do find value in Volume analysis have long argued their viewpoint for the best methodology for divining the information from Volume itself. For those interested in continuing such discussions, I recommend reviewing the plethora of threads already in existence as I have no plans to engage in yet another long drawn out Lincoln-Douglas, Presidential or Academic style debate.
Rather than create yet another environment for posting opinions or sowing the seeds for epic battles over dogmatic philosophies, my goal here is to provide a framework, for anyone with an interest, to learn how to learn to ‘see’ the Price / Volume Relationship at work as shown through the fractal nature of all markets. In other words, this thread isn’t about me teaching people to trade, ‘calling’ trades or seeking converts to a new religious cult. This thread is about the individual trader developing the skills needed, and the knowledge required, to learn to trade based on what the market says, instead of what the trader believes (or I post).
So, what can one expect from this thread?
Over the next few posts, I plan to detail the fundamental building blocks used in order for a trader to thoroughly, correctly and consistently annotate a chart across three separate trading fractals. By learning to see the visual cues provided by Price and Volume (Trend Lines and Gaussians), a trader can develop the ability to see the Price / Volume Relationship at work. I expect a number of questions with respect to the need for me providing clarification on a number of posts moving forward. Everyone should feel free to post as frequently as necessary in order to completely comprehend the various aspects of The Price Volume Relationship as presented. I encourage active participation from those attempting to learn.
In addition, everyone can expect to see plenty of information which flies in the face of conventional wisdom and long held belief systems. Contradicting conventional orthodoxy and religious dogma, when it comes to individual trader beliefs, often creates an almost visceral response from those who feel (for some unknown reason) threatened by the mere discussion of alternative viewpoints than exposed in the mainstream literature. Again, I have no desire to debate the validity of that which I use to trade on a daily basis. Anyone who feels they ‘know best’ or simply considers the information already presented devoid of value, should stop reading immediately.
To reiterate, this thread will not teach you to trade. If you are looking for a canned set of rules for entry and exit, look elsewhere. However, this thread will teach you to learn how to teach yourself to trade using the only tools you’ll ever need – a chart and your own brain.
Lastly, the market speaks on every single bar delivering its signals to the trader in a timely fashion – and well in advance of the next trend. It turns out; one need not know how long a particular trend will last. One only need know the signals for when a particular trend has come to an end. As all trends overlap, where one trend ends, the next trend begins.
The basic principles involved in learning The Price / Volume Relationship require no more than a few paragraphs to articulate. The repeated and consistent application of those principles onto the market represents the bulk of the effort required of the individual.
To Be Continued ....
- Spydertrader
-
Spyder, you have made a strong assertion and then you attempt to make it look like you are simply encouraging people to look for themselves. Come on. You are beginning to make as much sense as your mentor.
We live in a binary choice world.
Volume leads Price - Always represents a true and accurate statement, or it doesn't.
I've made a strong assertion (your words) which appears to directly contradict what you know to be true. In addition, my strong assertion appears to directly contradict both conventional wisdom and available scientific data.
As such, one can arrive at a simple binary choice. Either, I have no idea what the hell I'm talking about, or maybe (just maybe), I've described something of value.
As such, I encourage everyone to go and look for themselves because ultimately, the responsability for decision-making rests on the shoulders of the individual trader, and not with me.
If there is an interest (and to avoid taking this thred too far off topic), perhaps, I'll start a thread this week containing the specific instructions required to learn to see the sequences about which I have repeatedly spoken. For those less patient, a Google search should provide enough information to get one started.
- Spydertrader
-
I will leave you with that. If others are satisfied with your statement then fine - it takes all kinds to create a decent market.Again, you miss the whole point.
Nobody should remain 'satisified' with my statement. I encourge people to go take a look for themselves, rather than, rely on what others think, believe, post or do.
One of us actually 'did the work' using Excel.
One of us quoted the works of others.
- Spydertrader
-
"There is no evidence that volume causes volatility."Attached, please find results which indicate otherwise ....
-
Opinion: a belief or judgment that rests on grounds insufficient to produce complete certainty.How is your absolute statement on this page anything but an unsubstantiated opinion. I refer in particular to the confident assertion: "Volume leads Price. Always."
It's unsubstantiated to you.
The Volume Sequences, to which I have repeatedly referred, signal the end of one trend and the beginning of another. Unless and until Volume completes these sequences, the current trend has not ended, and the next trend has yet to begin. When these Volume Sequences do complete, then (and only then) can one expect to see the end of one trend and the beginning of the next.
Hence, Volume leads Price.
- Spydertrader
-
You are entitled to your opinion, I see it both ways.I haven't posted an opinion. I have described how all markets operate.
You reply to all posts except those asking you to demonstrate how you have come to such a conclusion.When asked to provide additional information, I have done so - in this and in other threads (both here and on ET). If you review your own posts, you'll see that you did not request additional information, you demanded I 'prove it.'
Been there. Done that. Own the T-Shirt.
If proof is what you desire, I'm confident someone can point you in the right direction.
I have no problem pointing people in the right direction whereby someone interested in trading can learn, or to provide additional clarification as necessary. However, I have no desire to debate the validity of the statements made, nor do I see any benefit to doing so. It's a very simple process, really. Either, I am full of shit or I am not. Either Volume works as I described, or it doesn't.
If you believe I represent the former, well then, placing me on ignore represents an efficient decision, and costs you nothing.
Understand, I'm not asking for people to believe. I've merely suggested some might wish to go take a look at that which so many believe cannot exist.
- Spydertrader
-
I am trying to say I think it depends on the person or system.Volume leads Price. Always.
These words do not aply to people or systems.
Volume leads Price refers to the fundamental principles by which all markets operate.
- Spydertrader
-
Eh? The height of the volumes bars is the volume it is all the information the volume bar gives.Much more information exists in a Chart Volume Pane than simply the 'height' of a specific Volume Bar. The slope of the changes in Volume changes over time. The Peaks and Troughs of Volume change over time. These represent just two examples of items which exist within the Volume Pane. Other information (such as the sequences mentioned previously) exist there as well.
I simply suggest some might find value in making an attempt to look at Volume from a different point of view.
I understand that you are trying to show fractal waveforms in the volume data. I'm not convinced you can extract four separate waves from that small amount of data. You seem to be using price as the primary cue as to where the volume waves are. I don't see how you claim volume leads price from this.Volume leads Price because unless and until the sequences of Volume complete, the trend cannot change. The largest (slowest) fractal cannot complete its sequences unless and until the smallest (fastest) fractals complete their sequences. Volume provides the signal indicating when each fractal completes, and as such, provides the signal required to see when one trend has ended and another trend has started.
Sorry, I'm not convinced about these sequences either. Never mind, whatever works for you.
DB brings up a valid point about vocabulary and common definitions. When I use the term 'fractal' I do not refer to 'time frame' (e.g. 5 min, 30 min, daily, etc.). Instead, I use the following definition:
(n) fractal (mathematics) a geometric pattern that is repeated at every scale
When I refer to Volume, I mean any information gleaned from a Chart Volume Pane as it pertains to the various Volume bars and not exclusively the absolute Values of each bar.
Good trading to you all.
- Spydertrader
-
Note to Spydertrader: Please take no offense.People remain free to read my posts or not, find value in my words or not, learn something, or not. I subscribe to no religion, philosophy or school of thought when it comes to trading. I simply trade using the principles of the Price Volume Relationship, and I have done so full time, as my only source of income, for the last five years.
In other words, being called a name by an annonymous username on an Internet Web Site doesn't come close to offending me.
Besides, this thread isn't about me, what methods I trade, or what I did on ET. It's about Volume. I'm sure the OP would want it to stay on topic, so why don't we all try to have some respect for the OP and stay focused.
- Spydertrader
-
I have attached a copy of yesterday's ES 5 minute chart to illustrate how I view yesterday's price action. Price is its own indicator, and it is in need of no additional, ancillary, and derivitive confirmation. Nothing other than what presents itself on the chartt throughout the day is necessary to trade profitably. Of course, price action is free.First off, no need to apply any sort of 'Gap Rule' to the open. Gaps do not exist. Simply 'mentally' slide the market open to the prior day close, and the market sequences continue where they ended.
Second, without Volume, Price does not exist. In other words, unless and until a trade takes place, Price doesn't hit the tape. That trade represents Volume.
In addition, the sequences of Volume must complete before the current trend (measured on whatever fractal one desires) reaches completion.
Hence, Volume leads Price. Always.
- Spydertrader
-
I can't see any relationship between your lines/labels and the height of the volume bars."Height of Volume Bars" represents only one possible relationship shown on the chart with Respect to the Volume Bars. By first understanding the fractal nature of the market, and then, applying that understanding onto one's chart, the trader can readily see the same sequences repeat - over and over again.
- Spydertrader
-
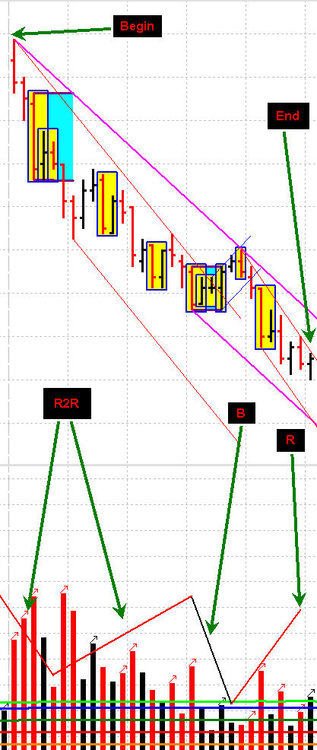
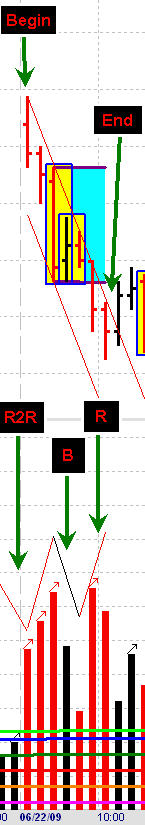
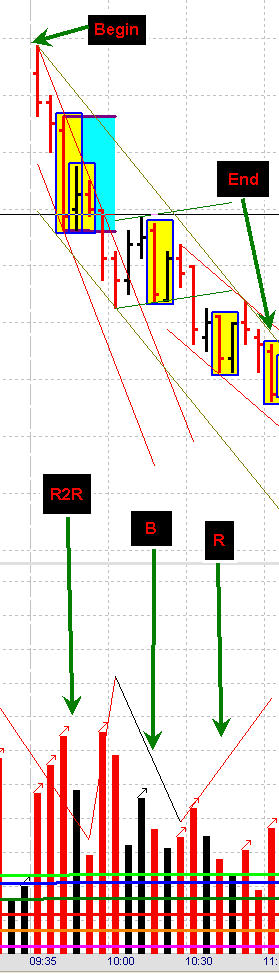
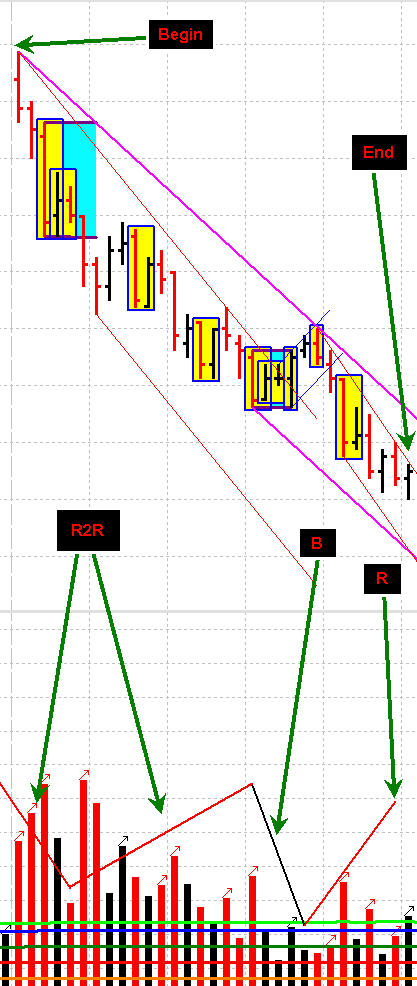
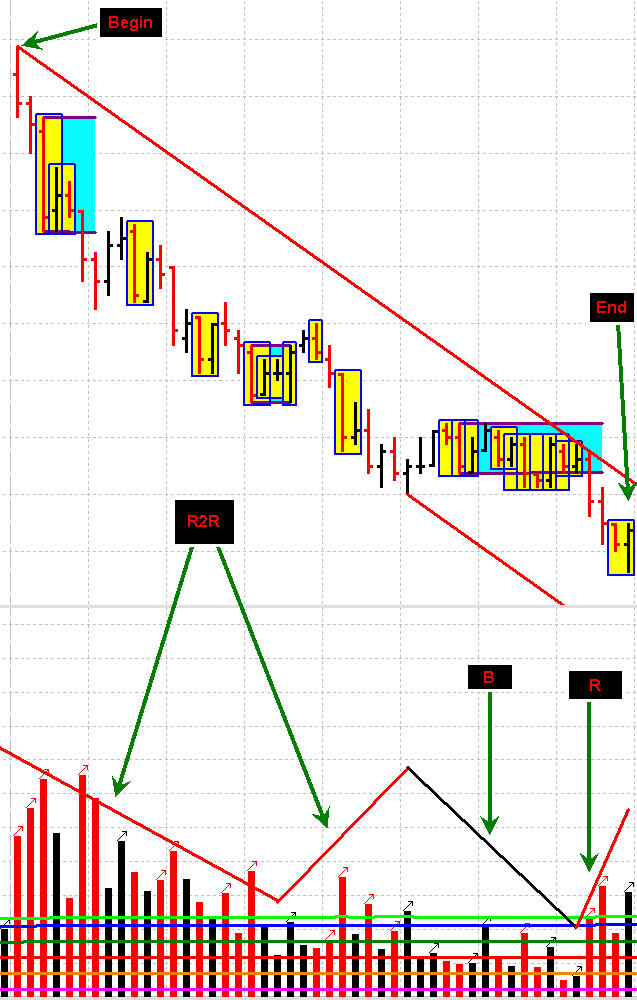
Interesting spyder. How about some charts to illustrate the idea being presented here?Sure thing. Let's start by taking a look at today's (6-22) S & P 500 E-Mini (The ES) using a five minute chart. Thinking fractally, we want to locate the Volume Sequences which the market displays all day, every day in every market. By describing these Volume Sequences using Volume Color (Black for Up and Red for Down), a trader should expect to see R 2 R 2 B 2 R (for a down trend) and B 2 B 2 R 2 B for an Up Trend. Again, thinking fractally, the market should provide these sequences on each and every trading fractal.
An example of a very fast fractal:

An example of a slightly less fast fractal:
An example of a slow fractal:
An example of the slowest fractal:
As you can see, irrespective of the chosen fractal, the market provides the same exact sequences. Combine these fractals, and a trader can 'see' that which must complete.
Learning to thoroughly and properly 'contain' Price and Volume in order to more easily see these sequences represents the first step toward profitability.
HTH.
- Spydertrader


-
Clearly, a relationship exists between both Price and Volume. Those who disagree simply have yet to see that which exists right in front of their nose. By understanding how all markets exhibit a fractal nature, one can take the first steps required to see the Price / Volume Relationship in action - irrespective of market and / or time frame used to trade.
For example, using the ES 5 minute chart, and only making decisions and taking action at the close of a 5 minute bar, the market provides crystal clear information as to where Price sits with respect to the Volume Sequences which require completion. By 'containing' Price within these Volume Sequences, the market reveals its trends across three seperate fractals each day - every day.
Volume leads Price.
Always.
- Spydertrader
-
Is there programming code for this indicator? Thanks.If Volume Bar > Volume Bar.1 then bar color = blue, else bar color = red
-
Congrats on reaching this milestone.
- Spydertrader
-
Do I trade Rollover days? Sure do. No reason not to. Absolute levels of Volume may differ from one contract to the next, but the Volume Sequences exist irrespective of the number of market participants. As such, rollover day represents a day no different than any other.
- Spydertrader
-
I have got 2 stars for this thread...I rated it five Stars in order to improve your average.

- Spydertrader
-
-
Additional Gaussian information to go with the Trend Line information posted above. See Attached.
- Spydertrader
-
So how do I know "whether or not the market has provided a signal for continuation or change"?No need to place the cart before the horse.
In my previous post, I anticipated your question about context (continuation or change), and provided advice indicating what one needs to do before learning about context.
Until the time comes to learn about context, learn to annotate your charts in conjection with the gaussians attached to volume. In such a fashion, the market provides the answers needed.In other words, Volume leads Price.
HTH.
- Spydertrader
-
So which is the right trend line for an outside bar?In a similar fashion to the Sym Pennant, either RTL's represent correct annotation depending on whether or not the market has provided a signal for continuation or change (context). Until the time comes to learn about context, learn to annotate your charts in conjection with the gaussians attached to volume. In such a fashion, the market provides the answers needed.
- Spydertrader
-
On your diagram, what does "The 'tell is shown in pink as RTL always" mean?The Pink Line shows where to place the Right Trend Line.
- Spydertrader
-
Thanks. So how do you use this stuff? What are the signals?Start by learning to thoroughly and correctly annotate a chart.
- Spydertrader
-
From the Bottom Up, the colored lines in the Volume Pane represent different 'Pace Levels' (ranges) of Volume. VDU, Dry Up, Slow, Medium, Fast, Extraordinary. The 'Blue P' represents Peak Volume.
- Spydertrader
The Price / Volume Relationship
in Technical Analysis
Posted
(M-A-D-A)
Monitor, Analyze, Decide, Act. This four part paradigm represents the process by which individuals choose to enter into a trade. We will spend the vast majority of the time focusing on, and learning to, properly Monitor the market in an effort to thoroughly, completely and correctly annotate a chart. Although The Price / Volume Relationship operates across every trading instrument, for the purposes of this discussion, we will use the S & P 500 E-mini futures contract (commonly referred to as ‘The ES’). Please use a Five minute ‘Bar (OHLC) Chart’ (set for RTH [9:30 AM to 16:15 Eastern]) - only showing Price and Volume – you’ll require nothing else.
To Be Continued ...
- Spydertrader