
Welcome to the new Traders Laboratory! Please bear with us as we finish the migration over the next few days. If you find any issues, want to leave feedback, get in touch with us, or offer suggestions please post to the Support forum here.

Spydertrader
-
Content Count
389 -
Joined
-
Last visited
Posts posted by Spydertrader
-
-
When you say RTL and LTL are you now talking about merging the individual tape pairings into trends or are you simply saying when drawing in the tapes for individual pairs to start with the RTL tape first and then move on to the LTL tape?All containers have two trend lines - a right trend line (RTL) and a left trend line (LTL). Price annotations begin with an RTL, and end with an LTL. For each case (A - J on page one of this thread), you must annotate an RTL and an LTL. When combining these cases, you must annotate an RTL and an LTL. When annotating the slower fractals (traverses, channels), you must annotate an RTL and an LTL. Every container you build must have an RTL and an LTL. In addition, your Volume Pane must contain the Gaussian annotation which match the Price containers.
If I might show my ignorance could I also ask how the LTL is to be formed? Is it simply following what one would do for the RTL (connect the bottoms/tops) or is the LTL formed by duplicating the RTL and placing it at the opposite end so they are parallel to each other?We all started out a bit lost and unsure of the road ahead. Over time, the feeling of being overwhelmed will subside as you gain knowledge, skills and experience. To answer your question: Choice B.
- Spydertrader
-
Comments?Color your bars red and black matching volume to Price.
Draw your RTL first (except in cases where you cannot), and then add the LTL.
- Spydertrader
-
:doh:LOL. It could be much worse.
After all, you could have looked at a chart posted by Mktr, responded to a question posted by a different poster (you), then apologized to a third poster for misunderstanding his question (emac) - all while not realizing you were speaking to three different people (something I only noticed just now).
ROFL.
That'll teach me not to look at who posted when responding. :doh:
- Spydertrader
-
Apologize for not able to get it the first go from your answer but I am working on it .
.Review the car question again. Then, review your response.
According to your response, the (subconsciously determined best) route you travelled, somehow, represents a determining factor as to whether (or not) you have arrived at your destination.
Really?
The car question, while appearing cryptic at first glance, shows you how to determine the exact nature of a problem. Your response includes information not requested by (nor relavent to) the question itself.
The car question (like remaining on the same fractal) requires a certain level of information in order to respond correctly. Not more information, and certainly not less information, than required. Responding outside the required parameters causes the indivdual (driver or trader) to arrive at the incorrect conclusion.
Think. "How do you know you have arrived at your destination?"
What you do not see in the correct answer to this question is also what you do not see when you ask questions of the market. Once you fully understand the car question, then (and only then) should you attempt to apply what you have learned onto the market.
In other words, if you cannot understand the answers provided by the market, ask it different questions.
HTH.
- Spydertrader
There is only ever one problem (question) in life: "How do you go about the process of solving problems (questions)?"
P.S. Another way to do the same question is to ask, "How do you know you have not arrived at your destination when driving your car?" Some people find it easier to understand the first question by working on the second question first.
-
Concerning annotating correctly, I started with bar 29 b2b followed with 2r and then a 2b pt 3 ending 1300 hrs.My apologies.
It appears I have inadvertantly attributed your issue to the DOWN containers which ended at noon. I recommend not applying my comments (with resepct to the down containers) onto your issue with the Up containers (which commence at noon).
With respect to fractal jumping you can locate the solution to your concerns by using the exact same logic used when driving a car.
When driving your car, how do you know when you've arrived at where you are going? Understand the process used to determine the answer (to my question about the car), and you'll find the missing piece which caused you to ask your question (about fractal jumping) in the first place.
There is only ever one problem (question) in life: "How do you go about the process of solving problems (questions)?"
- Spydertrader
-
Any advice from the old hands here on things to look for to avoid jumping a fractal in this situation?Begin your annotations for your down container from the correct Point One.
- Spydertrader
-
- a pt1 of a new long (also FTT of a short)
On my charts, the market creates the low of 7-20-2010 on bar one (9:35 AM Eastern Time [and close of ES 5 minute Bar]). If your charts show the same, you might consider rephrasing your question. Also, if you choose to rephrase, consider adding context (tape point one, traverse point one, channel point one), else you might receive a yes answer to your questions, but interpret the yes answer in a way not entirely intended.
FYI: The why portion will be, "because the order of events of the specific fractal in question reached completion, and provided a signal for change."
HTH.
- Spydertrader
-
did I draw the volume gaussians correctly?
No, but see cnms2's chart for a corrected version.
Is using WWT? logic the only way to reject annotating the 13:00 - 13:30 range as the TRAVERSE level 2B?
No.
- Spydertrader
-
I did not mean to give you the impression that I am new to trading. I may trade like a beginner, but I have been dedicated to watching intraday price behavior for several years on a full time basis.The questions you have posted indicate your 'new-ness' with respect to The Price / Volume Relationship. This thread contains everything required in order to learn how to learn what information the market provides. With respect to whether or not you were "new to trading" I made no assumptions or judgements.
By 14:15 it was clear that the dominant volume was to the upside, but was there any way I should have been able to see that earlier.Most definitely. Each fractal (tape, traverse and channel) contains elements of both dominant and non-dominant movement. These order of events cycle repeatedly. As I indicated earlier, note how nesting of the various fractals develops across a trading day, and you'll find things much easier to see.
HTH.
- Spydertrader
-
You stated you did not use price targets, so I am curious as to whether you use stops?.I do not regularly use stops. However, If I place a trade, and decide to run up to the bank, or to the liquor store, I'll place a stop in case I am delayed and the market completes its order of events prior to my return.
My guess is you just let structure guide you, and will exit a trade if and when the information provided refutes the reason you originally entered the trade. Is that correct?.Of course. Time is always on your side here. A minimum number of Bars must develop before an order of events can complete. While no 'maximum' number of bars required for an order of events completion exists, by understanding where one sits with respect to the right side of the market, one can simply relax and wait patiently (or respond to questions online
 ) while the market arrives at the next logical domino required to fall.As regards volume sequences, are we most concerned with relative volume, meaning the volume of one candle relative to the last, or how volume relates to the previous trend. .
Since the market exists fractally, all manner of sequences will make themselves known to the trader who has learned to see them. And therein lies the problem for most people - remaining on the same fractal throughout the trading day. Since 10:05 (Eastern Time [06-03-2010] and Close of ES 5 minute Bar), the market has headed lower. It did so slowly at first - appearing almost to struggle as the order of events began to take shape - and then, the market seemed to pick up momentum and move a bit faster as we headed to the noon hour. Again, a trader has the ability to know that all manner of sequences (on several different fractals) have developed across this period of time. While one can often 'see' numerous fractals on any given trading day, the market provides very specific information allowing the trader to annotate their chart by simply focusing on three fractals on any given day. I annotate these fractals by using a skinny line, medium line and thick lined convention. Over time, traders learn to 'filter out' information which does not pertain to them (or more specifically, their trading fractal). Until one arrives at such a point, take in all the information available, and review during debrief.
To highlight what I mean, if you look at the candle today on es at 10:50 est it closed above the prior candle on higher volume, yet the subsequent limited up tape occurred on volume lower then the preceeding down tape. (I would post the chart if I knew how to do that on this site). The move was terminated on the 11:10 candle, and the subsequent down tape while it did have increasing volume on two of the bars, the volume of this downtrend was lower then the volume of the preceeding up trend..The market moves in dominant and non-dominant fashion. Focus on what you believe you see, and later (during debrief) learn if your conclusions drawn from specific observations panned out correctly, or do you still have more to learn about a specific area.
So what should I be focused on. The volumes as they relate to each tape as either increasing or decreasing, or the volume as it relates to the preceeding tapes or both?.I cannot 'see' through your eyes, but I can 'see' where your brain sits by reading the questions you have asked. You need to take it all in right now. Look for an order of events completion on several fractals throughout the day. Note how the fractal nature of the market exists throughout the trading day, and how each fractal nests within another.
Earlier in this thread I delineated how to go about the process of learning to learn. I encourage you to follow those guidelines. Everyone wants to learn it all (all at once), and, as fast as possible. Unfortunately, the human brain doesn't function quite that way.
Crawl. Walk. Run. (and then) Fly.
Hope you can understand the question.When you respond to a specific post (after clicking 'reply' or 'quote'), scroll down a bit and you'll see a 'manage attachments' button. Click it, and you'll be able to upload any number of items to be included with your post.
HTH.
- Spydertrader
-
One of the demons I have been trying to rid myself of is exiting winning trades too soon.As a trader gains more and more experience (and ultimately, 'sees' more of which the market provides each and every day), one notices 'subtle differences' which signal, "something is different here" (or, what wasn't that?). Noting these subtle differences (and the context in which they developed) allows the trader to transition from an area which once provided confusion into a thought process which results in certainty. In the beinning, a learning trader can only 'see' certainty based on Price. Eventually, the learning trader comes to realize the market provides certainty based on Volume.
The Wash Trade Drill also builds confidence in that the trader develops a sense that they can exit at any time without experiencing a significant loss. Since the goal of the Wash Trade Drill is to neither expereince a significant loss or profit, the goal (breaking even on every trade while performing the drill) becomes a far more difficult task than it sounds.
However, irrespective of methodology used to trade the markets, every trader battles the twin deamons of fear and Greed. Fortunately, focusing on The Price / Volume Relationship greatly minimizes the opportunity for these deamons to have influence over the decision-making process.
Do you have any reason why you prefer OHLC bars to candles?Long ago I used Candlestick Charts. They have their place in terms of information provided by certain Candle Characteristics. However, Candlesticks represents an attribute of The Price Pane on a chart. We want to maintain a focus on another Pane of the chart - The Volume Pane. Anything which steers one's focus to another area of the chart (other than volume) can often retard progress as a new trader attempts to learn.
Doesn't seem to me an important difference, but you seem to feel that candles may obscure the message of the markets?I cannot speak to the level of mental gymnastics required to see that which the market provides while using a candlestick chart. However, if attempting to learn a skill by viewing what others do (and seeing their posted charts), I'd think far less translation is required if everyone attempts to play from the same sheet of music.
Of course, Your Mileage May Vary.
- Spydertrader
-
You said you trade the "tape" almost exclusively. Do you always wait for a 5min candle to complete before acting, or will you close or open a position sometimes in anticipation of the candles outcome?While I often enter prior to the close of a five minute bar, doing so certainly isn't a requirement. "At some point" before the close of a 5 minute bar, the market 'locks into place' the next step in the order of events. While the "at some point" time develops at a different point in time (relative to the close) for every bar, one can learn to correctly anticipate 'what must come next' by using medium and / or fine level tools. However, on most days I trade, I am in no rush, and since I prefer to chat on the phone or sit outside, rather than, glue myself to a computer chair, I'm perfectly content to wait until the close of a bar before I take action.
I would think that as price reaches a target, one might want to exit even though a candle has not closed. Or do you ever drop down to a 1 or 3 minute chart?
I don't use 'candlestick' charts. I use OHLC 'Bar' Charts.
I don't set 'Price Targets' before entering a trade. I have no idea how long a particular trend will last, nor any clue as to how far Price will move when I enter. I only know how trends begin and how they end. Trends begin and end in the exact same fashion, it turns out. Of course, this answer also depends on 'context'. For example, if I see the market has reached 'Point Two' of a specific container at 3:50 PM Eastern Time, well, I'm going to exit, rather than hold between Points Two and Points Three.
With respect to 'dropping down' to faster time frames, unless I have the Medium Level Tools on my computer screen (two minute YM / STR - SQU), I have no need to use anything other than an ES 5 minute chart. Remember, this whole deal works (quite effectively) on a daily chart (and any other time frame for that matter). Effectiveness and Efficiency come into play once one has mastered the initial steps needed to see that which the market has provided.
HTH.
- Spydertrader
-
I am curious as to how you developed your personal skill. Did you have a mentor at one time?About ten years ago, I traded stocks using nothing but Price Action as my guide. At that time, I focused on the SPY, DIA and QQQ as my trading vehicles of choice (Hence the username - Spydertrader). After stumbling across some posts on USENET by Jack Hershey, I felt something about his writings resonated with me - in that, I had seen something (in the markets ) which appeared to correspond to the information delineated within his posts. Although quite a number of individuals within the USENET Groups of MISC.INVEST.STOCKS and MISC.INVEST.FUTURES argued (vehemently) that his verbose contributions made no sense, I felt otherwise. At that point, I began my own journey (the vast majority of which I cronicled on the Elitetrader.com web site). However, Jack has always insisted I use the market as my guide.
I would be very interested as to how you approach the market as a trader. Do you trade the intraday tapes, or are you looking more to postion for traverses, and channels, or all of the above?I focus on remaining on the fractal best described as a 'tape' - almost exclusively. I do, on occassion, intentionally "jump fractals" because doing so remains my first recourse (based on how I originally learned these methods). When I first learned to follow the Price / Volume Relationship, I used all tools available (Coarse, Medium and Fine). As a result, a "signal for change" represented a reason to reverse (irrespective of fractal chosen for trading). It isn't an 'easier' path by any means. It was simply the only path availble at the time (to me, based on my own mental filters).
Over the years, I've attempted to make life somewhat easier (some may argue that I haven't succeeded in that regard) by encouraging people to focus on one tool (Coarse) before moving onto another.
While I agree, actually trading these methods involves far more than simply drawing lines on a chart, profitable trading represents the consequence of a fully differentiated mind. In other words, unless one knows why someone has placed a specific line on a specific chart, at a specific point in time, then one might as well flip a coin. However, a complete and thoroughly annotated chart does indeed provide all the answers anyone ever needs.
HTH.
- Spydertrader
-
Since each day may be a continuation of a sequence and then completion, how common is it that one would see more then one or two completed volume sequences for an entire day?As a trader begins to learn how to thoroughly annotate a chart, one's mental calibration exists at a certain observational level. By bringing into the analysis the market's fractal nature, the learning trader begins to learn to see mulitple sequences complete nested within a larger orientation. Pace often determines how many fractals one has the ability to see. As a result, it is far more rare to see only one completed order of events on any given trading day. However, many individuals (just beginning the learning process) often have yet to develop the ability to see that which the market has provided.
Note the ES for today.
Moving forward from 9:55 (Eastern Time and Close of Bar), one can 'see' a number of fractals completing - some faster and some slower - as time progresses. Once a trader determines which fractal best mirrors their skill level and trading goals, then that trader simply 'waits' until said fractal moves through the order of events.
As an individual gains additional experience by reaching various 'knowledge plateaus' with respect to the learning process, what once seemed obscured or 'impossible' transitions to ordinary and mundane.
- Spydertrader
-
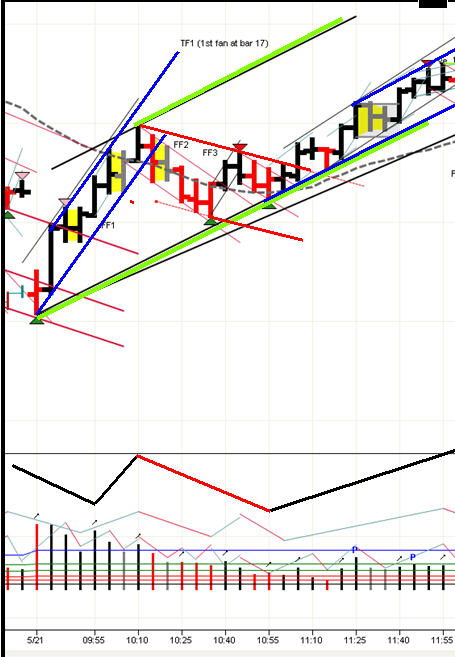
Hope I am getting it close to getting the "why" correct.All markets exist fractally. Therefore, if one wishes to correctly (and thoroughly) annotate a chart in order to reflect this fractal nature, one must know why (according to your convention) the medium weight Red and Blue containers represent one fractal, the light green (thick) container represents a slower fractal, and the black and red (skinny) lines (inside the down medium red container) represents a third (but faster) fractal.
**Please note, I have not defined these three containers as 'tapes' or 'traverses' or 'channels' (or even goats).
Each of the containers annotated (irrespective of fractal) contains a Point One, Point Two and Point Three. Volume moves Price in a very specific way between these Points. Beginning with each of the Two Bar cases (posted earlier in this thread) expand on what you know as additional bars arrive on scene. At some Point, you'll fail to see that which the market has provided. A short period of time later, you'll ask yourself the question, "How should I have known (or seen) that which I must have missed?"
Once you have the ability to form the question, you'll find you already know the answer.
- Spydertrader
-
If you were to put together a top 10 list, or just one single thing that a trader should have to be successful what would those be??In a word........
Discipline.
Having the discipline it takes to keep after your trading education after putting in long hours to study, prepare, test, analyze and review the rules, software, trading vehicles and systems before ever placing your first trade.
Having the discipline to start with small sizes as you continue to learn and trade.
Having the discipline required to wait to trade real money with maximum leverage until you achieve proper capitalization for your trading goals.
Having the discipline required to remain patient while waiting for the most opportune time before entering a trade.
Having the discipline to exit a trade and take a loss when the market tells you you were wrong this time.
Having the discipline to exit a trade when you reached your target by not permitting greed to influence your decision.
Having the discipline required to control your emotions before, during and after a trade.
Having the discipline to follow your well tested and proven trading system rather than override it simply because "you know better."
Good Trading to you all.
- Spydertrader
-
What would be the right way to annotate this type of situations as I find that it does happen quite alot ?See attached.
Based on your annotation convention, you appear to see the attached chart in terms of three equal containers which create a larger (light green) container. In other words, each of the three equal containers (two blue up and one down red) form in the exact same fashion and exist on equal footing - relative to one another. However (as cnms2 pointed out), your Gaussians fail to match the convention used in your Price Pane. Moreover, even with adjusting your Gaussians correctly, it appears as though you have yet to determine why the three equal weight containers exist in the manner presented.
Remember, it is not enough to simply annotate lines onto a chart. One must strive to understand the 'why' behind the action.
Begin with asking yourself whether (or not) you have accurately applied the order of events onto this specific chart in a manner applicable to the number of fractals observed.
- Spydertrader
-
1) has anyone used this system of finding laterals to predict a move in the market, or is it all reflective interpretation?
As you continue reading, you'll eventually arrive at a drill involving Lateral Formations. By working through this drill you'll begin to see how the market provides subtle differences, which, when combined with context, and order of events, allow the trader to know what exactly has developed (in the past), what information the market is signalling (in the present), and what the market must do next (on each and every fractal).
2) does volume act independently, and can volume change show price change/ trend change ahead of time?
Volume leads Price - always. Note the chart examples others have posted. Can you see a Pattern within the Volume Pane as shown by the accelerating and decelerating lines? Note how this very same Pattern repeats on every fractal (line thickness). By learning to thoroughly annotate a chart, one can learn to 'see' that which most people believe cannot possibly exist.
1) what seperates a ftp, fbp, and stitches.... they all look like stitches to me... The only pattern I could see was that ftp, and fbp have a flat top or bottom, and then shortly after those some trend lines are drawn?
Pennants (FBP, FTP or SYM) and Stitches represent a few examples of Two Bar Formations. Pennants always have Bar Two (of the formation) showing less volatility than Bar One (of the Formation). Whereas, Stiches always have Bar Two (of its formation) showing increased Volatility (when compared to Bar One).
2)I'm just learning about volume... other then the obvious signs of large investors ..... How the heck can you tell weather the volume line goes up or down... it's not like his first example where they all go up a hill gradually and then down gradually.... they zig and zag... how can I tell which way the line is to be drawn over it, and what do the arrows pointing of the top of the volume bars mean? sigh.....pant.....sigh.....
Look closer to see that which currently eludes you. Continue reading in order to gain insight through the observations of those who travelled the road before you. Allow the market to provide the conclusions you seek.
3)what is this methodology attempting to bring to light? what is the practical application of this so that I might try and reverse engineer it?
The Price / Volume Relationship tracks market sentiment on each and every trading fractal. By learning to differentiate between that which appears to be, from that which actually is, one can learn to extract the market's offer on any trading day one chooses.
No need to reverse engineer, guess or predict. One simply needs to learn to understand the information provided by the market each and every day.
The information, guidance, drills and advice contained within this thread attempts to show (those individuals with an interest) how to teach oneself the process of 'how to learn to trade.'
Success is consequence of a fully differenciated mind.
HTH.
- Spydertrader
-
Congrats on the new addition to your family.
- Spydertrader
-
Would you please explain how to recognize 13:20-14:00 as the non-dom 2b of r2r2b2r beginning at 12:40 and not a dominant 2b of b2b2r2b beginning at 11:40?The order of events for any fractal exists and is well known to every individual following any discussion of The Price / Volume Relationship. The pattern repeats throughout a trading day - without error or anomaly. If you'll say out loud the order of events (piece by piece) as Price moves from Point One to Point Two then from Point Two to Point Three, and finally, from Point Three to FTT (with as much precision as possible), you'll hear yourself speak that which your brain already knows.
Now, view volume in the area you have outlined.
Does the order of events match that which you have spoken aloud?
- Spydertrader
-
As always, comments appreciated.See cnms2's comments on rs5's chart.
- Spydertrader
-
can anyone explain what the 'P' in the chart, volume pane, represent?The Blue Capital 'P' represents 'Peak Volume' as defined by an acceleration of a Gaussian Slope. And, yes, it is automated.
- Spydertrader
-
This happens very often on my charts. Any help would be greatly appreciated as this is a major obstacle for me.Your annotations exist accurately, or they do not. Double check any 'math' used for carry over containers (unless gap removal is automated). Review how the black container lines were drawn. It's easy to create error by failing to place a trend line on the exact low or high of the specific Point Three (or Point Two) - especially with multiple day trends. Double check highs / lows for the sepcific bars used with another data source to ensure you don't simply have a data source issue.
- Spydertrader
-
Thursday 15 April 2010Look closely at the final 6 bars of the day. Do you see anything you might want to annotate?The rest of your chart looks very nice.
- Spydertrader
The Price / Volume Relationship
in Technical Analysis
Posted
And so begins your journey .......
- Spydertrader