
Welcome to the new Traders Laboratory! Please bear with us as we finish the migration over the next few days. If you find any issues, want to leave feedback, get in touch with us, or offer suggestions please post to the Support forum here.

Spydertrader
-
Content Count
389 -
Joined
-
Last visited
Posts posted by Spydertrader
-
-
My understanding is that a container is defined by its RTL and LTL and the volume sequence, but I do not know if/when the RTL should be accelerated or decelerated, and I do not know how to recognise volume sequences on the different fractals because it has never been explained.I did not ask how a container is defined. I did not ask how to build a container. I did not ask how you could know to remain on the same fractal. I did not ask how you could know an FTT developed on a specific bar. I only asked how one can know that it would be impossible for the market to be continuing to build a down container.
At some point in time it is impossible for a down container to be continuing to be built. Whether or not you know the exact bar where the down container stopped and an up container began has nothing to do with the question I asked.
Think.
We are told earlier in the thread that the volume pane tells us what we have (tape, traverse, channel etc) but I don't see any explanation of that either.
I've been attempting to show you how to teach yourself these things beginning with very simple logic. Unfortunately, I have not been successful in this endeavor. Again we are not talking about Volume sequences, or order of events right now. I only want you to think critically for a moment and understand the question being asked.
"When do you know with 100% certainty that the market has indicated building a down container is impossible?"
Do not overcomplicate this question.
Perhaps you could put us all out of our misery by explaining to us how YOU know with 100% certainty that the down container completed today. Telling us that the "market tells you" is futile.
Let's be clear on something. I did not ask, "How could you know the market already completed the down container?" I asked, "How you could know with 100% certainty the market completed its down container today?"
In a two demensional environment, it is quite common for people to 'read into' things an unintended meaning.
So let's try one more time with the question:
"How can you (or anybody following along with this discussion) know with 100% certainty that the down container, which began on 10-13-2010 (at 14:15 Eastern Time), must have ended at some point in time today (10-15-2010)?"
- Spydertrader
-
Undoubtedly true, but the problem lies in knowing what defines the point at which one knows this, what it is NOT constructing, and what the "other thing" actually is, and on what fractal. The general principles given at the beginning of this thread fail to make this clear.Once again, If you'll simply wait until the market has completed the construction of its down container, then you'll absolutely know how the market moved through the order of events on all fractals.
Now, how can you know with 100% certainty that the market would have completed its down container today (10-15-2010)? What event would tell you for certain such a thing had developed?
At such a point in time, you'll have everything required to annotate a chart correctly in hindsight, which as a result, will provide you what you need to know whether (or not) you have remained on the same fractal each step of the way.
- Spydertrader
-
Suffice it to say, if my concerns are not rational I will accept that and move on
Think for a moment. If you have concerns over "some yahoo painting the tape" and causing Price to close on the ask vs the bid wouldn't you have the exact same concern for the VE creation in the first place? (e.g. not quite touching the LTL, on the LTL and through the LTL)
- Spydertrader
-
Well, I know that not all VE's cause or create an accelerated container else the Pink container in this chart would accelerate. So, there must be a difference in these two examples that will be valid for all VE's that cause an accelerated container.(?)Yes. There definitiely must be.
- Spydertrader
-
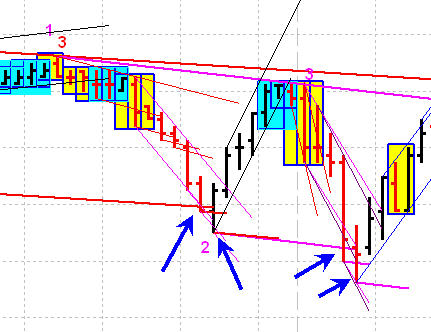
I am working under the belief that I should know the down container is not finished as soon as the first pair of blue arrows occur. So, by EOB blue arrow #2, I should know that the down container is continuing. If this is not the case please head me off so that I can stay on the reservation .
.You are not wrong.
Well, looking at only the two medium containers and focusing on the blue arrows I see two differences.
1. The first pair has a bar that VE and closes beyond the original LTL
2. bar 2 of this pair does not close beyond the previous VE LTL.
Now, it seems like I am focused on where these bars close
You are foucsed on two things in this context:
1. Volume
2. Where Price closes relative to a trend line.
Your concerns with respect to where Price closes relative to the Bid / Ask have resulted from your failure to 'think through' the possibilities of Price Close relative to a trend line.
Once you work through these possibilities, you'll see what concerns you isn't logical, nor rational.
- Spydertrader
-
Darn right I don't ...
So figure out at what point you can absolutely know for certain the market completed building a down container, and when that moment arrives create the annotations required of a completed channel.
- Spydertrader
-
Perhaps somebody can post a correctly annotated chart of today so I can see what I did wrong?You failed to follow directions ...
Once you can know with 100% certainty that the down channel has completed, you can then go back, and create annotations which indicate same.Then, you will have learned how to logically, correctly, and completely annotate a chart. Whether or not you realize that you've learned this skill is another matter entirely.
Please note. I have not inidicated whether the down container has completed its trend, or if it has not. I'm simply pointing out the fact that you do not yet know the answer.
-
expand on a volatility expansion..and there I was hoping for a gaussian fractal solution. No mind, perhaps they are connected.Of course they are connected.
I think it's to do with: whether the VE allows an RTL to be acceleratedMust certainly it does.
And since you know when you are permitted to annotate a Right Trend line, you can then know exactly what the market must do next.
and if to increasing volume does the close of that bar need to be anywhere spcific to the close of the previous bar ?Look at the chart snippet in an effort to locate the answer you seek.
and if FTT'd, then we have a new P1 for a new trend and the new trends P2 needs to be outside the last accelerated RTL (magenta) for the guassian B2B (if new trend is up) to be on the same fractal as the last 2R of the previous trend...Gee, it's starting to sound like you have more answers than you believe you have.

- Spydertrader
-
I have noted the differences I see at the blue arrows.For now, only discuss the similarities and differences between the Red and Pink Medium weight lines. Act as if the skinny lines do not exist.
The first group of VE's did one thing, while the second group did another (based on what the market did after what is shown in the chart snippet.
Later, use the YM to 'see' the differences in the skinny line areas.
Remember your original issue: What takes place as a result of a VE.
- Spydertrader
-
the suggestion might be that when we have a VE we (edit) have pushed the P2 of that container furthr out so will need to have a NEW P3 and there for a new RTL ?You might wish to expand on this point somewhat. Note the chart snippet I posted and the blue arrows.
- Spydertrader
-
Without some guidance for distinguishing fractal level for each container,the nesting seems to come unravelled pretty quickly.
The market always provides the guidance you seek. One simply remains patient until the market has provided certainty for your specific level of knowledge, skills and experience. Once the market can no longer be constructing one thing, it must be constucting another thing.
Later, once you've developed the necessary knowledge, skills and experience, you'll not need to wait as long to have reached 'certainty' with respect to what the market has constructed.
- Spydertrader
-
If I understand the process correctly, one starts with the smallest fractal- the tape- since every larger fractal is confirmed by the next smaller one, and because e.g. traverses are composed of tapes.One begins the process of learning to annotate by understanding the ten cases presented at the beginning of this thread. These ten cases provide a foundation for accuracy and precision.
So the process works by drawing tapes, then finding pt 1,2,3 of the traverses, created by the tapes, and then finding pt 1,2,3 of the channels etc.?
The process 'works' when a trader has learned to 'see' the order of events develop on three fractals (one above, and one below, the trading fractal)
I am asking this because I have seen charts which do not even contain tapes (Mr. Black comes to mind)... is that because s experienced annotators do not need to annotate the finer stuff because it has become second nature or is it because this (the charts in which the tapes are not annotated) represent a coarser level (=Forest) of trading?
People annotate in different ways based on how the initially learned to 'see' the market. When I first learned about the Price / Volume Relationship, I did so within the context of having all tool sets (coarse, medium and fine) available and on my computer screens. As a result, my brain would often 'see' "what the YM was doing" prior to the close of an ES five minute bar. Even after removing all medium and fine tools (YM, STR-SQU, DOM, OTR Charts) from my screens, I could still 'see' the YM doing its thing.
This contruct didn't, in and of itself, provide an advantage. It simple allowed me to see the structure at various levels, and as such, did not require me to anotate a tape. After all, I could see when a specific tape ended. I didn't need lines to show me when the process had completed.
Later, when attempting to transfer the process of learning this stuff to others, I had to re-introduce all levels of annotation, so others might 'see' that which my brain learned in a different fashion.
So- it seems the proper way is doing this from the smallest fractal up?
I've found the best way for people to learn is to take a known entity and annotate from beginning to end. The lessons learned from doing so provides the contruct for all fractals moving forward.
By now, you should absolutely know the market ended the contruction of an up channel at 14:15 Eastern Time yesterday (10-13-2010, close of bar). Once you can know with 100% certainty that the down channel has completed, you can then go back, and create annotations which indicate same.
Then, you will have learned how to logically, correctly, and completely annotate a chart. Whether or not you realize that you've learned this skill is another matter entirely.
- Spydertrader
-
For those having difficulty understanding the information gucci has attempted to convey, might I suggest continuing the discussion from a slightly different orientation (in an effort to 'fast-forward' the application of said information onto 'present day'). Doing so, allows everyone to 'set aside' that which provides them difficulty - with the goal being to return to reading gucci's words after having the ability to understand 'part' of what gucci hopes to get you to see. Once one solves part of a problem, by definition, one then has a different problem before them.
The market begins a new cycle (for all fractals) at 14:15 (Eastern Time) yesterday (10-13-2010). Start the annotation process from that point in time.
HTH.
- Spydertrader
"There is only one problem in life: How do you go about the process of solving problems."
-
I get the feeling that I am still missing something?I encourage you to improve your annotation technique.
Note the differences between your annotations and mine (See Attached).
You cannot see that which the market provides if you create lazy annotations.
HTH.
- Spydertrader
-
so here I am, just trying to see.You might start by asking yourself why some of your Point Three's aren't connected to a Right Trend Line.
Don't Point Three's create the RTL by using Point One?
- Spydertrader
-
A period of doubt and confusion trying to decide if a new thing started or if the old thing is still going.Whether you experience doubt or confusion (or not) has no influence on what the market does after a Volatility Expansion.
Start by recognizing what one must do with the right trend line after a VE.
- Spydertrader
-
I have always assumed that the slower fractal x2x is drawn at the second gaussian trough (not necessarily the second volume trough) because the faster fractal must complete before you have an x2x on the slower.Is this the direction you were heading? Or is there a more precise explanation?
I want everyone to head in the direction where they do not have to assume. They simply, know.
The market has indicated the exact way to annotate, which also allows a trader to test whichever technique they choose against that which the market provides.
- Spydertrader
-
In all honesty I have yet to figure that out ( I presume by the question that there will be some form of continuation?)If one has set as a goal to locate an FTT (Failure to Traverse), how can the market fail to do that which it has already completed? Has not Price traversed its container by creating a VE?
- Spydertrader
-
I saw a very "clear" B2B yesterday afternoon and have been lost this morning as a result.Didn't you see a VE just prior to the area you referenced?
What must come next after the market creates a VE?
What did the market then provide?
- Spydertrader
-
Can you explain in what way you analyse price and volume?The market (any market) exists on a fractal basis. As a result, Volume must cycle through a specific Order of Events before Price ends its current trend. Otherwise, the current Price trend continues. Monitor Volume and by doing so, have the ability to know whether the market finds itself in continue (hold) or change (exit or reverse).
"The Price / Volume Relationship" Thread in the Technical Analysis Forum contains the specific details.
- Spydertrader
-
I trade futures using volume.Is there anybody here who trades futures by analyzing volume?
Price and Volume is all I use.
- Spydertrader
-
In this case, if I apply the same logic, I will put the trough on that BO bar.
Whatever conclusion you reach (based on a sufficient data set), make sure to test it against that which the market provides.
- Spydertrader
-
I can see that for a single fractal case, B2B's through is located at the right trendline of previous down container just before it broke out with increasing volume.
Such is the case for this specific example, but not necessarily all examples. One must strive to locate solutions which apply to all contexts, and not, apply solutions which work for a singular event.
So for any fractal, am I correct by saying that B2B's trough is located at the last volume trough within previous container?
Ever see Price shoot straight down (like a rocket) on super high increasing Volume directly after an FTT of an Up container? Does your solution work for such a scenario?
This could happen at the first volume trough or 2nd volume trough of lower fractal, as long as it is within the previous container.The market (for whatever reason) might not provide a trough until well after Price crossed my previous right trend line (RTL). Now what do I do?
HTH.
- Spydertrader
-
My understanding is that the nesting choice depends on the layout of RTLs.Remember the goal of this exercise: Accuracy and Precision. In other words, we want to annotate correctly and consistantly - all day - every day we look at a chart.
You've arrived at an answer based on a 'context oriented' solution. In order to know whether your rationale for this context applies to all other contexts, one must then locate a scenario where you feel a different solution applies and test accordingly.
Keep in mind the possibility your mind may have merged several concepts together (such as Point One's always overlap, Point Three's occassionally overlap, but Point Two's never overlap) in an effort to arrive at a solution to an old problem. I'm merely suggesting a better way to know whether (or not) a solution represents the solution.
One must always allow the market to provide the answers.
HTH.
- Spydertrader
The Price / Volume Relationship
in Technical Analysis
Posted
Bingo!!
Now certainly, we can know before this point in time, but only after developing the knowledge, skills and experience to do so.
Once the market indicates it has provided a trader with a known entity you can then, and only then, begin the learning process - step by step - without jumping ahead.
- Spydertrader