
Welcome to the new Traders Laboratory! Please bear with us as we finish the migration over the next few days. If you find any issues, want to leave feedback, get in touch with us, or offer suggestions please post to the Support forum here.

Spydertrader
-
Content Count
389 -
Joined
-
Last visited
Posts posted by Spydertrader
-
-
If your Gaussians show you R2R, where are you with respect to the order of events?
- You are at the top of an upchannel (or traverse). You have created a point 1 for a new downchannel, and that point one is the FTT of the old upchannel (or it bounced off the LTL of the old upchannel).
Incorrect. R2R places you squarely at a Point Two
If your Gaussians show you R2R 2B, where are you with respect to the order of events?
- You have now created a point 2
Incorrect. The market has moved from Point Two through a non-dominant retrace and to the Point Three.
If your Gaussians show you R2R 2B 2R, where are you with respect to the order of events (and what then do you want to see to tell you this order of events has ended)?
- you have now created a point 3... you now want to see increasing red volume for the next dominant traverse of the new down channel??
Incorrect. The market has moved from the Point Three and has headed back toward the Left Trend Line (LTL). The time has arrived for you to locate an FTT on your trading fractal.
HTH.
- Spydertrader
-
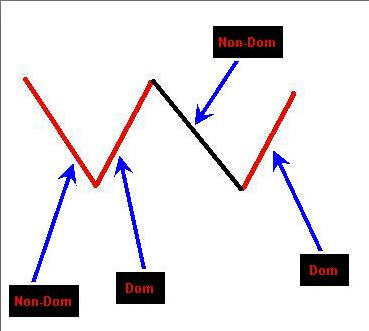
See Attached.
Note what decreasing black line stands for.
- Spydertrader
-
Like I said, probably my fault, perhaps there are some basics that I am missing.You guys seem to be quite ahead on the curve. I would have to ask some pretty basic questions, and thought I save everyone some time if a document exists that clears that up...Perhaps, you missed the following ...
http://www.traderslaboratory.com/forums/34/price-volume-relationship-6320-54.html#post104382
Do not think for one moment you are alone in this journey. No doubt, a number of newer folks (and even a number of folks who have studied this for quite some time) have the same problem you currently experience.
Anyone interested should feel welcome to contribute to this discussion.
-
For example, i am confused about some of the gaussian notation, but have not seen one clear exposition on how to annotate them..I'm not entirely clear on what you believe we've been discussing over the last 48 hours or so, but I apologize if you've failed to find the information helpful.
- Spydertrader
-
One other question I have is what happened to the indicators on the 5 min chart? In the building channels for building wealth document they are present on the 5 min es charts (macd, fast and slow stoch), and Jack refers to them... but now in this thread they are not? Is this a new development or are they still used for sweeping an a finer level later on?Indicators represent a relatively recent phenomenon when it comes to trading - growing exponentially with the advent of automated charting software. Prior to the invention of the personal computer, traders (who used charts) drew them by hand. These hand drawn charts contained two indicators - Price and Volume. Since markets have existed long before the invention of (squiggly line type) indicators, I see no reason to include that which plays no role in the Price / Volume Relationship.
However, plenty of information does exist with respect to the use of The MACD and The Stochastic Indicator for trading (my first Equities Journal used The MACD and The Stochastic Indicator). Feel free to use whatever information you feel best meets your needs.
- Spydertrader
-
I needto get this drawing correct. Here's another attempt.Each higher level container is built by 3 lower level containers.
Alright.
Now, we are getting somewhere. You've narrowed things down to a binary choice.
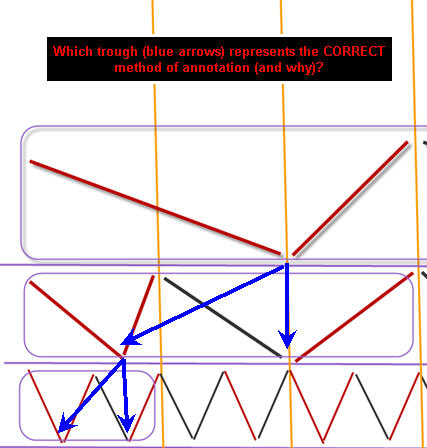
Which Trough best represents the market fractals in terms of 'nesting'?
You've drawn things one way (as did Nkhoi in an earlier post), but another possible way also exists.
See Attached.
You (and Nkhoi) show nesting of fractals at the second trough of the diagram. You could have chosen to nest within the first trough of the diagram.
What you must now do is determine logically which of these two techniques best describes the market (any market).
Look at the attached snippet of your drawing, and then look at an area of the market where you know how the market presented itself. Use the YM if you have to, but test both answers in an effort to arrive at the correct answer.
HTH.
- Spydertrader
-
Based on this drawing, my "Big Picture" just completed the first 3 segments and point 2 of the channel has not been arrived yet.Well, unfortunately, this is not what you have drawn in your attached.
Think on this for a moment.
Every container arrives at a Point Two in the exact same fashion. We differentiate the various fractals by Gaussian Line thickness, but each individual fractal container still travels through the Order of Events in the very same way as every other fractal.
To arrive at a Point Two of a container, a faster container is required.
Each container (for every fractal) must complete the Order of Events.
What container builds the channels?
What container builds that which builds the channels?
How do you annotate these three containers in your Volume Pane?
Now, given that you know all fractals must complete, and given that you know what the Order of Events is (for any fractal), draw how one arrives at a Point Two of a dominant channel.
Remember, we have not progressed passed the Point Two of the channel in this drill (yet).
- Spydertrader
-
Concerning my post with the questions. Would you please review it and either confirm or reject it for the sake of the people reading it.I cannot know what information might result in the AHA!! required for any specific individual. However, I can know that which helped one certainly has the possibility of helping another along the path.
However, having said that, I might suggest people follow along with the instructions posted here first, and if (after a while), they still do not see that which the market has provided, then that might be a good time to dig deeper into other areas.
Remember, how I annotated a chart (in the old threads) had primarily to do with my attempts to get across a certain concept (making things easier [well, somewhat easier] for people to 'see' what the hell I was talking about).
In this thread, I've focused on showing people how to teach themselves how to learn accuracy and precision.
A subtle difference, yes, but an important distinction none-the-less.
Feel free to continue to provide that which you feel others might find helpful.
- Spydertrader
-
I'm not sure whether the way I draw it is correct.O.K. look away from the charts again (for a moment).
Review this post.
See how the B2B forms on a single fractal. Note (by looking at the Volume Bars themselves) how a B2B forms the Point Two.
Since the market exists on a fractal basis, all fractals must contain the same attributes.
Whether B2B or R2R, the market creates the exact same picture in terms of how a given fractal arrives at a Point Two.
Make sure the faster fractals 'nest' correctly by ensuring each faster fractal shows the exact same attributes as the one above.
HTH.
- Spydertrader
-
So let me make sure my understanding of the nesting is correct by answering your questions without looking at any chart first.I'm not entirely certain you have the Order of Events correct once one sees R2R 2B or B2B 2R. Please review what you must see once the market has shown itself to have reached Point Three. Everything else looked fine. With respect to your 'Big Picture' gaussians, did you arrive at a Point Two in the big picture?
Remember, when a dominant channel begins at its Point One, a traverse and a tape also begin at their Point One.
- Spydertrader
-
Is it possible that 2R B2B gaussian happened within one bar? I don't see any other increasing black volume to annotate B2B gaussian for that green up traverse.The Bar to which you refer represents an Intra-Bar Gaussian Shift (I.B.G.S.) - where one Gaussian line ends and another begins. If you pull up a copy of the YM (for this specific area) you should be able to see a B2B form across several bars (instead of just one bar).
In other words, ask your question in a slightly different fashion, and you already know the answer. Asking the question as you did, implies something other than you intended.
Again, take a look at the YM for this specific area in an effort to 'see' that which the ES currently shows as obscured.
- Spydertrader
-
Within Point 3 movement of a Channel, I see 3 segments where all the lines point to the same direction. Marked in green circle in this chart.Great. Since you've completed the area from Point Three to the FTT (for a chanel), all you need to do now is create a very similar construct for Point One to Point Two of a channel.
- Spydertrader
-
Here's my redraw of the Thursday 10/7/2010 chart.
Let's stay focused on that down container (for the time being) in an effort to make absolutely certain we have the ability to accurately, and consistantly, annotate our Gaussians the exact same way on all fractals.
Look away from the charts (for a moment) and pull out some blank paper. Write down what you know with respect to the order of events.
If your Gaussians show you R2R, where are you with respect to the order of events?
If your Gaussians show you R2R 2B, where are you with respect to the order of events?
If your Gaussians show you R2R 2B 2R, where are you with respect to the order of events (and what then do you want to see to tell you this order of events has ended)?
Since we know all markets exist on a fractal basis, the same exact paradigm for where one sits currently (with respect to the right side of the market) and what must come next (with respect to the order of events) develops on each and every line thickness annotated on our chart. In other words, that which we do for 'tapes' we must also do for 'traverses' and 'channels.'
What else do we know? Our Order of Events marks the minimum requirement needed to complete a given fractal. While no maximum exists, each component of the order of events must develop in the exact same fashion as the minimum level required. In other words (using our example of the down container), a decelerating medium level (thickness) black Gaussian Line means something - and it always means the exact same thing - irrespective of the number of times it appears on a chart.
Now, look at you down container anotations ...
1. What does a decelerating medium level (thickness) black Gaussian Line mean in a Down Container?
2. Do your annotations reflect the meaning of a decelerating medium level (thickness) black Gaussian Line?
Since we know the market often provides more than the minimum required for a given level container, something must indicate to the trader that the market plans to go beyond the minimum.
1. What are these events?
2. What must come next when they develop?
Lastly, once we have the above all sorted out, we can then work to 'clean' up our nesting of the various fractals within each other. To do this, we need to completely understand where the various fractals come together, and where they split apart.
Begin with the slowest fractal (channel) and move faster.
Using Volume only for the following questions ....
1. How does one arrive at Point Two of a Channel?
2. How does one arrive at Point Two of a Traverse?
3. How does one arrive at Point Two of a Tape?
Moving between 'points' on a given fractal results from a completed Order of Events of a faster fractal. Therefore, each fractal nests within another. Take a moment and draw (on paper) a channel Point Two (again using Gaussians [Volume] only). Then annotate the faster fractal which must complete in order to arive at the channel Point Two. Do the same for the Traverse and Tape - without going beyond a Channel Point Two.
Note where all three fractals come together and where all three fractals diverge.
Do not move beyond annotating another chart until you can see hwere you placed errors within the down container currently under discussion.
Do not think for one moment you are alone in this journey. No doubt, a number of newer folks (and even a number of folks who have studied this for quite some time) have the same problem you currently experience.
Anyone interested should feel welcome to contribute to this discussion.
Again, the goal here is to develop both accuracy and precision with respect to annotations.
I hope you find the above information helpful.
- Spydertrader
-
Taking one step at the time and trying to draw Gaussians to match with trend lines for 10/8/2010.You might want to stay focused on yesterday's chart (first with the morning portion) before moving onto more complex examples.
Crawl. Walk. Run. Then, Fly.
- Spydertrader
-
Incorrect. see attachedSo far, so good. Now, you'll need to apply the concept of 'nesting' onto these Gaussians. Once you do so, you'll view a more 'clean' set of lines.
- Spydertrader
-
Please let me know if I am on the right track.
How do you get to 'Point Two' of something that moves down?
How did YOU arrive at point Two?
Do you feel this is correct?
Now. The 'Points' of one container find themselves created by some 'thing' formed by a faster level container.
What is that thing?
Forget the chart for a moment.
Start at the 'fine' level.
Pull out some blank sheets of paper, and focus on drawing volume gaussians - without any charts around. Move from Point One to Point Two to Point Three and onto the completion of the order of events. Now, do the non-dominant container. Do the dominant container again.
What did you just build?
Three things built one larger thing.
Continue the process in a fractal fashion.
Go back to your charts and note where you need to polish.
HTH.
Spydertrader
-
My chart for 10/7/2010.Thanks for viewing my charts, pointing out mistakes and steering me to the right direction.
Look at your chart at the beginning of your annotations. In a previous post, you indicated how to arrive at Point Two. Do your annotations reflect this same assertion? Review your Point Three Annotations. Do your Gaussians show how you answered my previous post?
Now go to the thin lines.
What 'thing' forms the various 'points' on the medium lines? How does one arrive at this 'thing' through Volume? Do your lines reflect this?
Sloppy annotation (irrespective of intent) serves no purpose in an environment of purposeful learning.
- Spydertrader
-
Spydertrader, do you have any advice for my current annotation?

Your Medium level gaussians (I assume their are medium as I see no 'thick' level) do not accurately represent the market condition (from around 1:15 [on your chart] forward)
I'm currently annotating at end of day, bar by bar. TIA.
Absolutely nothing wrong with this path. However, every once in a while, the equal weight trend (gaussian level) continues across to the next day. Be sure to note how (and why) such an event might develop.
HTH.
- Spydertrader
-
My biggest question is do you drawn the Gaussians base on volume bars to match the price bars in the channel above or do you randomly draw them in the volume plain to match above?Volume leads Price.
- Spydertrader
-
Any feed back would be appreciated.Your Gaussian construction does not match your trend line construction.
If the market shows you B2B 2R, where are you?
If the market shows you R2R, where are you?
The order of events works on every fractal.
HTH.
- Spydertrader
-
Please tell me if I am on the right track and where I can look at improving. TIA.http://www.traderslaboratory.com/forums/34/price-volume-relationship-6320-52.html#post103884
Yes. You are on the right track. Now spend some time learning to correctly nest your fractals (using Gaussians as your guide).
- Spydertrader
-
It is unfortunate that no clear explanation regarding how to identify fractal levels consistently has ever been given in this or the IT thread, despite numerous requests from the many individuals that have devoted many 1000's of hours to this methodology.The market provides the answers you seek, and it does so each and every day.
- Spydertrader
-
Do these four fractals have the same weight?No.
- Spydertrader
-
Spyder - a question about your personal trading style...If I am not mistaken you only monitor and annotate the 5 minute ES - is that correct?
For the vast majority of trading days, yes.
What other charts/time frames do you look at (if any)?For the vast majority of trading days, none. While I have the ability to use a 'medium' or 'fine' toolset, I simply don't feel like working that hard. As such, I put away the YM (one less chart to annotate[less work]), I no longer need The STR-SQU (I'd much rather chat on the phone than trade within laterals and Outside Bars), and I have put away the OTR charts (I don't feel like trading within internal formations - again, too much work).
I do have the DOM up, but for Order Entry purposes only. If i get board, I'll monitor the DOM Walls for a spell - watching them move back and forth while big money plays its games - but again, I'm only watching because I am board and I need something to keep me busy.
Roughly how many trades per day do you make (on a day when you trade through a whole day)?The number of trades varies depending on the type of market. For example, an 'M' or 'W' day provides far more opportunity (more trades) than a trending day. I've entered the market long at the Open of Bar One and held until 4:00 PM Eastern time quite frequently, but on other days, I've reversed direction every 30 minutes to an hour. As such, my 'range' of trades falls between 1 and 12 on any day with a mode of 5 -6.
Do you employ an SCT style where you always have a position open?If I trade on any given day (and plan to trade the entire day), I have a position on for the entire day. I enter at the open of Bar One and I am always flat at 4:00 PM eastern time (close of bar).
I may exit the market early on any given day if the market signals it has reached a Point Two within 20 minutes of 4:00 PM.
I also rarely trade the entire day in the summertime. I'd rather be fishing.

HTH.
- Spydertrader
The Price / Volume Relationship
in Technical Analysis
Posted
You've equated decreasing Volume with non-dominant movement.
- Spydertrader