
Welcome to the new Traders Laboratory! Please bear with us as we finish the migration over the next few days. If you find any issues, want to leave feedback, get in touch with us, or offer suggestions please post to the Support forum here.


tradingwizzard
-
Content Count
951 -
Joined
-
Last visited
Posts posted by tradingwizzard
-
-
I know how to take money from the market. I am not a great trader and wasn't trying to be smug.I have no idea how to determine what you might have missed, because I have no idea how you arrived at your conclusion. In my mind we were looking at the same market, so we must have been looking at the same things. You might need someone like Rande Howe to help you arrive at different conclusions and not someone like me.
the idea was about correlations between NFP and Dow....your answer was about dogs and Sun if I remember correctly....I may not remember correctly though, because I read it and find it so lame I moved on to something else
regards,
TW
-
Correlations work perfectly. Unfortunately, the things you want to be correlated didn't turn out to be correlated. Sort of like concluding that your neighbor walking the dog in the morning has some causal effect on the sun rising, because they do tend to occur at the same time.excellent response
 ...instead of explaining something that I miss, you just blah blah some stuff.....you must be a great trader sharing your knowledge like that
TW
-
like mentioned at the start of the thread, no one really know what data means anymore...good data is bad data, bad data is good data, who the heck knows...
so NFP missed and sent Dow +165 points higher...excellent

correlations suck

TW
-
EURUSD---->1.3563 is the new daily pivot, it will get tested before NFP report.I don't see any moves outside of the range between daily PP and 1.3620 until the release
already crossed
TW
-
I think the market read is that the FED is committed to the taper. If it were a huge miss... say like December... that may drive that kind of speculation (who knows). As usual, the market would have to bring on some more misery to get the point across. Any miss on the number (seems to me) would weigh in for the sell side.well, only one day to go and we shall see...
TW
-
The goal was to share long term trading ideas in the forum and make a good result in the portfolio. I think that the goal has been reached. This result was mostly achieved by the analysis of S&P 500 made in January 2013.I hope that the result in next portfolio will go the same away.
looking forward to see it....will you make a new thread or continue here?
regards,
TW
-
hi Richard,
I always loved your articles....the thing I find annoying with fractals is that this is an indicator that is repainting....so it is not actually picking tops/bottoms with it.....but agree it is math and chaos theory
TW
-
Yes. correlations and reactions are coming back more to how they were say 5 years ago.actually I'm not sure about that anymore...if anything I would say correlations do not exist anymore....or, to put it more frankly, they exist or are valid until they don't....and at that moment stop losses are triggered
TW
-
A favorable NFP will pop the s&p back over 1800.even though I am bullish equities, I don't think it is that easy to travel.....then again, it depends of the number of course :Q)
TW
-
Technically, the market is due an oversold bounce. A beat on the NFP would certainly fuel that. If one trusts the ADP numbers, there may be some question if a beat on the NFP is likely. If market expectations are correct and the number comes in at 175 - 180K that is still just a bandaid for the horrid number in December, but it would still allow the FED to continue the reduction in QE.I don't think that NFP or QE is what is driving this correction. I would also think that a rally on an NFP beat will get sold in the following week. I love trading to the downside, it may just be that's my bias raising it's ugly head (Ha!). We shall see.
As always, my plan is to play it as it comes... 5 minutes at a time.
nice answer, gave it a like .....
I just want to add that if the NFP is missing, won't markets jump on the long side saying Fed must do something?
TW
-
it seems that nobody knows how to interpret data anymore....
let's see TL members on NFP and Dow Jones this Friday
will Dow close Friday positive if NFP beats estimates or not?
I would say yes....
TW
-
so they moved on with another 10 bln and now we're having 65 injected on a monthly basis...the fact that this 2 small reduction in the QE to be the cause for the stocks meltdown?....don't think so
what would be the reaction if the NFP goes bad?....actually I am starting a poll about that
TW
-
Exited all short positions.. It doesn't look it's going down atm..let's see Draghi today....it is hard not to recognize a bit the improvements in Eurozone lately, but depends very much on the tone he will have on the press conference..these guys can push price in any direction with the way they are answering questions
TW
-
You do not have to get angry , good traders can control emotions like anger.Your response is more out of anger than any logical rational reason.:rofl:don't get too excited...it was all about the language you used....
TW
-
iS THIS ON DHEMO?:rofl:check the time when the post was made public...
PS I edited your previous thread/post and you know why....I warned you many times, so might take action this time
behave please
TW
-
well, I do like eurusd and cable to the upside going into the NFP, as for aussie....I would say it's a tricky one still
TW
-
Yes, the Seeker is a very close cousin--much of the same logic with a few enhancements. The 9-13-9 pattern doesn't come along all that often so I wanted to share it with traders tracking the Dow. The same pattern is also present in the NASDAQ and SPX.understood, thank you.....I tend to look only at one indices, the Dow, as the other ones most likely are making the same pattern more or less
TW
-
The Dow has completed an important pattern to the upside and is now feeling the ramifications. The pattern began in October 2013 with a momentum move that lasted the minimum 9 consecutive days. It then went into the trending phase (1-13 red numbers) and after a small downside reflex proceeded into another momentum move (1-9 green numbers above the candles) that lasted into to the end of the calendar year. At this point, following the 9-13-9 move the Dow should be exhausted and need to correct the advance.It has just completed what would need to be the minimum correction to the downside as of 2/3/14 by posting 9 consecutive down bars (down bars are determined by closing below the close 4 days ago NOT the previous day). At this point the initial downside momentum should level off as buyers begin to nibble.
The low at point A on the chart will be very important and if the move proceeds into a full downside trending phase 1-13 red candles then the lower channel boundary at point B will come into play.
There will be upside resistance 15745 from the upper channel boundary and more resistance at the high of the right most shaded box on the chart at 16455.
does this have anything to do with DeMark sequential indicator?
thanks
TW
-
Hi Fellow traders, I am about to buy the Better momentum indicator from. barry But before I do I would like to see it in action via share screeen. does anyone have it, and willing to show it to me in action.? and Is it compatible with a six tick reversal chart on Ninja? skype me at ser.goed. I am willing to give you a cinema ticket for the effort.you made me laugh as your "cinema ticket" expression was the reason I allowed this post....
TW
-
any bull left?
TW
-
On January 27, I said it was not yet time to sell stocks, but the technical situation has deteriorated quite rapidly since then.Yesterday (an FOMC day), stocks saw heavy volume selling action that produced another “distribution day” (a decline on increasing volume) in both the S&P 500 and NASDAQ Composite.
In a healthy market, a few days of institutional selling over a 3 to 4-week period is normal and can typically be absorbed by demand.
However, when the running count of distribution days reaches five or more, it nearly always signals a substantial correction is just around the corner.
The 3-Part Test
There are three main components that determine the mode of my broad market timing model, which determines whether I focus on the long or short side of the market, and how aggressively to do so. Right now, only one of those three tests is (barely) holding up.
1.) Volume Pattern Of Broad Market
In the NASDAQ, yesterday was the seventh day of higher volume selling in recent weeks. As such, the volume pattern portion of my broad market timing model is now flashing a clear “sell” signal.
2.) Broad Market Trend
In my January 27 blog post, I also mentioned one positive element of current market conditions was that both the NASDAQ and small-cap Russell 2000 were still holding above key support of their 50-day moving averages. But that is no longer the case.
With all broad-based indexes now below their respective 50-day moving averages, the trend component of the timing model has shifted to a “sell” signal as well (though I would like to give it to the end of the week to see if the NASDAQ can bounce back).
3.) Performance Of Leadership Stocks
The third and final component of our timing model, the performance of leadership stocks, is the only part of the model that is preventing the current “neutral” mode from officially shifting to “sell” mode. Still, even this portion is barely holding on.
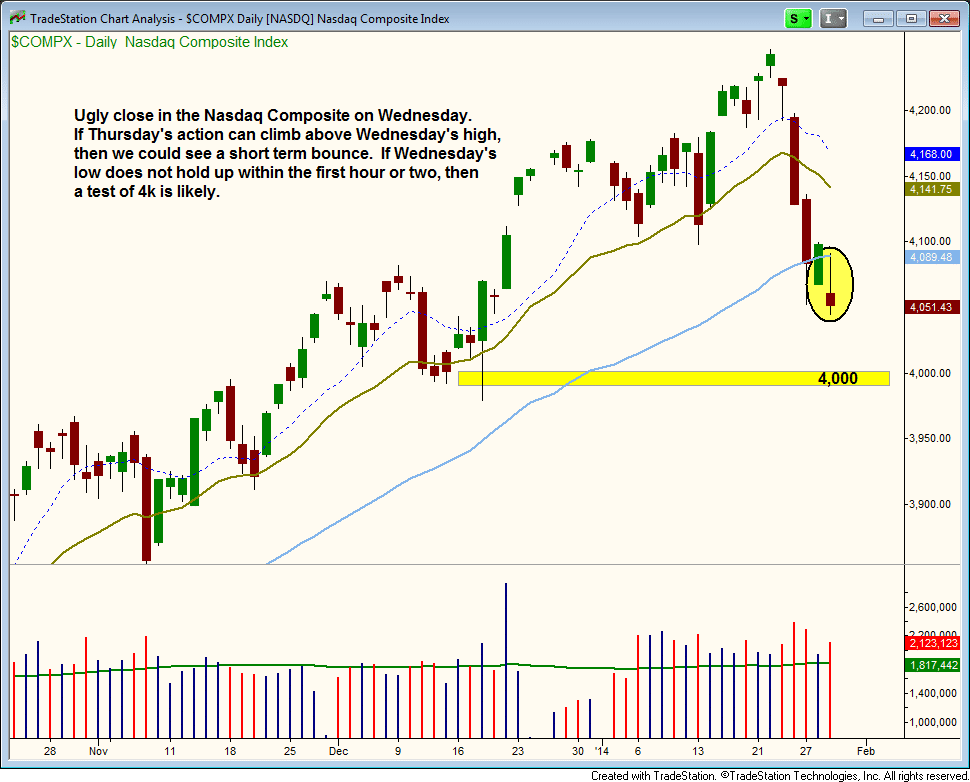
NASDAQ 4000 – Coming Soon?
Taking an updated look at the daily chart of the NASDAQ (below), notice the tech-heavy index reversed lower after running into new resistance of its 50-day moving average yesterday (January 29). The index also closed near its intraday low, near the intraday low of January 27 (near-term support).
If the price action follows through to the downside today (January 30), then bearish short-term momentum will likely take the index down to the 4,000 area (support of the December 2013 lows). However, a false move lower in the first hour of trading that subsequently reverses above the previous day’s high could lead to a short-term bounce:
Although my newsletter is not yet in full “sell” mode, I have been laying low (in “neutral” mode) this week. But as a bonus, a positive earnings report from Facebook ($FB) has currently launched our existing long position to an unrealized gain of approximately 27% since our December 2 buy entry.
The long side of the stock market is all about low volatility and steady/reliable price action. However, current conditions are quite volatile.
Therefore, even if I spot new bullish setups on the long side of the market (such as $AMBA or $AL), the stock market is simply too unstable right now to add new exposure with confidence.
Trade What You See, Not What You Think!
Obviously, there are quite a few scenarios that could play out from here, and that is why we always shy away from predicting market action and worrying about where the major averages will go.
Consistently profitable trading is all about reacting to price action, not predicting it. I can discuss different possibilities and have a plan in place, but I still have no clue what will happen tomorrow.
If my timing model shifts into full “sell” signal, I will then start focusing on short selling stocks and ETFs with the most relative weakness.
Nevertheless, with the market already down sharply in such a short period of time, there are simply no low-risk short entries at the moment.
Chasing on the short side can be just as bad or worse than chasing longs. If you have ever been caught in a short squeeze, you know that the price action can explode higher for several days before taking a break.
With the very real possibility of a significant correction just around the corner, this is a great time to review my preferred strategy for entering new trades on the short side. Upon doing so, you will surely see the importance of maintaining discipline and patience right now.
I am buying every dip of it
FYI
TW
-
Hey guys,I'm completely new here, it's only been half a week of lurking that I have done on this site.
I am a current business student in university, and I currently have some money saved up from years of working since high school and what not. I have around 5k of investing room, I'm willing to take about moderate to high risk (well considering it's only 5k....it's not a lot of money)
But what are some suggestions I should keep in mind for a beginner, and what stocks are hot atm I should look out for?
I am actually currently using the Scotiabank 50 commission free ETF's, to jump start or learn about trading, If anyone has experience with these 50 free etf's or currently trading them let me know!
hi there,
welcome....I am sure one of the guys here will have some advice for you. I trade only currencies so not really qualified for answering your question.
good luck though
TW
-
Ahh let the wiz have his fun.Seems to think trading is about "knowing".
I guess we're about to find out pretty soon
TW
-
1.399 / 1.41 is a place you should look at for building a small long term short position ... between 1.35/1.37 is just not worth it! You will get a minimum 300 pips and if you are really lucky maybe 650 P.I'm still bullish but the ball now is in Fed's hands
TW
Live Trading the Currency Markets
in Market News & Analysis
Posted
not quite sky rocketing but it does have a bullish tone....I like cable more now to the 1.6650 area
TW