
Welcome to the new Traders Laboratory! Please bear with us as we finish the migration over the next few days. If you find any issues, want to leave feedback, get in touch with us, or offer suggestions please post to the Support forum here.


tradingwizzard
-
Content Count
951 -
Joined
-
Last visited
Posts posted by tradingwizzard
-
-
the logic behind this trade is that we're still probably in an irregular flat, and now looking for price to move below the 1.3900 level where the a wave red ended.....check the previous analyisis posted on the pair
-
Trade nr. 10 SHORT EURAUD HERE IN 1.4273 FOR 1.3900 TP SL 1.4500
-
I have found a chart here where i was testing the moon and other esoteric ideas intended for the pseudoscience thread and it appears to back up Bob's statement that full moons usually are near lows/new moons near highs.There is a full moon tonight so i guess you're looking for a possible inversion here Bob? since the market is at an all time high.
quick questions Mits on the chart:
1. why vibration 55
2. why cycle 52
-
Very interesting Bob/wiz.Any chance you could post a chart showing several moons?I'm not sure why you think i'm better at this than you Bob,this is really not my thing at all.
But I will admit,that you often get turns near full/new moons.
That could be a problem since there could be a big change in price allowing for some leeway which you inevitably must do.For example if the moon should fall on a weekend.
In my pseudoscience thread I was looking at the New York barometer readings hoping it would give trading signals to make a point that strange theories can work.Thing is it looked quite convincing to a certain extent
.A lot of things I've posted over the years seem to be mis-perceived (?) as things that I actually use to trade which is not the case at all.Though I do admit I have been down some very strange rabbit holes in my journey.However it all lead somewhere in the end so I guess it wasn't a waste of time.
So with that history in mind I would not say to anyone that what they personally use is crazy or won't work.Just for me I settled on wave counts,maths and horizontal lines.Those 3 elements pretty much describe the market structure/cycles for me.
As for Gann I never really understood the material,but his ideas did lead me to find something for myself,for he said price and time is the same thing.
Perception
"Price and time is the same thing".
This is my conclusion after a lot of study and ah ha moments...
What are waves?
Cycles and...Price
What is at the bottom of a wave?..price
Top of a wave?... price
What happens when a wave ends?...a new wave in the opposite direction begins.
So if waves are price,when a top is in place (a wave ends) "a change must happen"
In short a wave ending= TIME ("time is up and a change must happen")
A wave ends at a PRICE
Therefore PRICE and TIME are the same thing when a WAVE ends.
Gann has you attempting to predict the exact price and time at which a market must turn.
And you must use the Gann wheel or other tool to do this.
I have not found that.
What I find is the market is waves/maths/horizontal lines
It is possible to identify future prices with maths and horizontal lines and quantify wave counts (personally I don't use EW) These can coincide to produce predictable possible tops and bottoms (waves). After a very long period of research I have an alternative theory to Gann.
And I believe the alternative is not PRICE=TIME = 1 unit.
I haven't found that you can convert a price into a predictable future time of a turn.
Nor have I found the opposite ie to convert a time into a future price.
But Gann did start me thinking along those lines so my own theory owes something to his ideas.
As I often say..."Beyond"

thanks for your point of view......yes, PRICE and TIME..........I personally did not understand how to use the "wheel of fortune" as sometimes the Gann wheel is called......I mean I understand the concept, not the utility, so obviously I am missing something there.......the only way I can connect time with price is in specific situations using Elliott Waves analysis (for example in the case of wedges, ending diagonals, where you have the 1-3 trendline that usually needs to be pierced but the length of the fifth wave should be smaller than the third one......and there you go, you have a maximum value for PRICE and a maximum value for TIME as usually fifth wave is shorter in time than the third one as well........so measure the third, both in price and time, and apply the outcome to the fifth)....however, as with many things related to Elliott, words like usually, most likely, etc, are all over the place and this is a drawdown from my point of view
Gann is different........what I do found interesting to use in the day to day trading, was the 1x1 concept he refers to all the time......that being the way a certain security/financial product, etc is moving........according to Gann, there is an angle that a financial product (let's say the eurusd pair) keeps all the time when it is rising (so in a bull trend) and a totally different one when it is falling (in a bear market).........and this angle holds true all the time, being steeper in falling markets (because of the panic effect that comes along) and not that aggresive in bullish market (complacency being the reason)
-
Hi Tradingwizzard,You have posted an interesting topic......Lunar Trading.
You wont get many replies because Astro is a swear word , but I'd like to comment.
Firstly Lunar Trading is based on the gravitational effects of the Moon + the SUN
The fact that you cant see the Moon ,doesnt mean there is no effect. Its still there.
But when the Moon and the Sun are on the same side of the Earth, New Moon, there is obviously more "pull", than when the Moon and the Sun are on opposite sides of the earth, Full Moon. (Likewise, if you have the Sun, Moon, Mars, Jupiter, and Venus, all on the same side, conjunction, you will get pulled off your feet.)
So the more "pull" the stronger the market.The market will rise into the New Moon and fall into the Full Moon.
I wont discuss all the problems with this method, but of prime importance is that it works better with BIG markets.... the indexes..I dont get much success trading individual stocks.
Now you have probably noticed from my comments,your analysis is the opposite of the above.
You suggest the Euro will fall at full moon.Thats easy to explain.You are trading a pair and the $ is the bigger market. Its the one that falls at New Moon and rises at Full Moon, and your Euro is the other side of the trade.So you analysis is still correct.Just upside down.
But you also have some TURNS at the wrong Moon phase.
Thats called inversion. The market does the opposite of the theory, and it happens about three times a year.I can live with that. Right 9 times out of 12 is a winning system.
Now having been rather pedantic because I dont want new traders to get the wrong idea,I think your GANN Theory is great.And your prediction of the value of the Euro make sense.
The $/euro should be at PAR , and with all the problems in Europe that are not resolved (now Portugal), its going to happen.
I would welcome mitsubishis views on GANN.He says hes not an expert but hes 10 times better than me.
kind regards
bobc
the whole idea to begin with was related to the fact that human behaviour is affected by the moon phase.....well, if markets are a sum of human behaviours, why not trying to find some sort of a connection between the twol......as it turned out, I am not the only one looking at this field as doing my research I found this to be an area of interest since long time ago.......and that lead me to Gann, whose works are as good as they are controversial
-
Totally agree with you that, as a Master, Mits could have been a bit more welcoming to you but who knows, everybody have their ways of saying welcome. Nonetheless I agree with him: which argument are you bringing to the discussion at hand? Any trading strategy you think of can be deemed worthless by anybody who doesn't master it. Mr Google can testify that there are lots of successful gap traders and teachers.
Attached is a chart of the Bund with 8 recent gaps. They didn't all fill, but that should be okay for the probability player, as the overwhelming majority (5/8) got filled with awesome profits. And there are some lessons to be learned from those not filled as well, if you scrutinize them closely.
well, the reason I said what I said it's about the simple fact that gaps are a controversy for the whole trading world as a matter of fact
western world consider them mandatory to close, while Japanese consider them continuation patterns (rising and falling windows).....so where's the catch? where's the trick?....oh wait.......the ones that do not close under the Western world approach, should be considered continuation patterns.....and the ones that do close should be considered regular gaps...like in London's subway.."mind the gap"....so in the end, it's about how you perceive them and how are you trading them.....same examples of successful traders looking for gaps to be closed exists of traders treating them as continuation patterns
I trade mainly currencies...this being a fact, I find sometimes that regardless of what stock are you in, because of fundamentals (daily ones), the indices are going down and your stock as well, so gaps are mostly common on equities...that's why, not relevant.....in conclusion, if you want to trade/study/interpret gaps, look at currency markets.......
hey, Mits, is this answer good enough for you? even if not, as Bobcollet puts it, you are 10 times better at Gann's approach...so no hard feelings taking, I would really appreciate your point of view on the Knowledge is of more value as gold thread......or email me if you don't want to post there, whatever....thanks and excuse my French....
-
try to switch from the equity markets to currencies.....they work best for the intraday price action
for example, and just as an example, almost 3 out of 4 Mondays, eurusd, on the London session, goes for Asian highs/lows, then reverses and takes the highs/lows, only for price to settle for the middle of the range at the end of the day
-
You hate them? Well,we've all got our pet hates on here haven't we?You dug this old thread out just to tell us this.Still,lets run with it.So tell us how you arrived at this controversial and thought provoking announcement wiz.
How extensive and thorough was the research?.... i'm taking a wild guess partly based on your choice of words..such as "seems",but I could be very wrong.Btw,your post count is coming along nicely.When are planning to start marketing?
As you have an opinion on just about anything- I got a neighbour (farmer) who's doing a bit of a diy fix on one of his tractors which is running lean..He thinks it may be the velociraptor valve playing up,whereas I think it's the multi pin on the stegosaurus tail injector....any suggestions?
first of all, I didn't dig the thread, and even if I did, I don't see what the problem is...
second, I find your tone being unpolite, not to say more
and third, it s probable the velociraptor valve
-
what is wrong with you? ....you have a profitable system and you need a coach to help you do what?....can't you deal with yourself?
-
I really hate gaps, and especially on the equity markets......any strategy based on them seems to be randomness at its best.........IMHO
-
I use a combo between rsi and williams percentage range to make a difference between a bull and a bear market.........the interpretation I must say it is contrarian in terms of how people usually looks at these indicators
-
I am actually going down this route , as there are many reasonably competent technical analysts (for entry signals) and data entry assistants (to manage trades) and some are willing to work a free week , to see their skills.This is better than hiring a pro , who can away anytime to go on his own.you mean trading can be tought? ....aren't you supposed to have the necessary skills?
-
sounds reasonable..now, how will you know when price says otherwise?....when SL is hit.....if there is any, as it seems to be fashinable not to have one :helloooo: -
booked the euraud short for a nice profit......now rest of the opening trades are in red, but stop losses are not touched yet, and that means invalidation levels still hold
-
Hi TWYou asked some interesting questions, so I thought I better go and reread the manual.
And of course I am doing nothing like the manual says.
Mainly because , like all GANN Theory, its badly written.
I will get back to you
regards
bobc
looking forward to ....
-
70's are considered by that broker too, so not missing anything on that part......well, in trading never say never.....still one year to go......
-
closing trade nr. 8 the short on euraud here in 1.4227 for a nice 81 pips profit
-
Trade nr. 9 Going SHORT AUDUSD AT MARKET HERE IN 0.9177 SL 0.9320 TP 0.8920
-
KNOWLEDGE IS OF MORE VALUE THAN GOLD
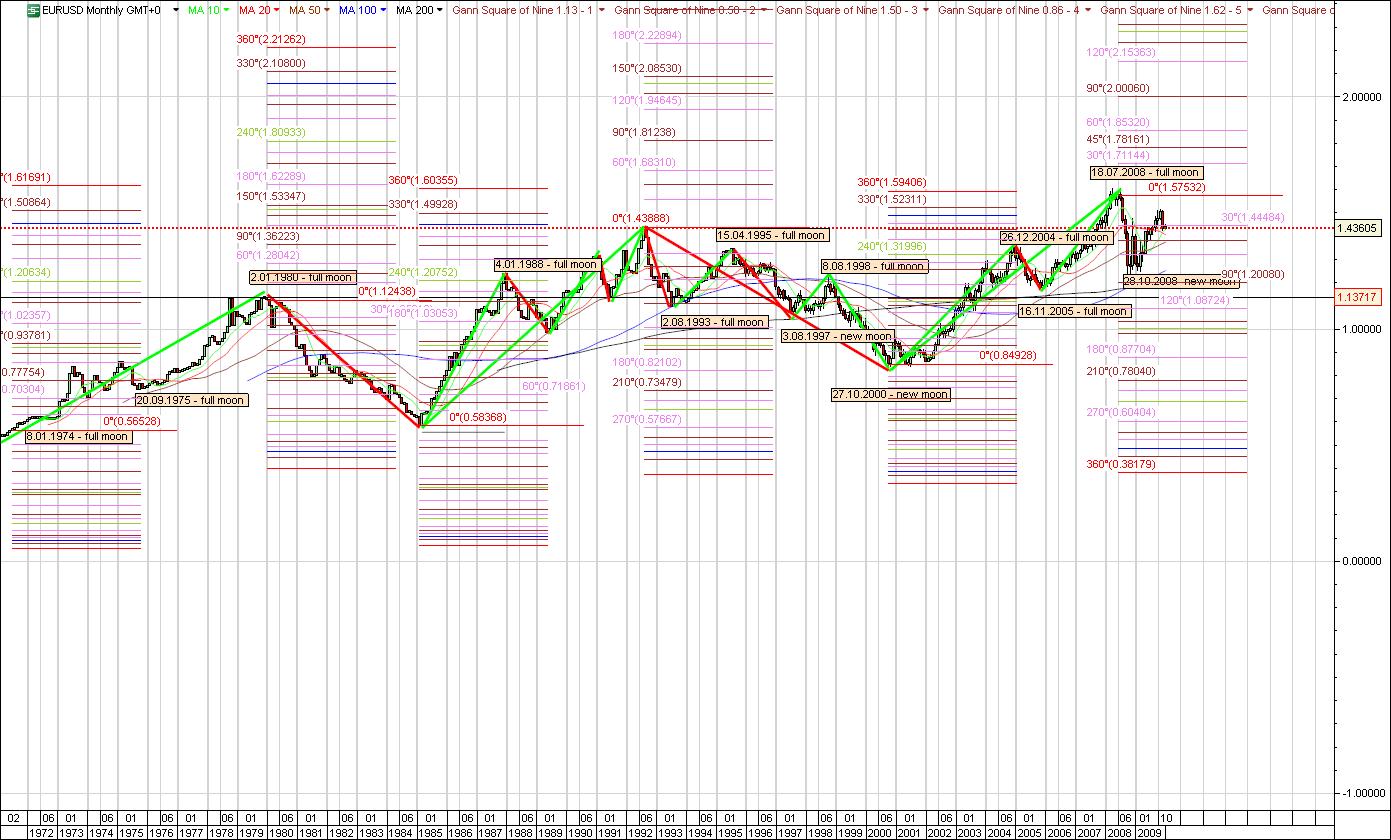
I'm sure many of you are familiar with the works of H.D. Gann. Personally I am a true admirer of both his work and legacy. No other trading style and/or forecasting method knows so much attention and secrecy as that of Gann. His true legacy is, in my opinion, the knowledge that, one way or the other, he managed to pass for the next generations to build on his works. He himself has reiterated the famous King's Solomon words “Knowledge is of more value than gold”.
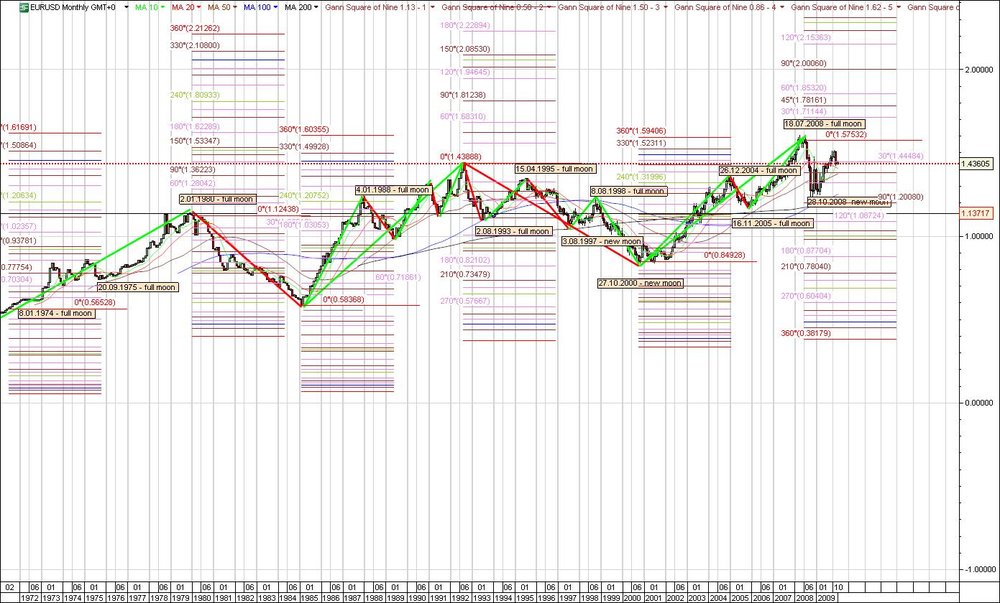
For Gann, everything was a number. He was a master of cycle analysis. So here's what I did: I took EUR/USD since the beginning (1971) and looked for a broker that offer that kind of historical information. Than I studied each cycle in terms of length and, attention, astrology (yes, I know, it sounds a little bit mystic but believe me it's not). From an astrology point of view I just wanted to see if the exact day the eur/usd turned has any meaning regarding full moon/new moon correlation. Surprisingly, it does. (see the first attachement for the chart)
Next, I used Gann Square of Nine for dividing each cycle and to see what degree goes with each cycle. Extrapolating the results into the future, I came to a conclusion that you'll see by reading this article.
Here's what I found:
- almost all of the trend changes happened exactly (or almost exactly) during a full moon/new moon;
- each period contains an odd number of “mini” periods (7, 1, 5, 5, 3);
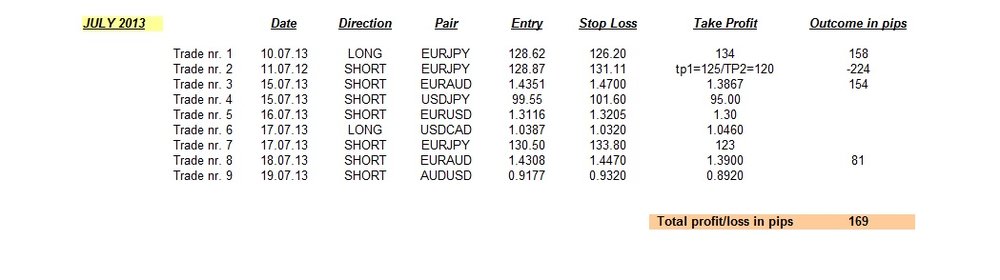
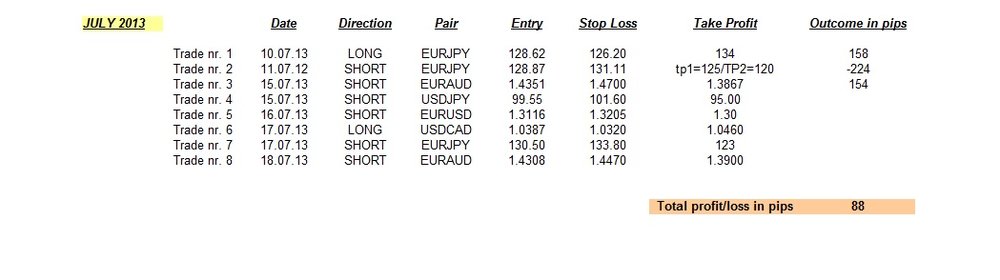
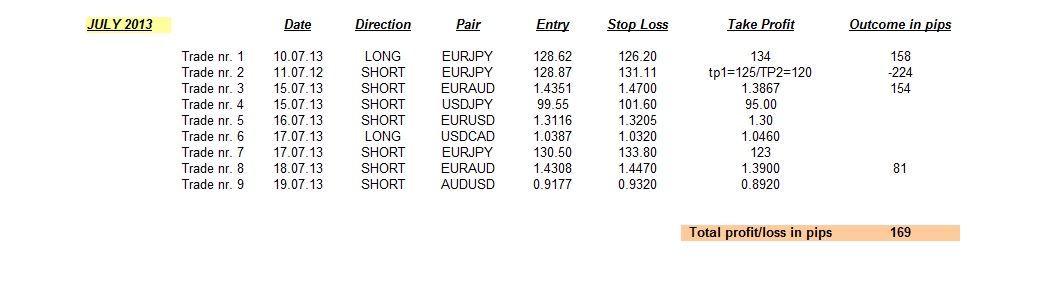
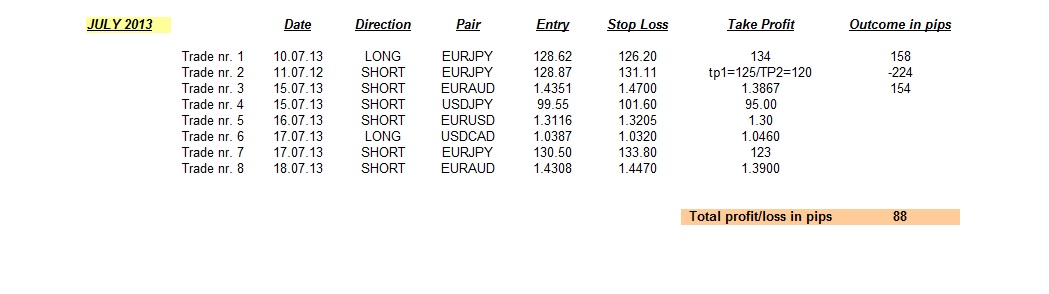
Now, based on the table below (see the Excel table attached), and also based on Gann's believe that history repeats itself, I invite you to use your imagination and complete the Excel table with your own opinion.
For encouraging, here's my opinion:
- taking into consideration there up until this last cycle there where 5 cycles (up, down, up, down, up), it is naturally to believe the next one will be down, and started with the maximum quotation in 2008;
- the smallest cycle down was 1854 days – so we can take an educated guess and assume that this down cycle will go for at least 1854 days;
- if we take a look at the Square of Nine, there is a particular thing that happened: the 1st trend down closed around 250-270 degrees, and the 2nd down trend closed around 180-210 degrees – now, keeping the proportions, it is only fair to assume that this down cycle we are currently in could have and end around 110-150 degrees (this corresponding in value for the Eur/Usd pair with 1.08-1.09);
- moreover, keeping the same assumptions, we can assume it will end with an inverted head and shoulders;
- it will definitely be around a full moon;
- it will be formed by an odd number of “mini-cycles”.
In conclusion, my call will be 1.08-1.09 for Eur/Usd, almost 1 year from now (2014), a trend that ends around a full moon, after an odd number of mini-cycles, and with an inverted head and shoulders.
What's yours?
-
Hi twThe resistance arcs are based on Fibs
The box is drawn to the size of the initial upthrust. If there are 11 up candles, then thats where you draw the box
Start at any pivot low. In this case it goes up 3 candles
I see I have not drawn it correctly. I have left out the tail of the third candle, but there is still a braekout of the green arc.The fourth arc (red) acts like a magnet.But it could reach this arc sideways.Can you see that?
The upthrust must be a fib number.If you get say 6 candles ,then you are wrong
I am very interested in what Friday brings.I could still get stopped out. But I feel confident I am going to make some cash.
regards
bobc
1. ok, they are Fibs, good to know......question: 31.8, 50, 61.8? and the last one? the big red one?
2. the 1x1 line is supposed to be the most important line in Gann's theory, as, depending on the time frame you are using it, it means that the rising angle (on any move to the upside on that time frame) should be the same......question: how long/far away in time the boxes stay, and what would be the invalidation area? ....I see this is the daily chart
3. the fourth arc acts like a magnet......it is something like the median line in Pitchfork? why like a magnet? can you elaborate some more on this please?
thanks
-
rejected right were it was supposed to.......focus on the bull bear line (the brown one again)
-
the shape there in your last chart looks like a contracting triangle that acts as a reversal pattern and usually that means it is part of a complex correction and most of the times the previous highs in this case are going to be taken.......as it happened here quite nicely
-
here's the standing going into Friday's trading day.......all open positions are in the red.....crap
-
thing is with the last euraud short trade that the previous move to the upside that made that new high was channeling too well....so what I did I waited for a five waves swing to the downside, booked the profit on it, and then resold on the pullback.....quite classical, nothing fancy involved, it remains to be seen how effective it is
Markets and Manipulation
in General Trading
Posted
US equity markets IMO