
Welcome to the new Traders Laboratory! Please bear with us as we finish the migration over the next few days. If you find any issues, want to leave feedback, get in touch with us, or offer suggestions please post to the Support forum here.


bakrob99
-
Content Count
725 -
Joined
-
Last visited
-
Days Won
1
Posts posted by bakrob99
-
-
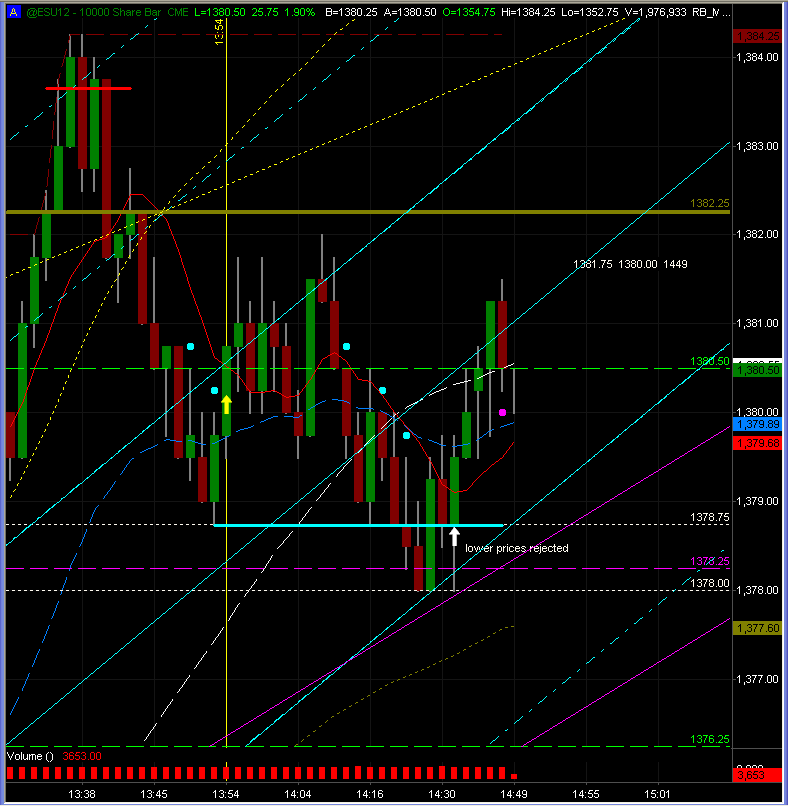
So, for this example entry would be at 1378.75 on the price rejection bar with a 4 tick stop loss?.Yes. But each of these plays out slightly different. But your looking for a test and a breakdown which fails to find any sellers and then an entry as its going back into the range. Stop is tight. Load the boat up. Get onboard.
-
Yes I do It was supplied by the school of hard knocks.
Here's the deal. Buy low Sell high
-
Ok, i understand fully what you mean. Identify the low of the pull back and then wait for a retest of that low, then take the risk with a tight stuff. good risk vs reward. Makes sense.Thank you
HERE'S A RECENT EXAMPLE
Buy it on the way back up.... after it doesn't take out the low and comes back thru using a buy stop entry. Exit at the top of the range ... or sell half and see if it breaks thru.
Don't try this without practicing it. The way to practice to get used to drawing horizontal lines on ranges as they unfold... and watch the price action.
You don't need no lousy stochastics... (said in a spittin sorta voice).
Stochastics are only good for divergences - not crossovers or oversold-bought zones.
And they ain't much good for that either. I'd rather use the $ticks.

-
Thank you kindly.Just to understand better, do you mean if price test an area of interest and then retest again? In your chart price is doing that well.
If you watch this type of chart you will see what I mean. When price goes sideways for a while it is the battlezone between buyers and sellers. I bet on the buyers in an uptrend - but I do sow at the low of the battlezone because my risk is small and my upside is the largest possible.
-
There are plenty of ways to get into the trend and keep getting into it. Don't ever think that "the market has gone too far, time for this or that" That type of thinking is completely counter to taking advantage of these trend days.
-
This recent push up brought to you by Mr Draghi. Thank you Mr. Draghi. Keep em coming!
-
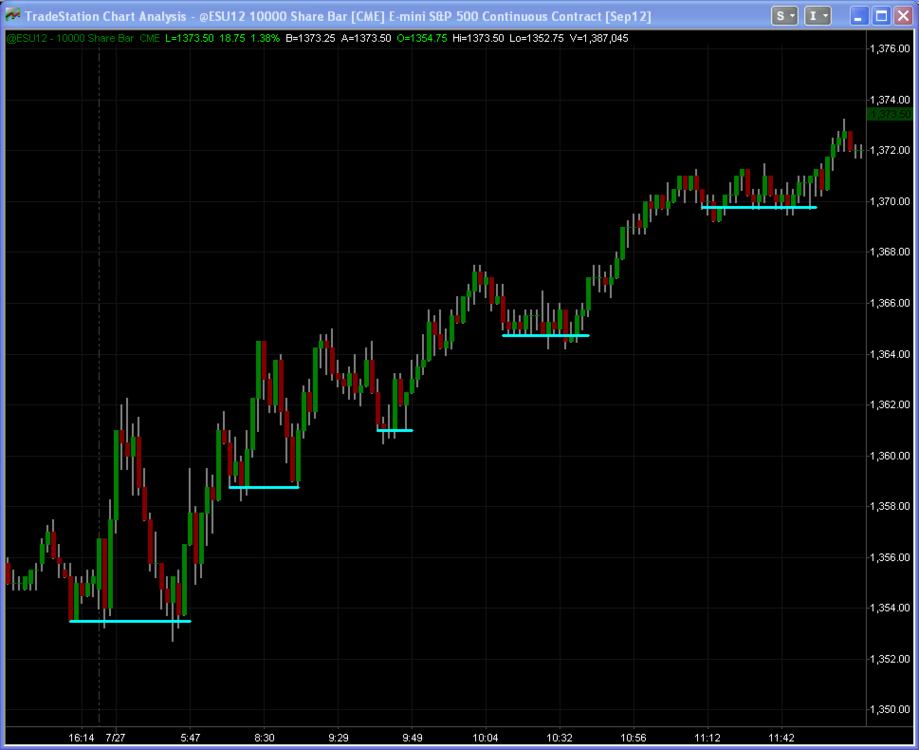
Yes, I look for candle stick patterns, still learning of course.You might notice that as price is trending it consolidates often at some key reference area ... then breaks out in the direction of the trend.
If you are trying to either get into the trend (re enter into the trend) as opposed getting in early and holding on ... or even if you are holding on and want to add to your position then I find it useful to look for these periods of consolidation and buy the low after a test - re test.
Imagine how tight a stop you can use at these cyan lines, say 1 tick in front on the pullback after first recognizing them (stop 4 ticks easily possible).
I call this my WALL setup. It works best on the ES. I use a 10K volume chart to see them but they are available on all timeframes.
I find candlestick signals too late for me.
-
Big impulsive move up off Draghi's comments points to 1375 today.I meant to say ... in the near future or this week. And it is unfolding as expected.
Thank you Mr Draghi.
-
Big impulsive move up off Draghi's comments points to 1375 today.
-
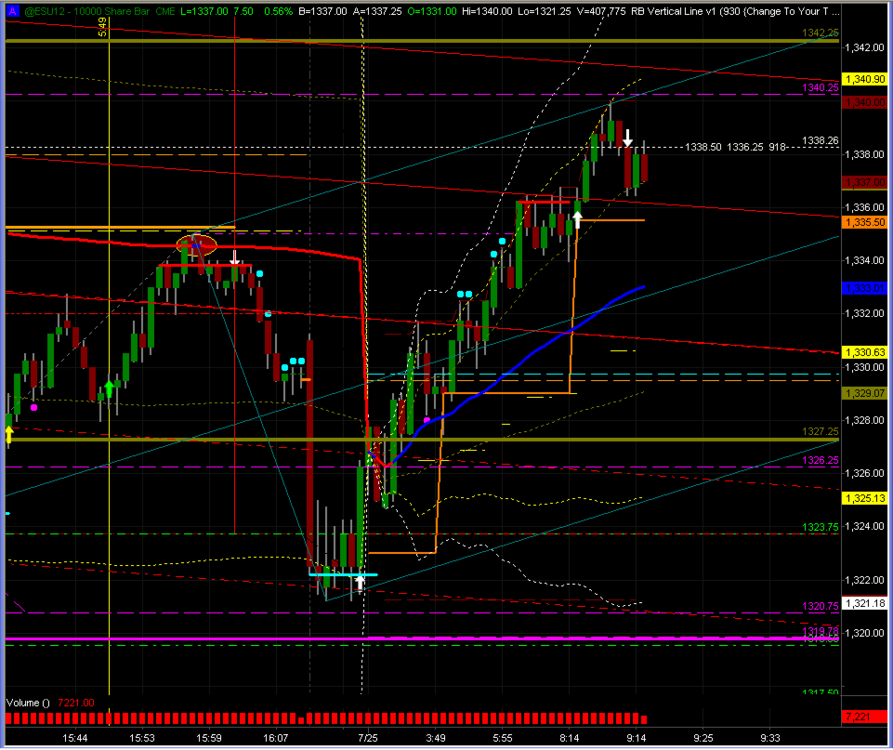
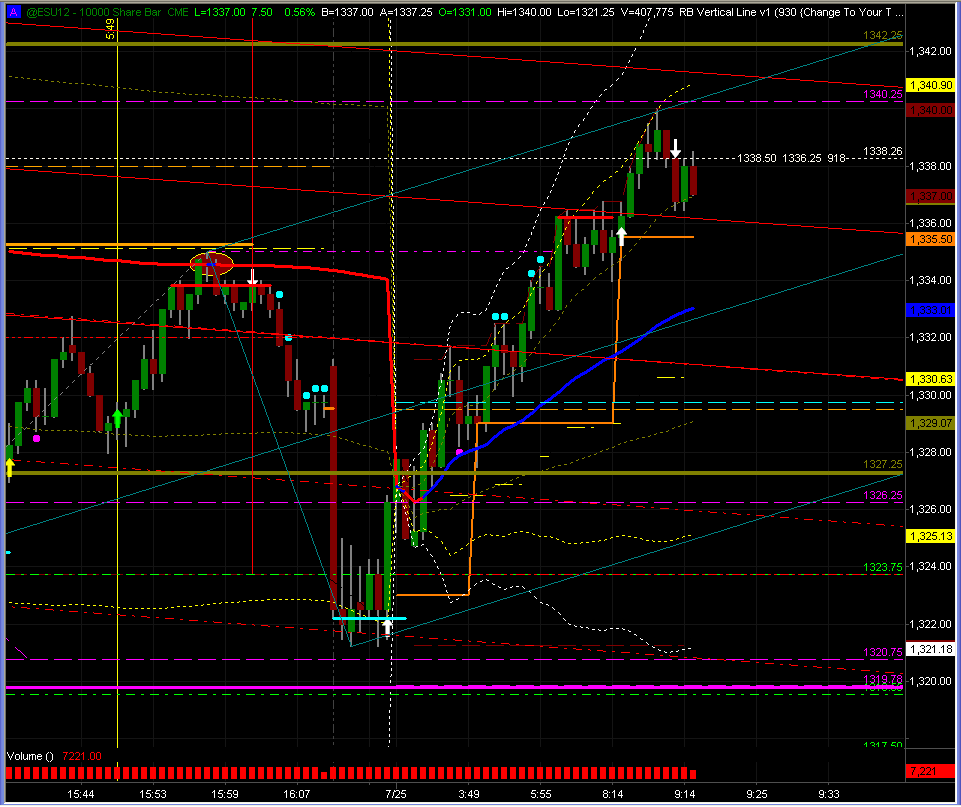
Clearly we want another crack at the 40.25 area today... Anyway, here's an non-annotated chart for all those interestedFrom the CLVN 1320.75 overnight low to the higher one at 1340.25. Excellent targets. Keep posting these. They're making me money.
Notice how the Upper Median Line Parallel is exactly at the 40.25 area. Had this on my chart for 3 hours.
-
Give your advice or comments on what I am thinking to do to make sure I am right track. You all have more experience then me so I ask you.All I can tell you is that I wasted 4-5 years going to different rooms, trying different styles and trading other people's ideas. Finally - after watching and trading for a long long time, it started to make sense. I have 3 setups plus I'll take trade when I know what is happening and not worry about a "setup".
I think if I had not spent so much time in rooms etc I might have shortened the path. On the other hand, maybe that was necessary for me to get it?
No one can tell you what will be your path to success. The only person to do that is you.
If you can last - you'll do okay. It takes an incredible amount of persistence.
If I had to do it again - I would trade much longer on SIMULATOR until I developed a real feel for my setup and had a record of success in different markets. Then I would transition to live with strict money management rules and stop trading the moment (if) I broke them and go back to sim as a penalty. Trade the smallest size possible and build your account slowly and add a contract after you make 2x the margin. Also - take 1/3 or 1/2 of your gains out of your account EVERY week to get a paycheck. Treat it like a business/job and it becomes more real.
SIM can save you money. When I started it wasn't available.
-
Thanks for the update EL. I am considering opening an additional account with them.
-
No matter what is the commissions of other brokers DON’T use AMP they are outright thieves at the end you’re going to lose having a broker like themCan you supply some details to backup your claim? How could they be "thieves"? Was your experience based on placing orders with them electronically?
-
... I think it is the consistency of the trading approach with an edge over a large sample size that is important.You're absolutely right. You can't make BIG money without trading size. To be able to trade size you need consistency. Having an edge, and making small consistent gains - then adding a contract after the margin (or 2 x the margin) has been made, is the key to adding size and exploiting the edge.
The discussion of return as a percentage of account means nothing when trading futures IMO.
-
You can get Dalton's books at the library (or Amazon). Mind over Markets and Markets In Profile (start with this).
Even if you don't use Market Profile Theory to base your trading decisions on, it is critical to having an understanding of market behaviour.
There's a lot on the web such as http://www.cisco-futures.com/auction_market_value_theory.html
My reference above mentioned CBOE it's actually CBOT which holds the copyright.
Notice that the market traded down overnight to within 1 tick of the CLVN that I referred to yesterday. A lot of what current market profile trading involves today is to look at composite profiles and to infer that price may revisit certain areas based upon the formation of the profile at those areas.
-
The red horizontal lines are low volume nodes, green high volume.
You can see for the high volume that the composite profile on the right has longer lines than for the lower volume nodes
This chart / indicator keeps track of how many contracts are traded at each price and then, in comparison to the entire composite's volume, calculates the length of the horizontal line required to reflect that volume
Consider that at one price there may be 100000000 contracts traded and at other prices much less than that. What does that imply?
It is an auction process. It tells you that the market thinks that price with the highest volume represents fair value. Price will tend to stay there until acted upon by an outside source. ie news
You can study market profile theory by going to the cboe website and downloading the free course
-
Yes, I got that measure move as will of 1328. It was the measured move from the bear flag, but same thing as you calculated. Lesson learned and notedYou saw a bear with a flag up there? :haha:
Oh .. count the waves. Wave 1 down , slight pullback wave 2 to the D target (wave 3), slight pullback wave 4 and now we're in Wave 5 down.
Below us is the next CLVN at 1320.75 which also has other support there, which Mr Negotiator kindly showed us in his chart.
-
Thank you ,Can you please comment what type of chart this is when you get some free time or reference?
Thanks,
That is a Market Profile chart showing composite levels for the period(s) calculated, usually the last swing we've been trading.
The important points of reference are the HIGH volume nodes (referred to as CHVN) and the LOW volume nodes (CLVN)
High volume means the market has accepted that as a fair price at some point and it is likely that price will return back to that area either on a retest of it or if it is moving towards it. This is choppy area that the market will chop around
Low volume means rejection (fewer trades occured there) so the market thinks these areas are unfair and will reject price if it retraces there. (Bounce or have it go right through).
Both of these areas can be viewed under certain conditions as reasonable targets. And once there, watch to see if price is rejected or accepted before placing a trade entry.
-
... 1332 was a support from yesterday and the other day when Ben was talking. ...You realize that from the opening bell, actually even a bit before, it has been a swift move DOWN. The trend is DOWN. DO you often take counter trend trades?
Have you considered looking for trend trades on days like today?
I am wondering - because it is much easier to trade on the short side today. And more profitable.
-
... How did you get 1328 as a measured move?Thanks
A = 9:27 High 1346.50
B= 10:50 Low 1334.75
C = 11:26 High 1339.75
Take A-B = 1346.50-1334.75 = 11.75 pts
C 1339.75 - 11.75 = 1328.00
BTW, I don't do all that stupid math - I just draw the first move down and copy-paste and place on the high of the upswing and mark the D-target. If the "C" high gets taken out, I move the line to the next high and the target shifts.
-
Took a long position at 1332.75 with 3pt stop and was quickly stopped out.My observation - in the for what it's worth department (maybe nothing?)
You might have observed some details about where the market weas headed by looking for a measured move which had 1328 as its target
Also - if you studied Mr Negotiator's chart you'd have noticed a CLVN at 1326.25 which held perfectly and seemed to attract the price.
As well, you could observe that the161.8 extension of the 1st swing down off the failure at the highs terminated at 1327.50
finally for me- i have 1327.25 as a major support on the 60min chart
for me it (the confluence zone) was the perfect target area for my short up at 1338.75.
Your entry wasn't bad - but had you seen these confluence areas you might have been able to take the short on the breakdown of your buy zone. I wonder why you put such a large stop on it?
-
Mr Negotiator - could you please post one of those fancy composite charts of yours so we can take advantage of this wacky market?
-
Wouldn't be surprised to see 1338. ... needs to find more sellers but it's vulnerable.
-
Market looking tired. Taking a small short trade. See what develops. Probably scalp only.IMO, there is a chance that the sellers will get active again and we could continue the move down. My short is at 43.75.

Day Trading the E-mini Futures
in E-mini Futures
Posted
Makes you wonder doesn't it when technical points line up exactly with fundamental news events.