
Welcome to the new Traders Laboratory! Please bear with us as we finish the migration over the next few days. If you find any issues, want to leave feedback, get in touch with us, or offer suggestions please post to the Support forum here.


bakrob99
-
Content Count
725 -
Joined
-
Last visited
-
Days Won
1
Posts posted by bakrob99
-
-
Reposting image
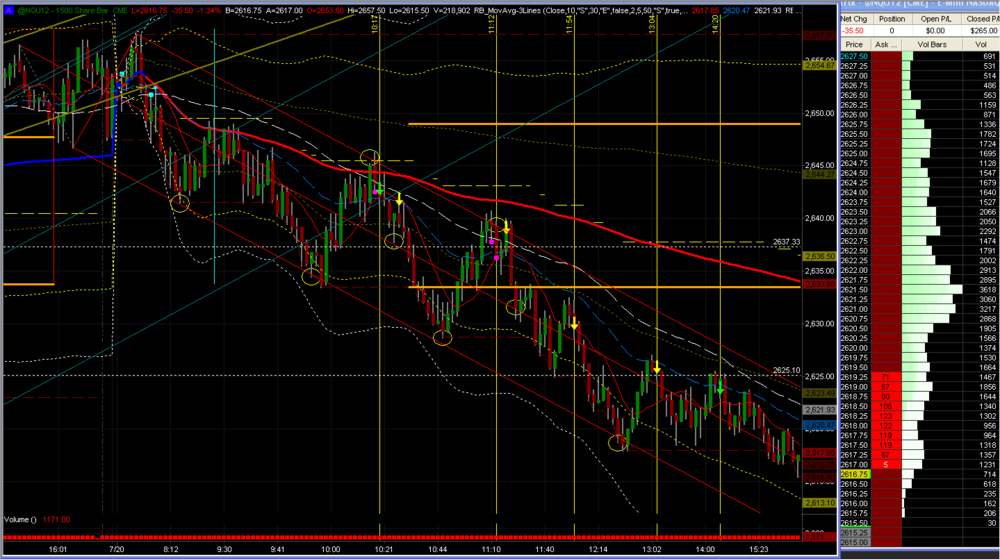
I had this ML on my chart at the open and was able to use it as a reference for the entire day.
-
Thanks for your answer. I'm logged in and see all your other charts. Just the two in Post #4704 are not visible for me.Ask a moderator. They show up for me.
BTW, I posted them to show that I had early in the move placed a median line on the 1500volume chart which for the rest of the day was a very good indication of where price would run into resistance and support.
When you get this type of confirmation, it makes it easier to hold the trade and even to increase size.
-
Unfortunately, I can't see your charts in this post, just two red crosses.You need to be logged in to see the charts.
... I like the Pitchfork-Tool too, but I have seen, that you use it sometimes a little different. It seems to me, that you focus very much on the median line...The median line is the line that the market achieves 80% of the time. Focusing on it is having the odds in your favour.
... The thin elongated Nontrend Day Profile, shown in Figure 4-22, is a good example of a one time-frame marketTrend days have elongated profiles, non-trend are shaped like a bell curve.
-
Probably too much to expect any rally when everybody has gone home. Hey ... don't forget to turn out the lights.
Friday afternoon choperama. Luv it.
-
FYI, I have a calendar reminder set for OEX Friday's that trading in the NQ or TF is often better than the ES. Too much hedging - arbs etc going on in the ES making the price action choppy. NQ has been much better for me today.
-
I took the trade as well. Actually - in both the ES and the NQ. I am outof theNQ and trailing stop in ES. Could go higher than 1362.00 Looking for a bigger move as the market has had a hard time (at least in the ES) going down today and I think we might have some bargain hunters buying down here. Just a hunch.
BUT keep in mind it is a counter trend trade so unless the low of the day is in - it will be stopped.
Update: Massive MF Sell pgm stopped at -2 ticks
-
...all that matters is whether our decision is in tune with the future direction of the market...For me personally, all I need is some kind of indication from the market of its intention. I don't need a location, although that certainly is preferable. ..
Here's one way I get conviction, direction and and idea of when to hold and where to exit.
Setup:
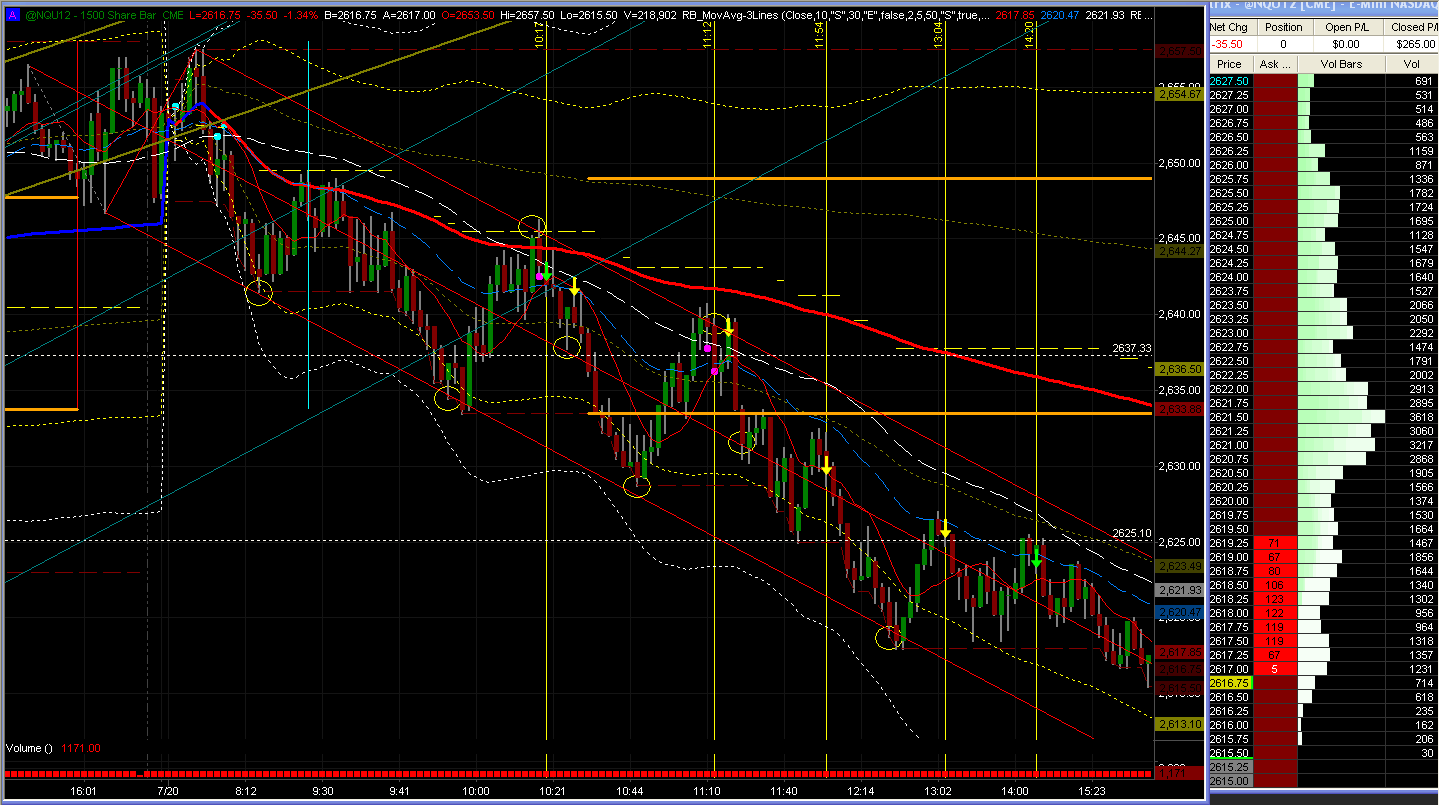
Notice the Down sloping (red) Median Line.
Here it is about 3 hours later:
When you have a trend and an very good median line that is in tune witht he frequency of the market - it can be extremely helpful in mentally keeping you in a trade.
Three great shorts for me in the NQ today.
-
Might be wave 5 starting down now. If it is , it would have to take out the 67.50 low.
Maybe yes maybe no.... got the 1st 4 ok but this 5th was not helpful. Was finished trading for the day anyway as it was in the middle
Don't diddle in the middle according to Jack.
-
Still expecting 5th wave down. Smack dab in the middle of the volume and market likes it here.
Mostly seeing evidence of buying.
Large SELL PGM and more to come.
This is not a good place to make a trade (IMO).
-
Here is my 5wave I drew (see above when I said NOW) and completion to CD-Target
Start of expected price action:
3rd wave completes as expected. Hit on the basis of Time and Price.
Wave 4 just completed on schedule
-
Long here.. last trade of dayI thought you said it was "topping"? FWIW, I am looking for 1366 .
We just had a 5-wave up move to the upper median line and the measured move D-target. Everybody already got long that wanted to. We need to do some selling to get more guys interested in buying.
Range bound low volume day rotational day.
-
see some indications the market may be topping...not yet
NOW. .
-
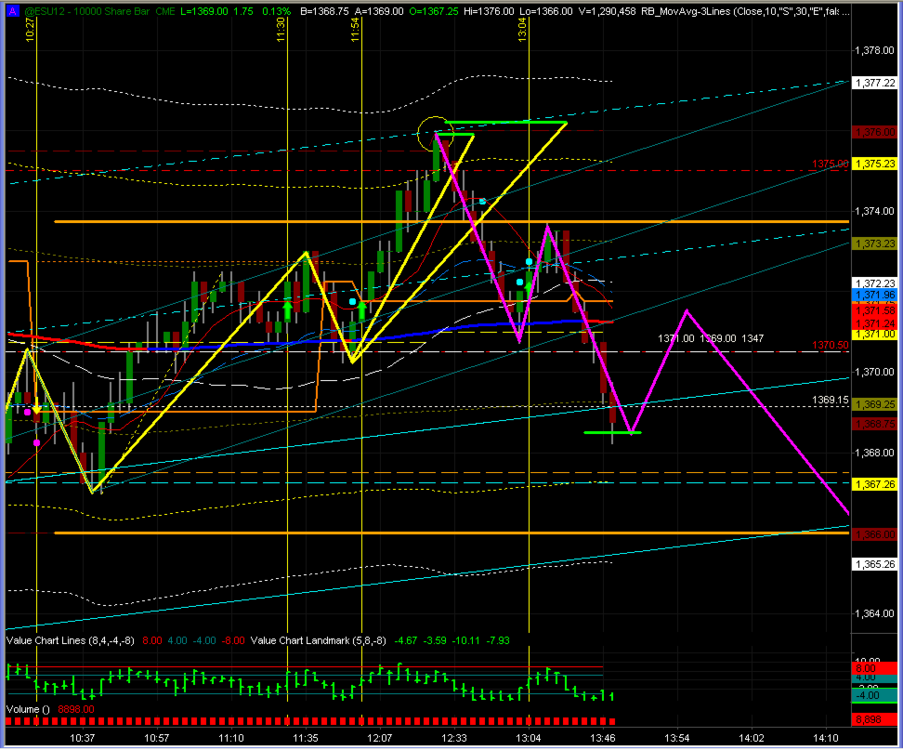
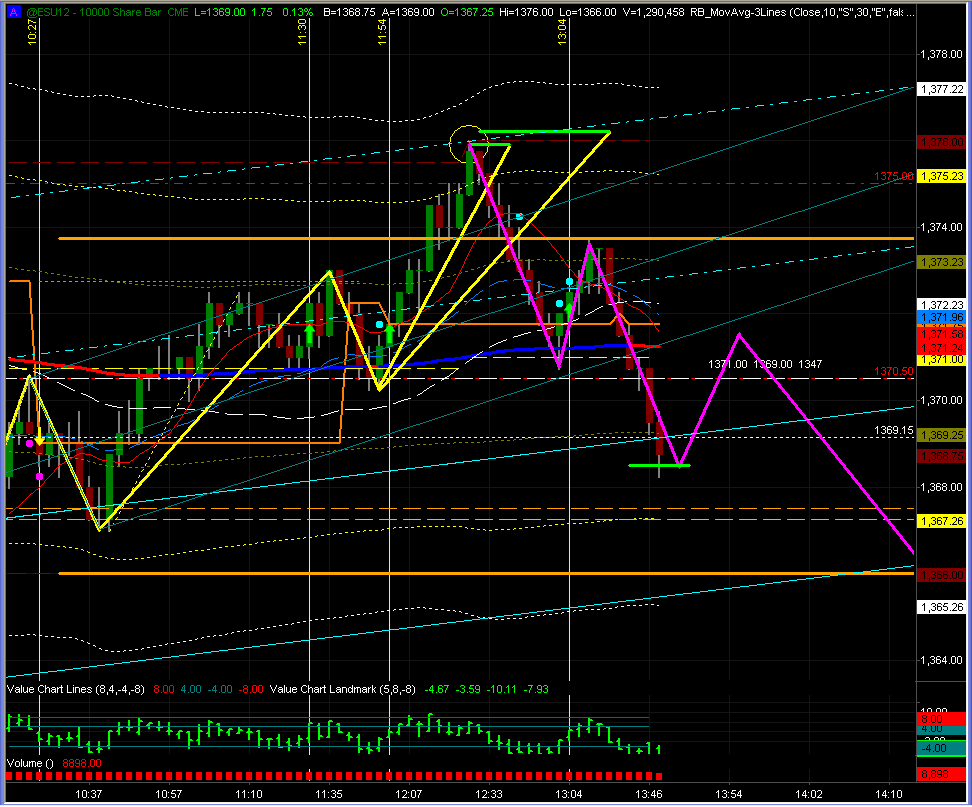
5Waves.
I draw them on my 10K Volume Bar chart. Helps to keep me in the trade and focused.
Target just got hit, and cooincide with Upper Median Line parallel that I've had on this chart for several days.

.thumb.png.cc6fe7f76321ae698ebdaaf7eca0bcb8.png)
-
...Anyway Rob, could you repost your colour coding key for your chart please? Ty.I set the volume for each color gradient based upon average volume traded in the market I am looking at. The ES has the highest settings.
Basically, when the indicator takes the difference in Upticks vs Downticks and compares that volume to the qty set and shades it as follows:
For Upticks > Downticks
Dark green Smallest Difference in buying over selling
Lighter green Next incremental difference in b/s
Lightest green Next increment
Cyan Highest increment
For Downticks > Upticks
Dark Red Smallest difference in Selling over buying
Lighter red " "
Brightest red " "
Magenta " "
Orange is VPOC of the bar/interval on Total Volume charts not showing delta
* marks VPOC of bar interval on Delta only charts
3 or more Large bright volume clusters in a row signify to me that there were large traders making the decision at that price and a retrace to it is likely to find another group of orders waiting to be filled. Exceptions exist of course.
Areas with mixed single or double red green colors show choppy rangebound zones.
I try to stay on the same side as the Volume Breakdown when considering what the TREND IS for the timeframe being traded.
-
There were plenty of reasons to buy near Settlement today IMO. But those reasons for me, did not materialize until the impulsive wave up at 10:20 and the creation of a strong (very strong) Buy Zone which was a reasonable low risk high reward probability at 10:40-45 EDT.
Both the 5M and 30M chart shows evidence of buyers there.
The trick (IMO) in trading is to get in at the right time in advance of a favourable move so it's easier to hold for a decent profit. It's all about timing.
-
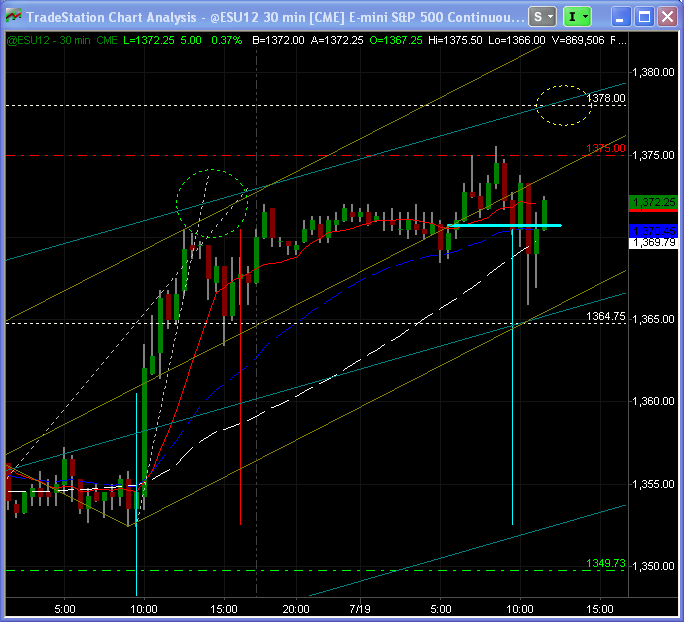
My Median Line based on ES 30M chart is trending higher and the target shifts with it. Now looking for 1378.00 But the 30M RTH volume was quite a bit lower than 10day average suggesting to me that we are in a day trading market and rotational in nature. Not sure whether we can develop enough steam to reach 1378.00 We'll see.
-
There you go , the levels posted worked and the trend reversed, Did you learned anything ?Even the most stubborn-headed trader must admit that a sample size of 1 is too small to base a conclusion on.
-
Almost a net profit of $400,000 then.BlueHorseshoe
I doubt it. His legal fees are probably that much. Not to mention the cost of running his 3 person boiler room operation. I think he's been hit and hurt.
But you still have to wonder at the gullibility of the trainees. And here's the missing question - Did Regan make a profit in his SIM account? Was the profit only because he got fills that no one else could? Were there any traders who follows his rules exactly?
I don't expect to ever get answers to these questions.
This should be a Number 1 rule for anybody in any sort of trding education room environment - if you can't communicate with other participants - then get out quick.
-
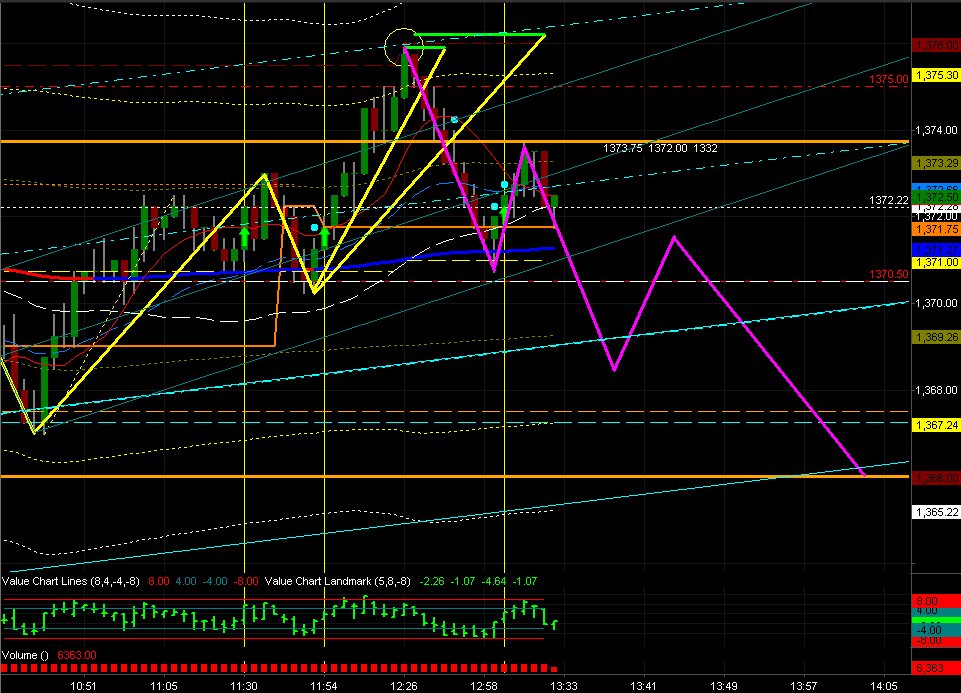
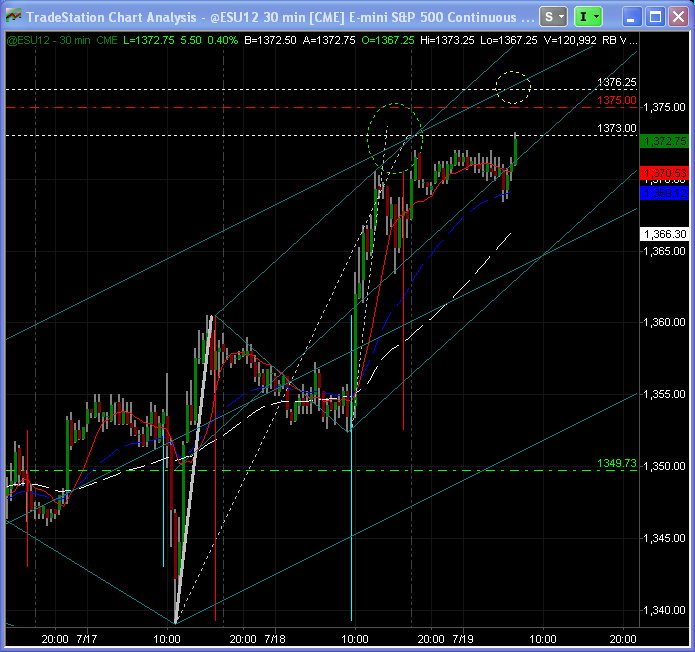
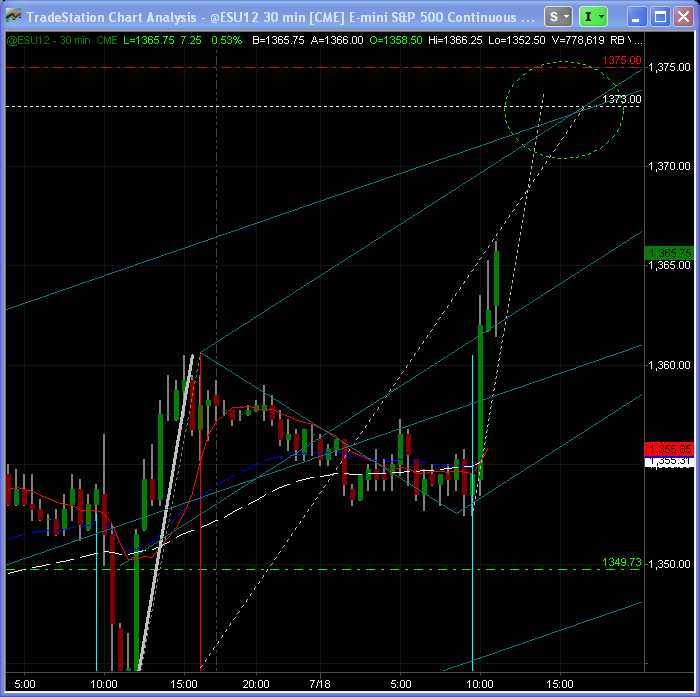
Here you can see the market still working to meet its median line Upper Parallel target projected yesterday pre-open. The 1373 target has just been hit - but the projection shows that 1376.25 area (and higher) are feasible.
Here's the updated chart.
If you haven't used median lines - or not found them useful - then you should check out Tim Morge's most recent webinars.
-
That sell off from the high down to the VWAP was a classic.
Pullback to 50-61%, sell to 1.618 ext at VWAP and bounce hard.
With all the talk about algos and buy-sell pgms etc. It's nice when these moves repeat the normal expected behaviour.
-
I closely watch the MAE and MFE in my trades...So do I. Long at 65.25 off VWAP bounce. Now not sure if we're going to sell off or try to rally. Sitting on hands
-
Got to 1370.50 so for me the target was helpful holding on to longs. The top came in with selling and any buying since has not raised prices.
Now back to VWAP but the sellers have the upper hand right now. Not sure if we'll make a new high today.
If VWAP holds - then maybe will. But I doubt it.
We had 3 pushes up and that often marks the end of the bullish period. Now we've corrected ab-cd correction and price going sideways.
The next breakout of this range up or down will determine the rest of the day's trend
-
... It was a bit risky pulling the trigger long dis morning at the pivot point knowing Ben Bernanke would be talking soon. I kind of regret it now!What was the risk?
Rather than say it's risky - (I think) what you're really saying is ... "I don't know if this is going to work". Well, you NEVER know if a setup is going to work.
Assuming you use a stop for your entry ... you know the risk. If the reward is hit and large enough to warrant the known risk - then pulling the trigger should not be a concern.
-
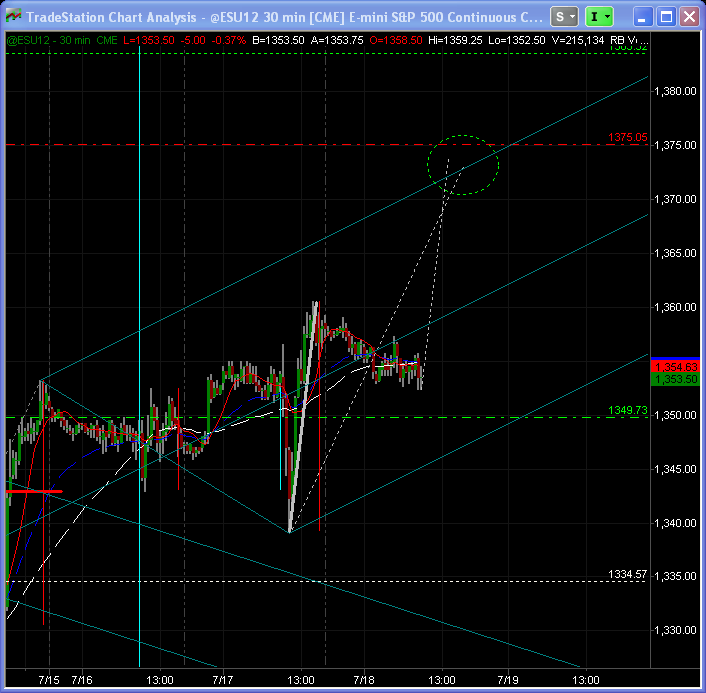
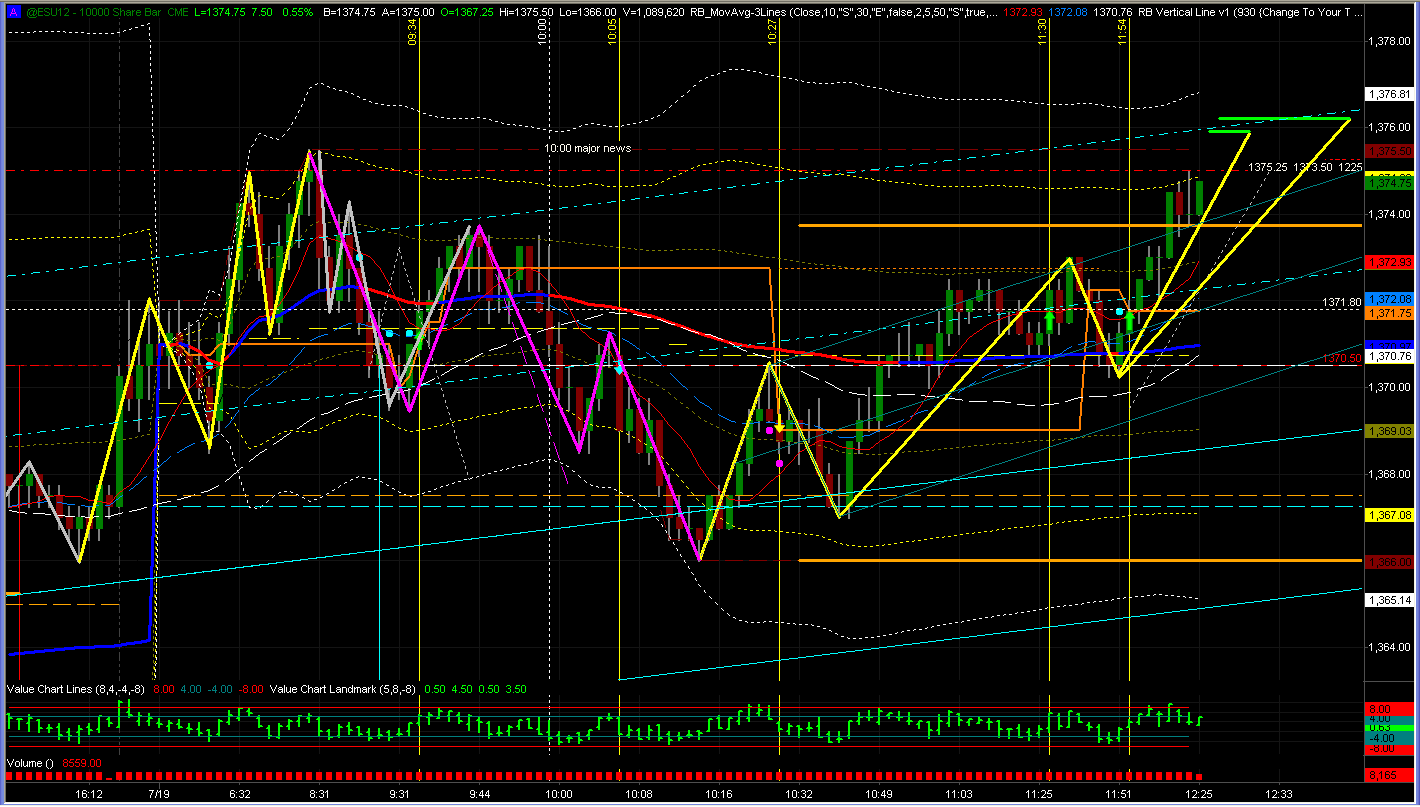
I see some strong convergence towards 1372-1375. Downside 1350 but I am expecting higher. Will wait and see what happens 5minutes into the open.Now that I have a minute I'll post the chart which was leaning me toward the 72-73 areas.
(Other than the obvious very shallow pullback from the impulse wave up yesterday)
Here's the price action 90 minutes later

.png.9989f89fea3b8e2c11fd4c4f2f9c2e1c.png)

Day Trading the E-mini Futures
in E-mini Futures
Posted
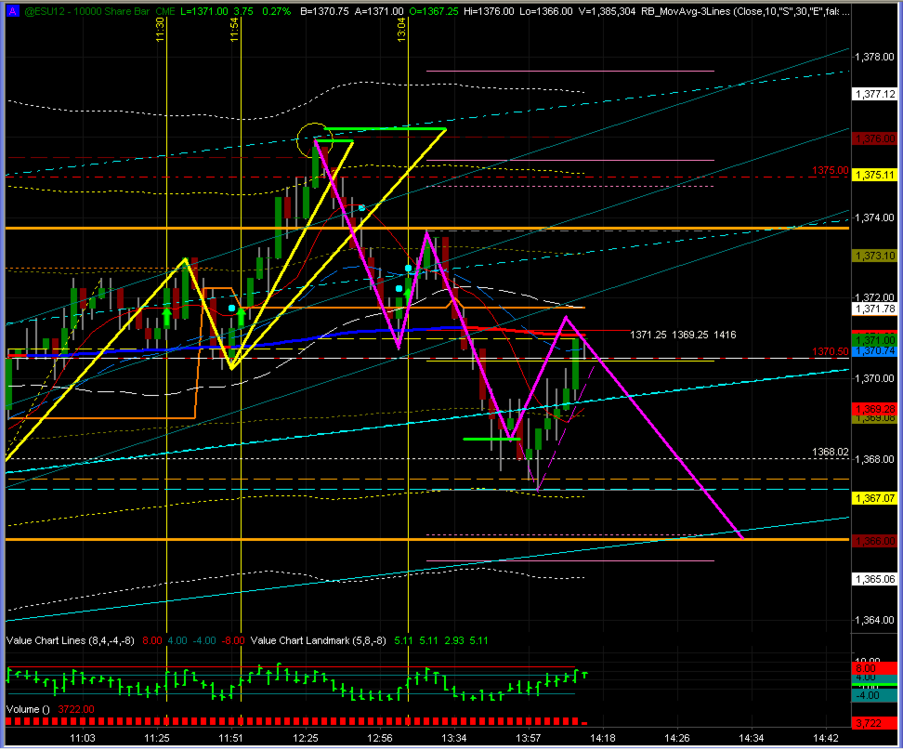
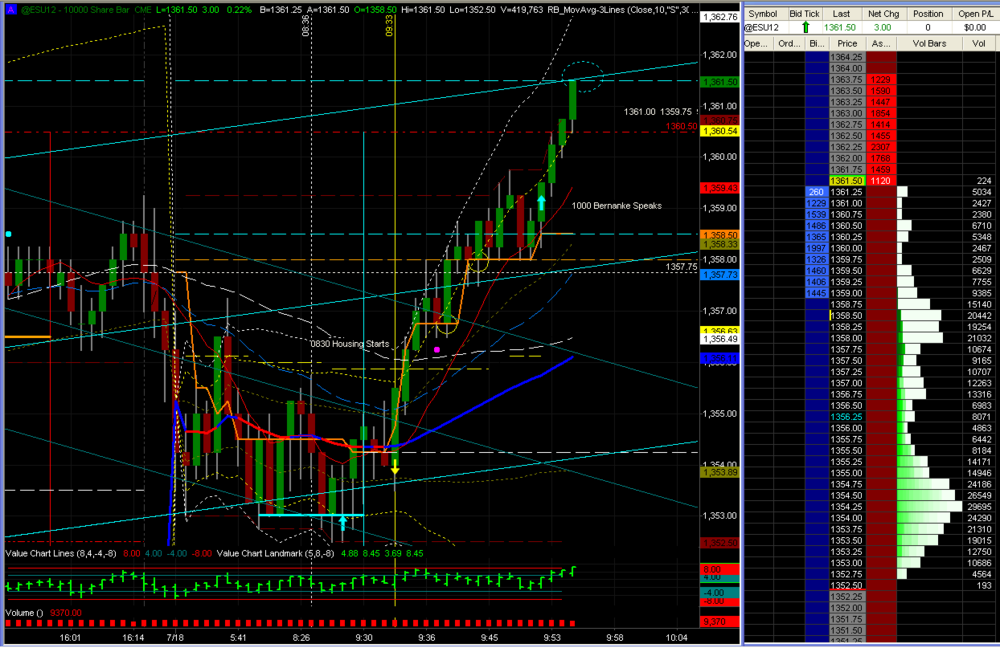
Drawing a median line on a swing after a pushup gives me more confluence and confidence in targets. Here you can see that the 127 extension (pink) and the upper median line parallel (yellow) were in exactly the same time and price on the 10k ES volume chart.
Long came off the bounce at the Median Line lower parallel which offered a classic test - retest. (The cyan dots are automatically put on this chart by my indicator telling me to "buy").
Next target 1345.75 which is measure move and 161.8 ext.