
Welcome to the new Traders Laboratory! Please bear with us as we finish the migration over the next few days. If you find any issues, want to leave feedback, get in touch with us, or offer suggestions please post to the Support forum here.

brownsfan019
-
Content Count
4271 -
Joined
-
Last visited
Posts posted by brownsfan019
-
-
Question for Mark, Pivot and others using WRB's - how do you define what a WRB is? I've read a few things the last few days and some say purely a visual thing and others have a defined formula.
-
Good discussion guys, thanks for the comments.
Pivot - I have looked at exiting on a WRB based on my initial entry and VBC being used, but the problem I have found there is that since I am trading on a 'smaller' VBC, a WRB can appear rather quickly on this type of 'timeframe'. Which often causes a very quick exit. I bumped it to a higher VBC to stay in the trade longer. I've thought about multiple exits on multiple timeframes, but to be honest - that's a lot of charts to examine when trading 3-4 markets at the same time. I'm not willing to miss an NQ setup b/c I was starting at 3 different YM timeframes. The other thing I am noticing Pivot is that for me at least, the first WRB that shows is a pretty reliable exit level. What I mean is that since my stops are 'snug' there is a possibility that after I enter a trade and see a WRB form, price can retrace close to or at my stop level. Now, if my stops were larger I could possibly stomach that retrace (like the example you posted in another thread), but most often than not, my stop may be taken out. By exiting on the first WRB I see on a higher VBC chart, I'm not getting shaken out on my smaller VBC chart and still catching a good part of the move that is currently in front of me.
Bramble - we've discussed candlestick trading in other threads. I understand how effective candlestick analysis is done as I've been trading candlesticks for years. Your comment - "You comment that you’re getting smaller profits using this method which is understandable, you’re not letting them run. If by using this method you’re also getting fewer losing trades then I suspect it may be an issue with the underlying system itself rather than this bolt-on exit criteria." First, I am comfortable with my entry method, so there is no 'issue' with the underlying system. Second, if I am getting fewer losing trades by trading this way, how is that a problem? By exiting on WRB's in the very simple fashion I have looked at, the vast majority of my trades are profitable and even when a stop out is taken, my stops are usually not more than 7-9 ticks on the YM.
Mark - as always your posts are very welcomed here! I have no problem admitting that WRB's are new to me and I am learning here as well!
With all that being said guys, I like to keep things simple. I've expressed that a number of times here. I have always wanted to perfect my exits even better than what I was doing, and right now, it looks like WRB's can work for me. More analysis needs done, but I at least wanted to get a discussion going on the topic.
I should also mention that I am not trying to hit home runs here. I would love to hit singles and doubles all day. My goal in capturing a move is 30% - 50% of that move. Let me define that - I'm not talking about the entire move all day (partly b/c I only trade till Noon or so), but from my entry to the very low/high of that 'move' I would like to capture 30% - 50% of that. If that 'move' is 20 ticks, I'd like to take out 6-10. That's how I view my exits - what % of the move did I capture? And I think that's why WRB's may work for me. On higher VBC charts, WRB's happen to appear at the low or top of a move (or pretty close). That's all I'm going for each trade - I'm not looking to take one trade and ride it all day. I'd rather take multiple trades whether that is in the same direction all day or opposite directions all day.
-
We've discussed WRB's in a couple threads, but since this is something that has grabbed my interest, I was hoping we could discuss it here.
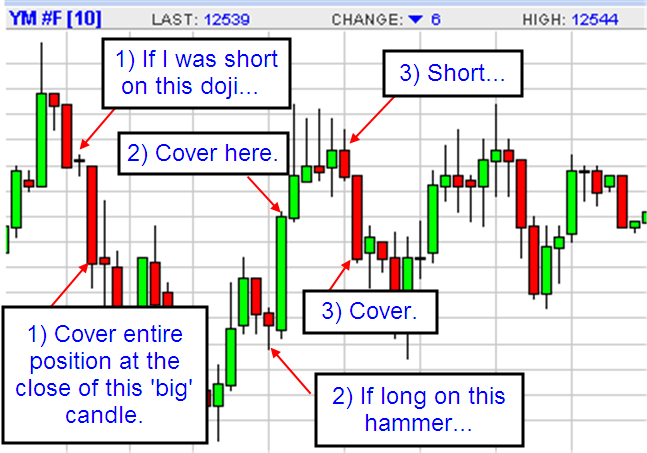
I've been watching WRB's or what I 'see' is simply a 'big' candle and from a perspective of exiting a trade, they appear to be good. Now, I may be oversimplifying how they are supposed to be used, but here's what I've noticed and have actually used this past week...
- My entry and initial stop is the same as it's always been - using VBC's on 'shorter' timeframes. WRB's have NO impact on my trade setup.
- After in a trade, go to a 'longer' VBC chart and use WRB for exit.
My version of WRB/Big candle exits is rather simple - when I see a big candle on my bigger VBC chart, I exit at the close of that candle. And I exit the entire position here using a market order.
Here's what I have seen - since I use smaller initial stops, by exiting everything on the first big candle I see, I am able to exit trades quicker w/o a threat to my initial stop. In a bigger move I simply look for another trade setup and repeat the process.
The other thing I have seen is that I am taking smaller gains more, but that is all the market was willing to 'give' me.... I believe we discussed this in another thread and I may be coming around... :p While getting 15 or 20 pts on the YM is nice, if I am able to get 12 with no problem, it may be best to take it while there. It's frustrating to want 20 and if it goes 18 and then reverses on you, was that 2 ticks worth it? Up until analyzing WRB's though, I did not have a good method for exiting trades.
I attached a chart to this purely for illustration purposes. These were NOT actual trades, I just grabbed a YM chart off of quote.com since my TS is shut down for the night. You'll see that exits are not perfect, but I think they are pretty darn good.
I'm curious to hear what is working for others who are using WRB's in their trading or at least watching them. Maybe we can even get the WRB guru (NihabaAshi) to share some ideas with us.
Here's my biggest question right now - what is the theory behing WRB's and their practical use in trading? I am proving to myself by looking at actual chart setups as to whether I like what I see, but I don't quite have my arms around why these work and why they make for good exits... My idea right now is that a 'bigger' move may be followed by some 'correction' due to the supply/demand imbalance that happened during the WRB - while the WRB is being formed, that would show us that either the bulls or bears took control during that timeframe and sooner or later, they will have to take a breather. That's not to say that the current move will not continue, but some sort of breather and/or correction could happen; which could take a stop that is snug (like mine) out easily.
SHORT HAND KEY:
VBC = VOLUME BASED CANDLES (more info here: http://www.traderslaboratory.com/forums/f34/volume-based-candles-how-profit-1414.html)
WRB = WIDE RANGE BODIES (info scattered throughout some threads)
TS = TradeStation
- My entry and initial stop is the same as it's always been - using VBC's on 'shorter' timeframes. WRB's have NO impact on my trade setup.
-
Neal - in regards to VBC's, I can tell you that the setting depends on what YOU want the chart to do.
In other words, if you want a chart that prints candles 'quicker' than you should start at 1000 or less (on the YM). If you want a 'longer' term chart, go above 1000. The exact number is not terribly important in VBC's.
To see what works for you, simply open 3 YM charts and start one at 500 VBC's, 2500 VBC's and 5000 VBC's. From there, you'll 'see' what you like and then you can finetune it even more. If you like the 2500 chart, then run a 1000, 1750, and 2500 chart. And from there, you can narrow it down even more.
Just keep in mind that whatever setting you choose, you need to use that setting each and every day. It's very easy to see that today a 1500 VBC chart was best and on Tue it was 500 and last week was 1000. You are never going to know exactly what setting is best for the day. The other option is to have 2-3 VBC charts open at the same time.
-
I think what Bear and I are trying to say is that there is no system that accurately predicts trend days vs. non-trend days with any consistency. And if that does exist, coupling that with when to exit the trade makes this a trader's holy grail.
Know when we are trending and when we are not. And then knowing when to exit based on the type of day being predicted. You have to be right on both sides of that equation for that work. How many days have we seen where the market moves in one direction (trend) and then reverses (into another trend) OR simply pauses and continues the previous trend? We can all post charts illustrating that, but looking at charts that already happened does not help the argument. There's always a reason why the trend continued or why it stopped in hindsight.
Great question and as far as I am concerned, there is no answer to this. And if you got it, you better lock it up tight and make millions off of it.
-
lol Brown... but I got a nice lifestyle... I repeat, it is possible, its about wisdom, faith and experience... market its like women... you have to live with one to real understand how they think.... cheers Walter.I couldn't agree more which is why I am saying that I am saying - there is no bullet proof way to know if you are trending or not.
Just like a woman - you have no idea what you are going to get sometimes... Just when you think you have it pegged, you are quickly reminded that you can be wrong rather quickly.

-
I've traded both, too...and I can tell you ER gives me a heart attack! YM fits my personality to a T, so I feel like we're meant to be together. ER is fast paced, jerky, volatile....and YM is smooth. It's kinda like... Sex Pistols vs Barry White. Insane vs extra smooth.
Well said Tin!
I am the same way - while hindsight trading looks great on the ER2, you must be very quick and nimble there. There's no waiting around for you to make a decision. The YM doesn't always move as 'fast' and you can take that extra second or 2 to get your order out there.
I would also add the NQ to the equation as well. It's kind of a mix of the ER and YM - not too fast, but not too slow either. Some days the NQ is my bread and butter. Why do some people ignore this market? It can provide some great moves while waiting for the YM to do something.
I also like the EC, so it has nothing to do with tick value since the EC is $12.50/tick.
-
Different strokes for different folks I suppose.
Again, if ANY of these theories worked in real-time, you would be a multi, multi-millionaire with very little risk, aggravation, etc. Of course it's not 100%, but if you can bat 70%+ on your theory, then your account should reflect that.
Knowing if we are in a trend or not within the first hour is the holy grail as far as I am concerned. You can ride out the entire day just watching your P&L skyrocket.
And of course - knowing that we are in a trend or not is just ONE part of the equation. The next part is when to exit... But I suppose if you know when we are trending you will know when the trend is over vs. a brief rest or pullback.
As The Bear said - it's very easy in hindsight to look at a chart and see a trend. Anyone can do that. Performing the same analysis in real-time and executing according to that analysis is the difference.
-
As long as you sent through a reputable bank or wire company the money cannot just disappear. I've had wires 'missing' but they eventually find their way. Just contact the firm you sent it through and ask them to do a trace. It could be sitting at your broker's general account but not sure where to go from there.
-
That is the million dollar question. With the answer to this question, you could become a multi, multi-millionaire rather quickly. Since this is not realistic, I think it goes to show that no one knows the answer to this (and probably never will).
Some argue based on indicators, price action, etc. and I personally believe there is no answer. You don't know you are in a trend till 4:15pm EST. Until then, it's anyone's guess!
-
Pivot - I understand that your 'version' of candlestick trading is different than mine, I was simply pointing out what I saw. For those reading the thread, they can get a couple different points of view.
Question though - would you have honestly held onto that first hammer through all the 'retracement'? It would take some guts to buy on the hammer with a fairly large stop, watch it retrace past the low of that hammer and then watch it go up.
You are right that a candle by itself is not a valid signal, but in traditional candlestick analysis (what most will be starting with) that 2nd hammer is a beautiful setup.
We should make it clear here that your analysis is based on work by Mark Perry (seen at elitetrader.com) and my analysis is more the 'traditional' candlestick analysis taught by Steve Nison. This is not to say that one way is better than the other, I just want to make it clear for those reading this thread wondering why we have different views and are looking at the same chart in the 'candlestick' thread. For me, candlesticks are primary and WRB's may be used in conjunction with them.
With that being said, I am new to WRB's and learning more about them daily! Hopefully Mark will post in this forum and head shed some light on them for us!
-
Correct Brown, you see there you are aplying weight to TIME on your aproach, wich is fine and it would at the end discount a volume analisis, what happens is that you dont have that much visual aid to measure this time from an indicator "visual screen" point of view.... I think I have an indicator you may like.... it measures in histogram format how much time took to build a bar.... maybe that will give a better visual of what you are doing.... said so you are having weight and we may say you are doing volume analisis.... cheers Walter.Do share Walter what you have in mind. I will take a look!
-
so said: each bar has the same volume weight, same activity weight... so ironically when you give a same wheight to a bar you literally anulate any volume analisis on your chart... you only have the price action left on the chart.... "you may say I have a 1500v hammer", well yes, but the previous bar was also a 1500 v bar and next one a 1500v bar... you see... volume based candles are that... its really not volume analisis... maybe they share some word on the name, but true volume analisis must be able to measure from bar to bar diferent "weight" of volumeWalter - actually in real-time that is not true at all. By applying VBC's, I can visually see when there is and is not volume. For example, today's volume is terrible. I did not need an extra indicator or anything to tell me that, all I had to do was look at my chart. Candles are taking longer than usual to print; therefore I already know the volume is weak today.
I realize how this looks in hindsight, but until VBC's are applied to a real-time chart, it's hard to explain.
-
Here is a picture for Brownsfan019: remember this discussion ?
Note that we have a valid Bullish White Hammer pattern form on the 5 minute chart.
Now, most people would want to place their stop at the low of the candle or just a pip or two below that. That area creates the "Logical Stop Area". The problem is, while the area is logical, it is also a prime target for the Big Boys to hunt stops.
Hence placing one's stop just below the low of the hammer line is not the ideal place to put it. Unless it also coincides with some other strong support area. Like WRB or Value Area Pivot for example.
In this case, BF we see our dilemma: do we exit or do we wait until our stop gets hit to prove us wrong? There is yet another option that we did not touch on; A contingency plan that would tell us to stop and reverse. Said plan would not necessarily need to be triggered by our initial stop being hit, rather by changed conditions in the Price Action itself.
At any rate, the key here is that we should be careful of placing our stops in the obvious (logical) places in terms of Candle Patterns.
P.S. Everything here comes from Mark's(NA) thread on elitetrader.com
Pivot - here's my take on this particular chart - I place my stops at the 'logical' area. Why? B/c if that hammer low is broken, that hammer is no longer a valid trade in my opinion. The question then becomes how much lower do you go to place your stop away from the logical area? If today 5 ticks works, tomorrow it will fail. So then you bump it to 6, then 7... We've all been there.
The other consideration is how big of a stop are you willing to stomach? I love hammers, but also know that some can result in very large stops (at least for me). A smaller chart timeframe will normally fix this, which is why I probably trade on smaller VBC's (Volume Based Candles).
See my attachment for what I see...
1) Valid hammer that looks to have a large stop. It may have delivered a profit target depending on what you use to exit.
2) An even better hammer than the first - smaller stop needed, a better 'looking' hammer (nice clean line with a textbook looking hammer). The end result was no threat to your logical stop whatsoever.
So I see 2 trades here with one that did not produce much and one that delivered nicely.

-
While I planned only to create a post when there was a valid Candle signal for the day I wanted to make this post about when not to trade. Even if there is a valid candlestick trigger, there are instances where it is better to stand aside. Or better yet maybe we should get down to defining what a valid Candle signal is?...Ahhh... perhaps the best statement throughout this entire thread... what exactly is a 'valid' candle signal?
Having trading candles for awhile now, here is my definition of them being used in the traditional candlestick analysis - first, you must have a clearly defined trend. Why? Traditional candlestick analysis is meant to signify the possible end of a trend. Can't end a trend if you do not have one.
Step One: Be able to clearly define trend.
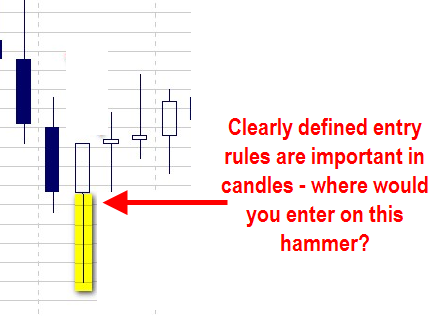
Once you've established a trend, then it's a matter of seeing a valid candlestick pattern/formation and then implementing your entry/stop technique. I say that b/c I've read many different views on how to enter a trade once you see a candle setup. Let's say for example you get a hammer. Some would say as soon as you see a hammer, enter a market order to go long. Some would say that you want price to rise above the high of the hammer and then enter. Some would say wait for price to retrace to somewhere in the body of the hammer and then enter. So, it's a matter of trader preference on where to enter and where to place the stop.
I attached a screenshot of a chart from this thread. You see a valid hammer signal, now the question is where and why do you enter? If you wait for a retracement into the hammer body, you may be waiting to long and never enter the trade. If you enter at the top, you need to have a larger stop... See the possible dilemna? You cannot just wing it, you must have written rules before placing any live trades. It's easy to say that you would go long right away on this hammer b/c it did not retrace much, but another hammer pattern could easily test the low of that hammer.
Step Two: Implement your entry and stop technique.
After that, it's a matter of managing the trade and exits. We've discussed WRB's, trailing stops, set profit targets, etc... Again, a matter of trader preference.
Step Three: Manage trade according to your specified rules.
------------------
------------------
MrPaul - regarding the chart you posted, following my normal trading plan as stated above, I do not believe the first doji you have highlighted is a valid candle signal due to a lack of trend. I personally do not call one up candle an uptrend; therefore I would not consider a trade based on that doji.
Your other gravestone doji could be a candle signal. In your example volume is also a filter, so this may not be a valid trade for your setup.
-
Another idea here re: Volume Based Candles - they help 'smooth' out the entire market times, including overnight and premarket times. You will normally see less candles being printed during these times, but your chart will get smoother. This in turn can make other indicators/tools a little more reliable, esp in the AM around the open.
That was another frustrating thing with candles on a minute chart - you would see doji after doji in the premarket and then boom, off we go at 9:30am. Well, if you are trading candles in traditional fashion and looking for a trend reversal, you first need a trend.
Just another reason why I would highly recommend the review of VBC's (Volume Based Candles).
-
It can get real interesting in premarket times on the indexes. Here was one example on the YM this morning.


-
If one was to witness the market live they could say that there was a lack of sustainable smooth volume flow.When looking at Candles from a supply/demand complex it is essential that there is sustaining volume flow. That is what carries momentum within the market so that you can exploit an edge.
MrPaul - I'm curious to what "sustainable smooth volume flow" is...
-
Im not sure how it works over in the US, but in Tokyo everything is taken care off. When I changed my line to fiber optics just recently I had the guy from the internet provider company setup the hardware for free. All I needed to do was purchase a router, plug it into the fiber optic box, visit my internet providers website, and it read my router automatically. Took me like 5 mins.Soul - sounds nice! Not sure how far we are from fiber optics lines here in the US... I've read that it's out in a very limited capacity, so I'm not holding my breath. Till then, it's cable! And I recently picked up the Verizon Wireless Aircard as a backup. It's not too bad actually, I get a decent signal and can purchase a strong atenna if need be.
-
I think one of the best way to incorporate volume and candles is to use Equivolume chart, though there are not many software packages to support plotting this special type of candles.And here is a most comprehensive guide on how to trade equivolume by R.W. Arms.
Z - the only problem with equivolume is that you cannot apply traditional candlestick analysis to it. Each print is simply a rectangle - some bigger, some smaller. At least it looked that way from the PDF you attached.
Did I miss something?
-
That's what I need to know. I figured it was easy, but wanted to ask before I ended up with no internet for days!
-
the technicall name for that upside down hammer is shooting star...Walter - yeah, I can't even get the names right when I try. LOL.
Shooting star, hanging man, whatever... That's what I say!
Joking aside, it's best to learn candles the 'right' way and once you get it, you'll see why I call upside down hammers inverted hammers. Just easier on the mind (my mind at least).
I think part of the power of candles is that many traders use them in some shape or form. We may not all see the candles the same way, but there are many traders using them, which is why I think they are so powerful.
I'm hoping Pivot and I can get a discusson on WRB analysis going as well.
-
This is where WRB analysis comes into play. One can use Wide Range Bodies as profit target/profit taking levels. WRB analysis will give one support/resistance levels as well. They are also usually precursors to (secondary) candle patterns analysis.In the chart below, note the WRB's that precede the valid sub group hammer pattern.
Once in the trade, one can use the creation of a WRB to exit some of the position. Note as the candle becomes a WRB, some of the position is taken off the table.
Pivot - interesting. Let me ask this - what is the idea behind exiting on a large real body being formed? I don't know much about WRB as it's been awhile since I looked at it, so maybe you can give us a little education leeson here.
I understand that the exit is when a large real body is forming, but why? Also, how is a WRB actually defined? In other words, when you are preparing to exit when you see a WRB, how much of a move constitutes a WRB? Are you already sitting out there with an order or just hitting the market button as the candle forms?
I'm really curious to hear how this is used in real-time trading.
Take a look at my attachment - would those be other WRB's? If so, why do you ignore certain ones?
This could really be a thread in itself really. Maybe we should have someone move these 2 posts to a thread about WRB.

-
What would be great is if they had a volume chart which kept the time scale at the bottom constant and simply widened the space between the bars to match the passage of time. That way your eye would instantly see all three--price, volume and time--reflected in the candlestick chart itself. Call TradeStation!
GCB - I see what you are saying, the problem there would be that during certain trading times you are going to get massively large or small candle bodies. For example, if you want the first 1 hour on your screen, some days there could be hundreds of candles squished down to meet your parameters and others day there could literally be a handful of massive candles. The EC comes to mind - some mornings this thing is printing like crazy (and would cause your chart to be super tiny) and other days it can put you to sleep (and would cause your chart to have massively large candles).
You are correct though, anyone looking at these charts in hindsight needs to pay attention to the actual time elapsed between each candle print. There are times when it's literally seconds. So, you may see a great hammer on a chart and think - Wow, look at that hammer! And while that is true, in order to capitalize on that hammer, you may have need to pull the trigger in a matter of seconds. So, from start of the candle to your entry - it can be under 60 seconds easily.
Wide Range Bodies or 'big' candles
in Volume Spread Analysis
Posted
Good posts guys!
As always, how a trader implements a strategy is up to that trader. I like what I am seeing with WRB's in my 'simple' form.
More testing required...