
Welcome to the new Traders Laboratory! Please bear with us as we finish the migration over the next few days. If you find any issues, want to leave feedback, get in touch with us, or offer suggestions please post to the Support forum here.

TinGull
-
Content Count
1444 -
Joined
-
Last visited
Posts posted by TinGull
-
-
Using Tick charts, too, will help you see the volume without having volume bars. As the bars form faster, you know there's more going into the market.
For divergences, as Soul was mentioning my with my trading, I look at the number of contracts at the bid versus ask, and use the delta of that to see how much pressure there is as we approach pivot levels, or market profile levels. See some of the pictures under my name on the right under "my photos" to see more of what I'm talking about. It's a very useful tool!
best of luck
-
Thanks Walter! 22T chart, huh? That's a fast moving chart, especially on ER2.
 Chris, 5P, was the one who got me hooked on it too! hehe, funny. He was a wealth of information and gave me some great tools to step up my game.
 Let's definitely talk more about this...I'm about to leave to catch a flight home, though...so can't write more. I'll catch up maybe tomorrow with this.
Till then!
Chris
-
-
He's a riot. I listened to him almost every morning for months...he's a bit too intense for me to listen to, though. ShadowTrader.net is him.
He NEVER looks at anything below 15 minutes except for the opening 5 minute. Most of the time the stuff is right on, but he's strictly a stock guy. Doesn't care for futures.
I do look at trendlines to play sometimes, and use it as a stop on occasion. I don't buy breaks of downtrend lines or breaks of triangle or anything like that. Usually they don't occur at a level I'd need them to be at (VAL/H...).
There's my 2 cents for what it's worth...not even 2 cents ?
-
yea, same here.
-
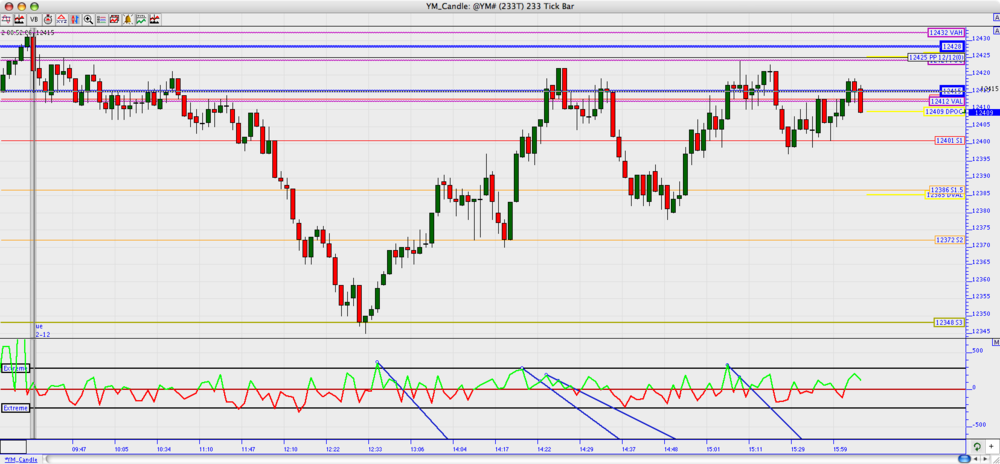
What I'm seeing here is that 580 level...does NOT want to crack it. NQ's are cracking, ER is starting to crack...I'd be cautious on the long side right now. We're sitting pretty well in value of the last week, with the exception of Tuesday. We have a naked POC from that day at 508, which also is the low of the 15th.
Levels to pay attention to:
580
535
510-500
We've also got VAH at 570 as well as R1. This will be a tough nut to crack with those pivots converging there. VAL is at the pivot point. 20 point value range...sitting at VAL currently...could be an interesting day.
-
Hi Steve, and welcome aboard! Sounds like you've got some great experience that I'm sure lots of traders here will be glad to take advantage of
Look forward to it!
Chris
-
Smaller IB's I'd look to play a breakout, if that was a play I really concentrated on. I thought it was going to be a good play, but it's seeming to be a pretty weak play. What I would look for, though...is when the IB is small, to know something's coming. For instance, Thursday the 14th...I'm sure you remember that day. We both had great trades. Notice the IB that day. TEENIE! Also, on the 12th, we had a KILLER trading day (see pic attached) and again, small IB. I think that while noting a small IB would be good for telling if it's going to be a nice breakout trading day is a nice idea, I don't think I'm quite yet sold on playing the breakout.
-
HAHA!! Many a Nicholas Cage movie have made me laugh my ass off. He's so peculiar in his style, that it's hard to take him seriously sometimes...
-
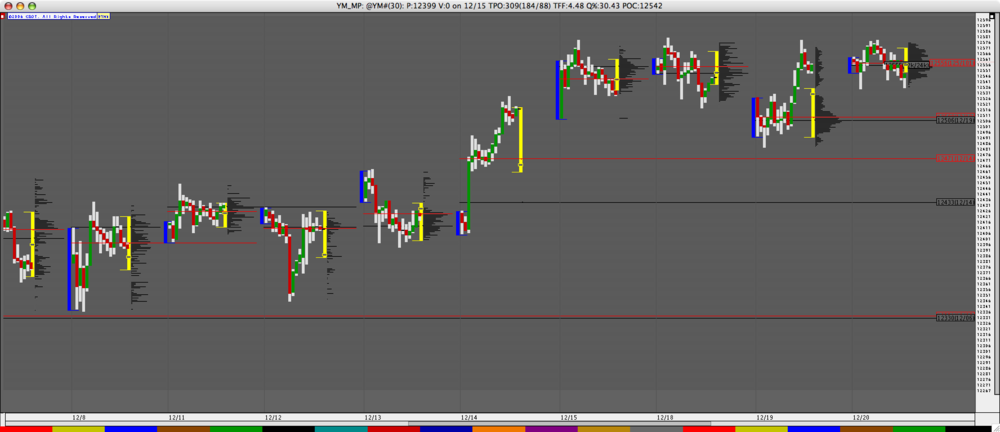
From what I've noticed, a big IB is giving a nice bell curve (pretty rangey) day. Here's a screenshot over the past few days, and the IB is in blue. My IB lasts from 8:30 to 9:30, and is just where I've seen some decent patterns setup. With a range of about 20 points between that time, we're headed for a nice steep breakout in the morning, most of the time. With a range above that, it should be a fairly balanced day...most of the time.
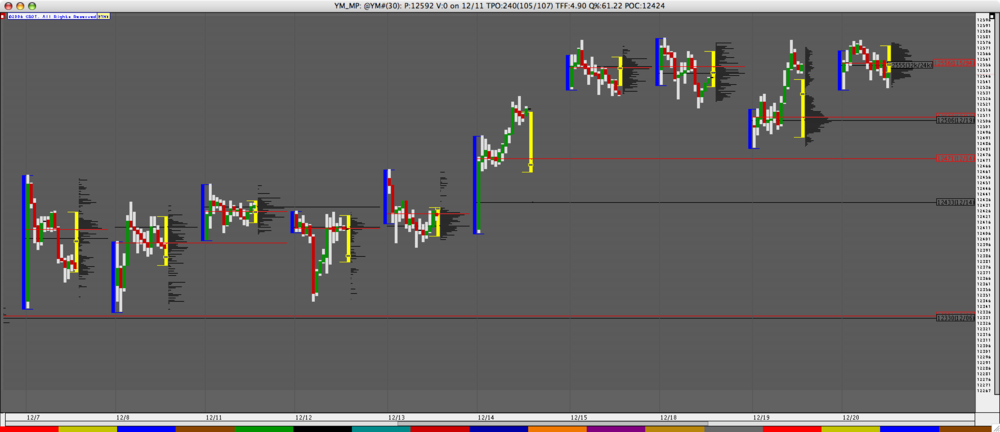
What I've done in this profile chart is break out the profiles, and each half hour is shown as kind of a candlestick. You can see where price went after it broke the IB that I have set. In fact...I'll have the first one showing IB of 8:30-9:30, and the 2nd from 9:30 to 10:30.
Hope the charts help!
-
Correct me if I'm wrong, but isn't this one of TradeStations strong suits?
-
Reaver,Out of all the MP books and courses out there, Mind over Markets is the best and the least expensive at 20 bucks. I've re-read it over 5-7 times and gain more insight each time, seriously. That's probably all you need, but it helps to hear other perspectives as well. I'm looking forward to his next book too.
What's his next book?
-
Also...are you getting them as .asf files? I dont get them as real media files. That could be the big issue if that's the case.
-
They must just not be mac friendly. I can't get any of those videos to open up in Real.
-
do we really have to enter our address and all for every single video we want to watch? wow...intense. Also...it doesn't seem to be very Mac friendly...I can't get any of these videos to load. Ever had that issue with them before?
-
Very nice. Trading is simple...but not easy.
-
HAHA! Here's a picture of it...the first public unveiling of my Mac Tradestation!!

-
Very interesting...will do!
Thanks James
-
You most certainly can! with Parallels Desktop for Mac you can boot inside of windows. It's not a simulator, but a box within a box.
-
I've never used a PC and wouldn't ever care to. Too complicated when compared to my trusty macs. I've got an Intel Core2Duo in my Mac as well
2.16GHz, with 1gb RAM. It's a really sweet machine, just people are slow to jump on the bandwagon with trading software. -
I've gotten almost 70 trades in on the YM since I started tradeing it last month, and I'm almost starting to understand a couple of things!
For me, I'm wanting to have at least 150 trades under my belt with a nice win/loss ratio before I start thinking about adding more contracts. I'm by no means comfortable yet...though getting there. -
And since I love this forum so much, I'll let off my steam here
HAHA!!So...as you guys know who were in the room this morning, my pivots were a bit different. My MP pivots are how I like them, but the pivot points (PP, S1 and so on) weren't the same. Well...evidently every morning after my session starts, I need to download the daily data for the YM, at least 10 days worth, and click "apply" on my prefs window for that indicator. Holy moly!!!! You know...it would've made so much more sense this morning with some trades had this been working....ARG!!!!! I swear, people don't put in the time needed to develope good Mac software for trading. Whats the deal with that?!
Anywho...if you feel you need to vent about bogus software issues, now's the time
-
Certainly is an interesting concept! Wish I knew that before going into a couple trades today....You say that usually when the HOD and LOD are within 10-20 points of value they usually do this?
-
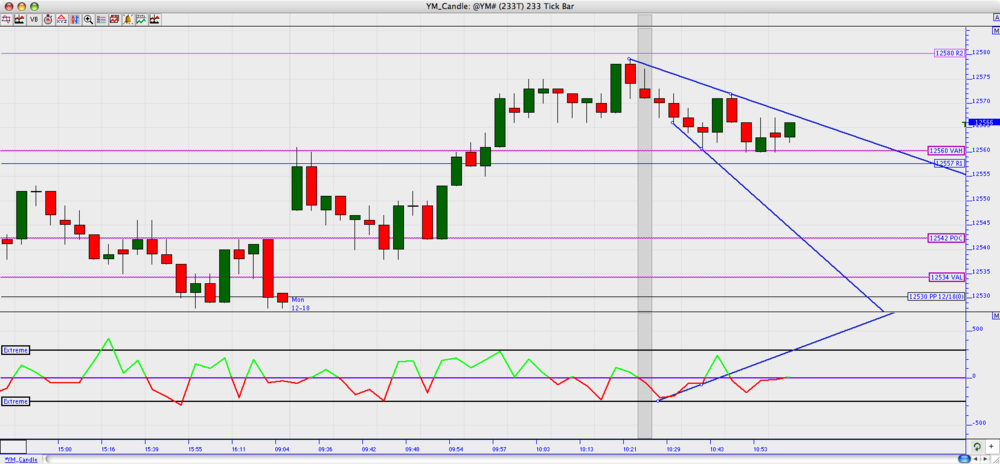
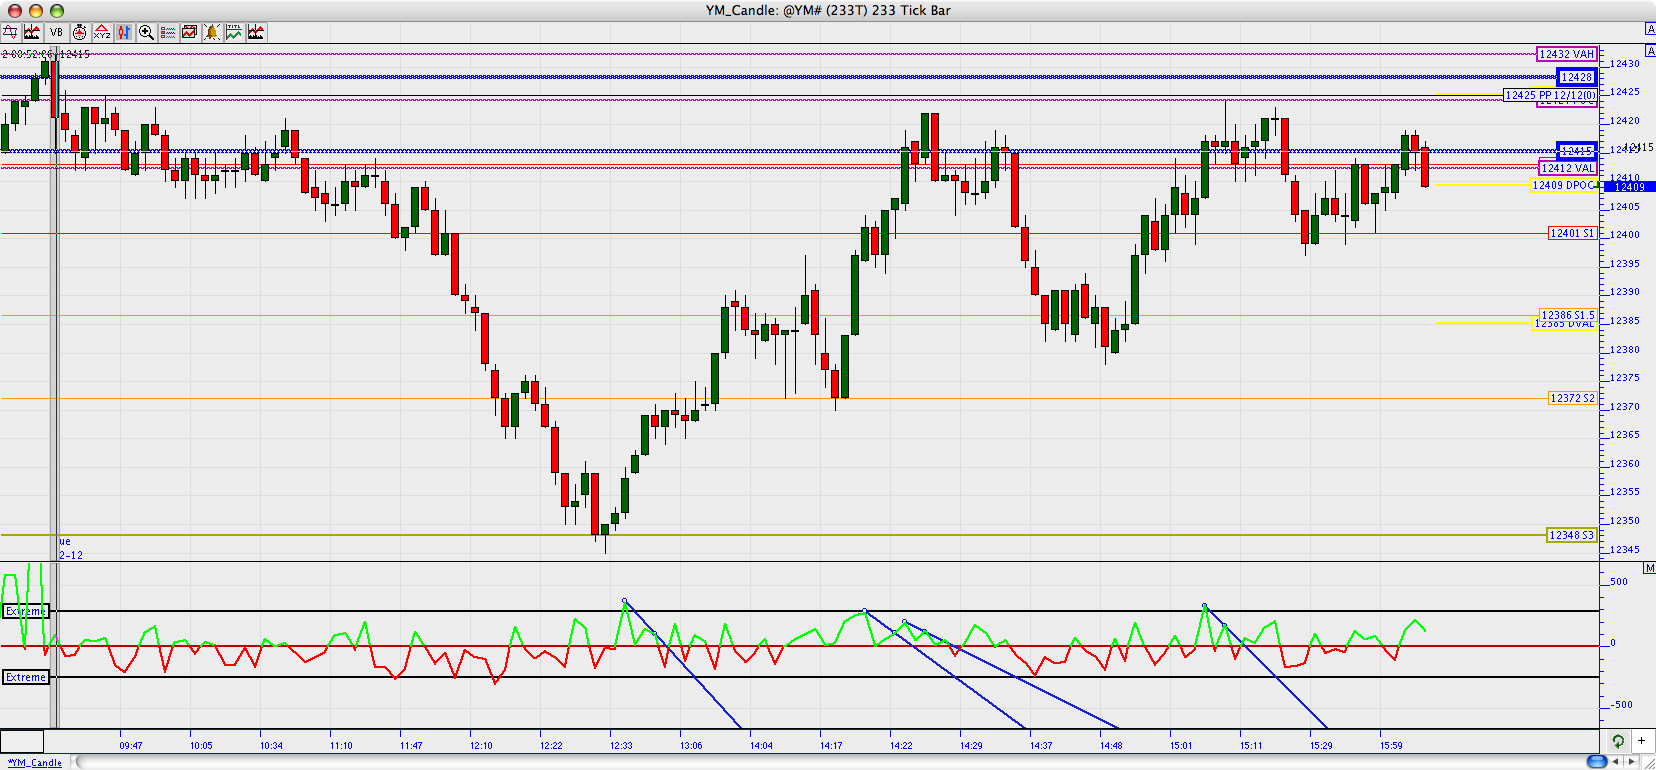
and the YM for today so far...nice move from POC


Happy Holidays and Prosperous 2007!!!!
in Market News & Analysis
Posted
Thanks Merry Christmakwanzanakah to all!!!!