
Welcome to the new Traders Laboratory! Please bear with us as we finish the migration over the next few days. If you find any issues, want to leave feedback, get in touch with us, or offer suggestions please post to the Support forum here.

TinGull
-
Content Count
1444 -
Joined
-
Last visited
Posts posted by TinGull
-
-
Anytime. It's the most intense MP charting that I've ever come across. Any Q's just let me know. Also...if you do go with them, be sure to tell them that Chris Roberts sent ya!

-
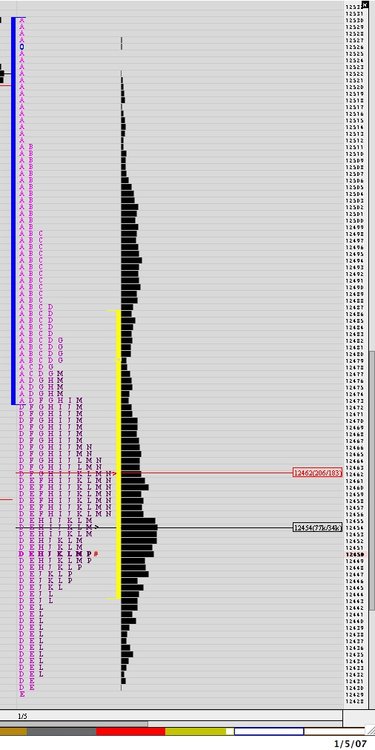
Also to note...TPO count for today was 205/183. Favoring sellers again.
-
Today's action was kind of slow, then mediocre...then slow....
Looking at the profile and its auction rotations, what can we see? At first glance, we have a "b" shaped profile. Long liquidations you may ask? Well...could be. BUT, notice the A, B and C periods...we drove down sharply from the open, never to return, and churned a bit until the D period came. At that point, the lows of A/B/C were taken out, and even E took out the low of D. This was some new short blood in the market today! Longer time frame investors are driving prices lower.
Also, looking at a daily chart of the YM you can see that yesterdays little pullback was on lighter volume than the two down days surrounding it.
So...Where do we go? Market's will go where they want, but knowing the other time frame investor is not seeing the value in the market at the highs it's been at, we can start to think we may be in for some more selling next week.
Happy trading!
-
And coming into the end of the day...triple digit losses. "b" shaped profile telling us the other time frame sellers are in force, and lower value placement...all showing us that a nice move is getting underway. This week was pretty heavy, so I wouldn't be suprised to see some short coverings next week as people lock in some short sided gains.
As for now...may the power of the profile be with you!

-
Premarket....interesting to note where the YM found resistance....right below 540. Ah...powerful tools that are ages old. I love it.
-
Also...if the news kicks the market down more...I'll look for initiating a short around 490ish, VAL from yesterday. Today's definitely a shorting day it's feeling like.
-
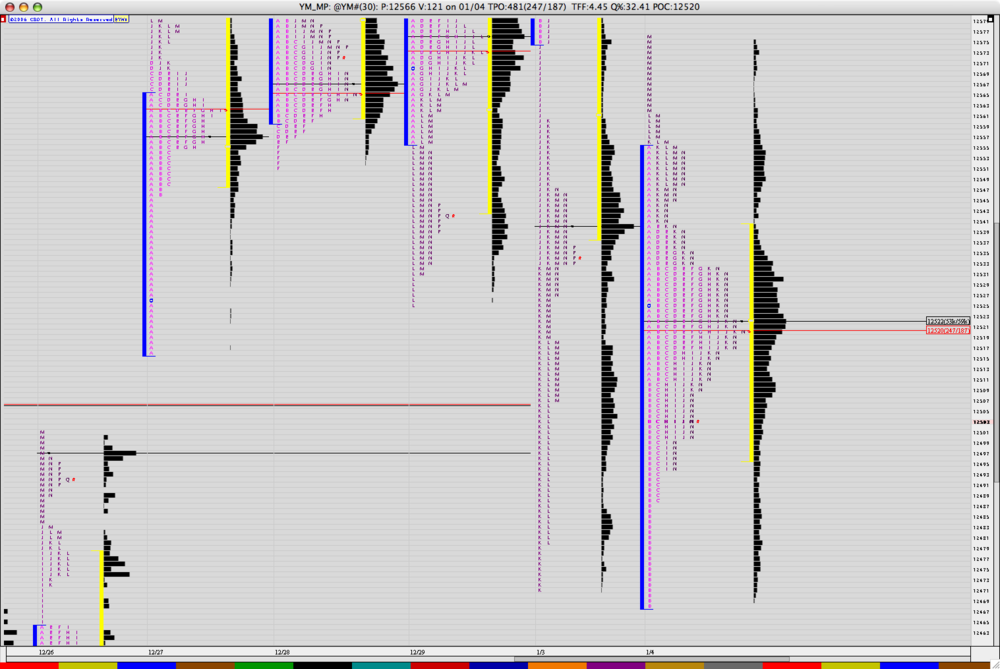
Where are we heading? Here are my thoughts
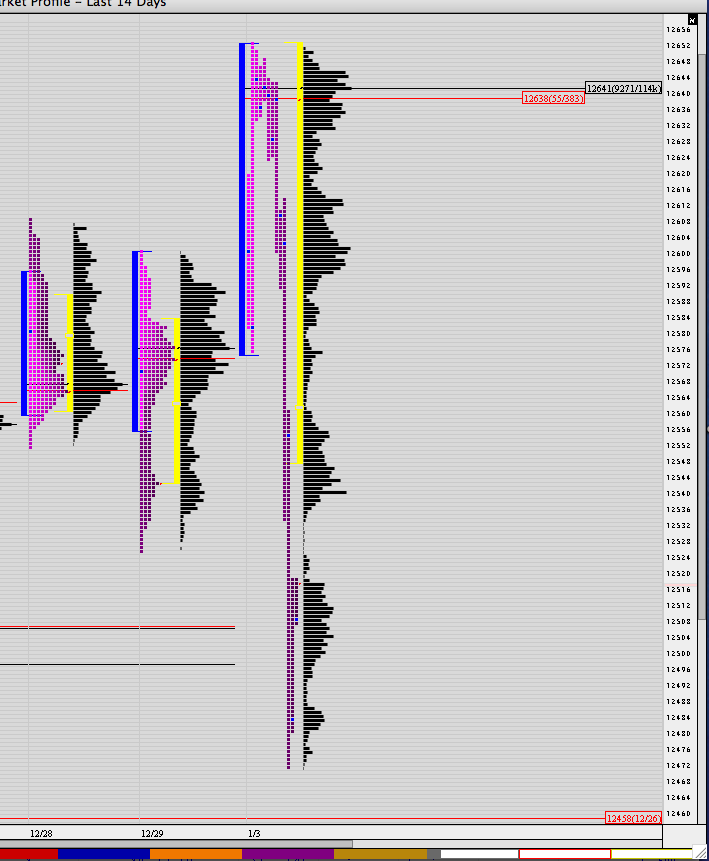
Yesterday we saw a fairly balanced day with strong selling in the morning, nice buying later on, and a small selloff in the close. Was the buying responsive buying, or simply some short covering? On the chart, it's a little difficult to tell. We'll see how things act today. Looking at premarket...seems like some short covering, as we're really heading lower right now.
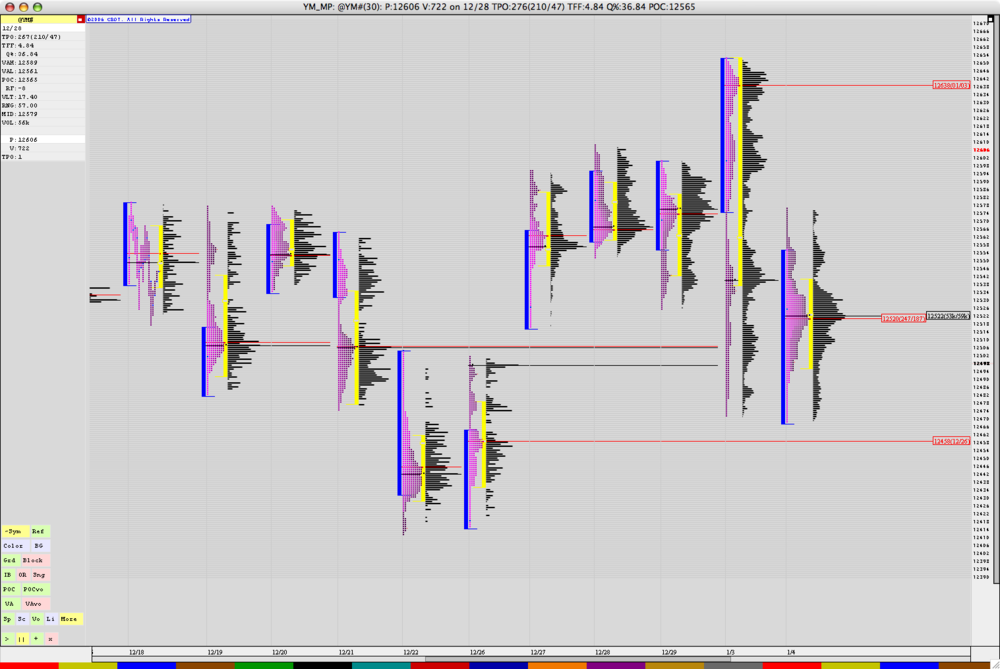
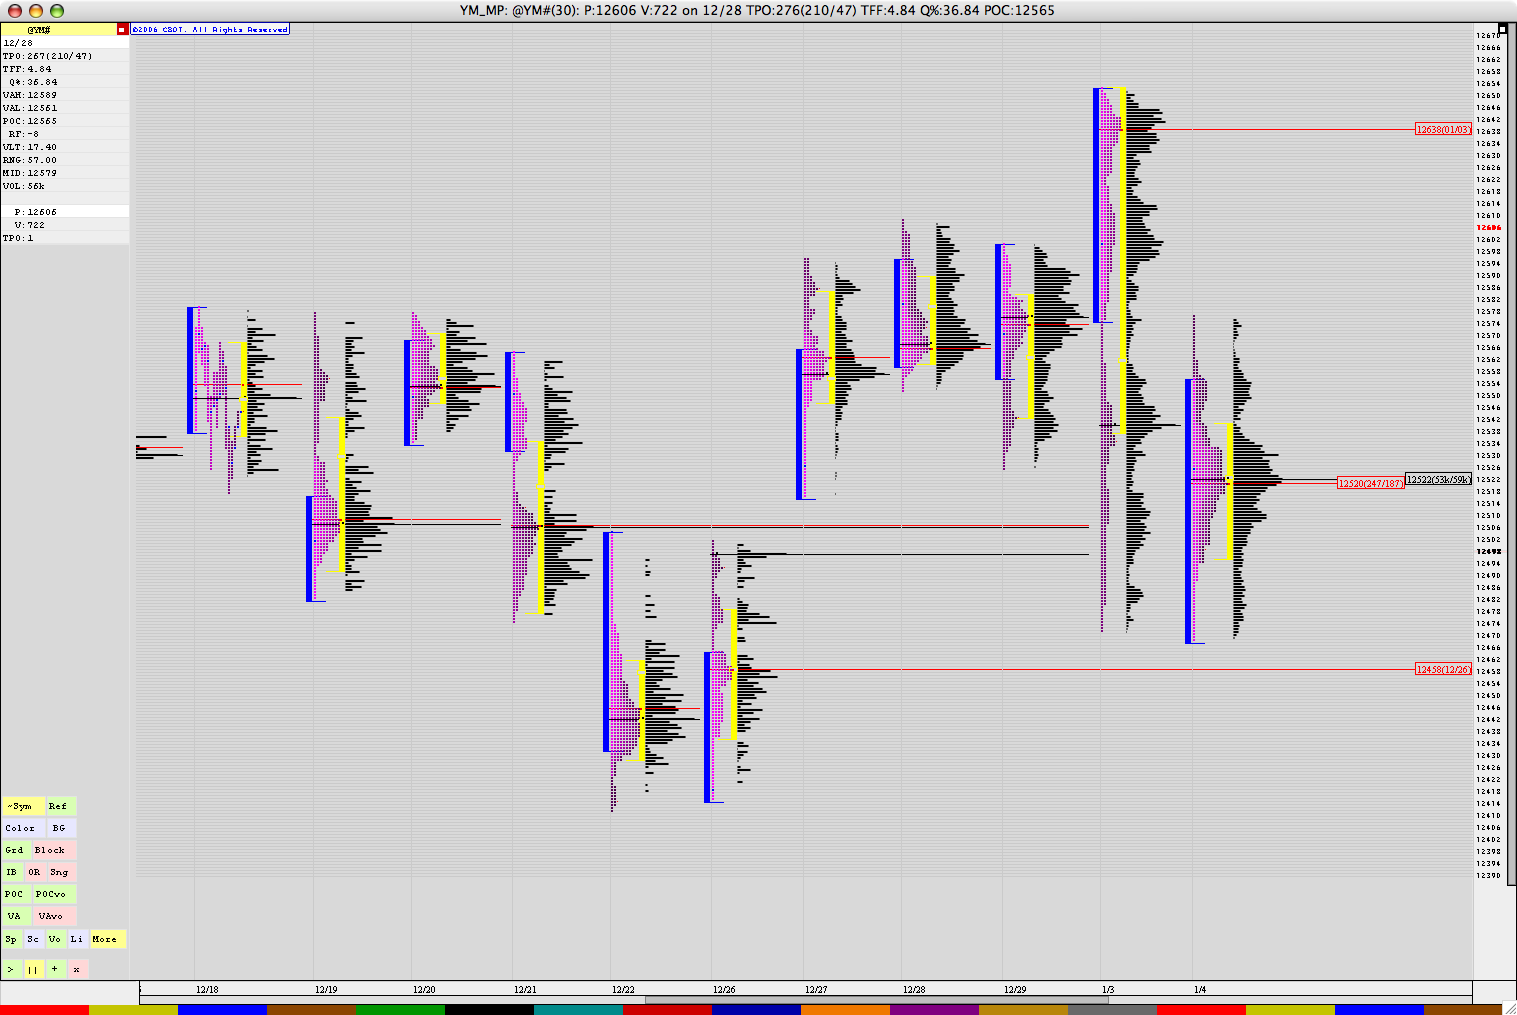
What areas to trade? Notice the 540 area. VAH from yesterday, VAL from 1/3 and 12/29 (at around 543). This will be a tough nut to crack. We're currently printing below the POC, with a TPO count from yesterday at 247/287, strongly favoring the sellers. Looking at the TPO count into the close is usually a good indication of where tomorrow is going to lead. For instance, on 12/27 we had a big TPO count favoring the sellers...and then the 29th and 2nd of Jan started our journey downwards. With that in mind, you knew where to look for trades. Yesterday really favored the sellers, and it's very evident pre-market.
Another area to watch for...471. This area was the LOD yesterday and on the 3rd. Next stop...458. Naked POC from 12/26. Then there's a big area of congestion at 430-440.
So...overall...I'm looking to initiate shorts at 530ish, and be ready to cover around 471, possibly lower.
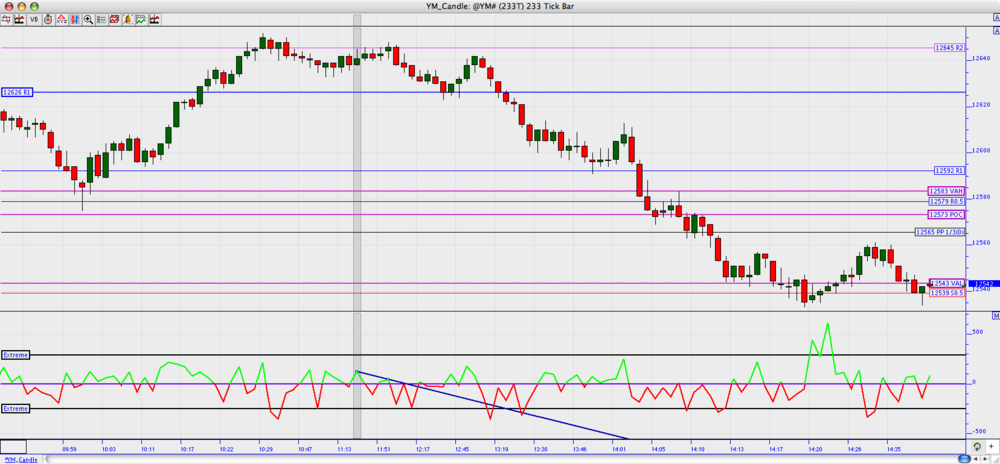
Here's a chart for candy.
-
Welcome Buk!
-
The most common times when I identified my intuition kicking in is on losing trades. A good amount of times, I tend to exit early on losing trades before the markets stop me out. I find it very hard to explain why I decided to exit early besides "I felt I was wrong". 90% of the time, exiting early was the right choice.
I feel the same about this. My heart starts pounding, my throat kind of clenches up and I just know it's not a good situation. I'm not good at feeling the good trades, though. Just knowing a bad one that I got into for sometimes a wrong reason, without thinking of it before hand. That's when I'll gladly take -1 or -2 and be happy it didn't turn worse.
-
Thanks Soul. We'll see about the expert thing. HA! It's definitely something that I'm going to make a huge part of my trading life.
-
Not sure if this has been covered, but I think it's a really great thing. I was able to tell today when the top was in place before it happened. My long trade on the YM exited at 45 as I felt 50 would be a top. How did I estimate this?
Since we opened up inside the range of last Friday, but outside of value, you can begin to superimpose Fridays range on today, and a good part of the time be pretty darn close to the range of the current day that hasn't played out yet.
Friday we had a range of about 75 points. From 525 to 600. We opened today at 600 and as the Initial Balance was being played out, you could superimpose the range of 75 points. We opened up the B period at 580, auctioned 5 points lower to be rejected. Price wasn't gonna go there. At that point, I figured we'd see a top about 75 points above 575, which would be 650. Our top for the day...652.
Today is a HUGE range and the biggest I've seen in some time. Out value area one of the widest as well in a long time. If we were to open inside of the range but outside of value tomorrow...I wouldn't necessarily expect a range similar to today. This is an anomaly from my viewpoint.

-
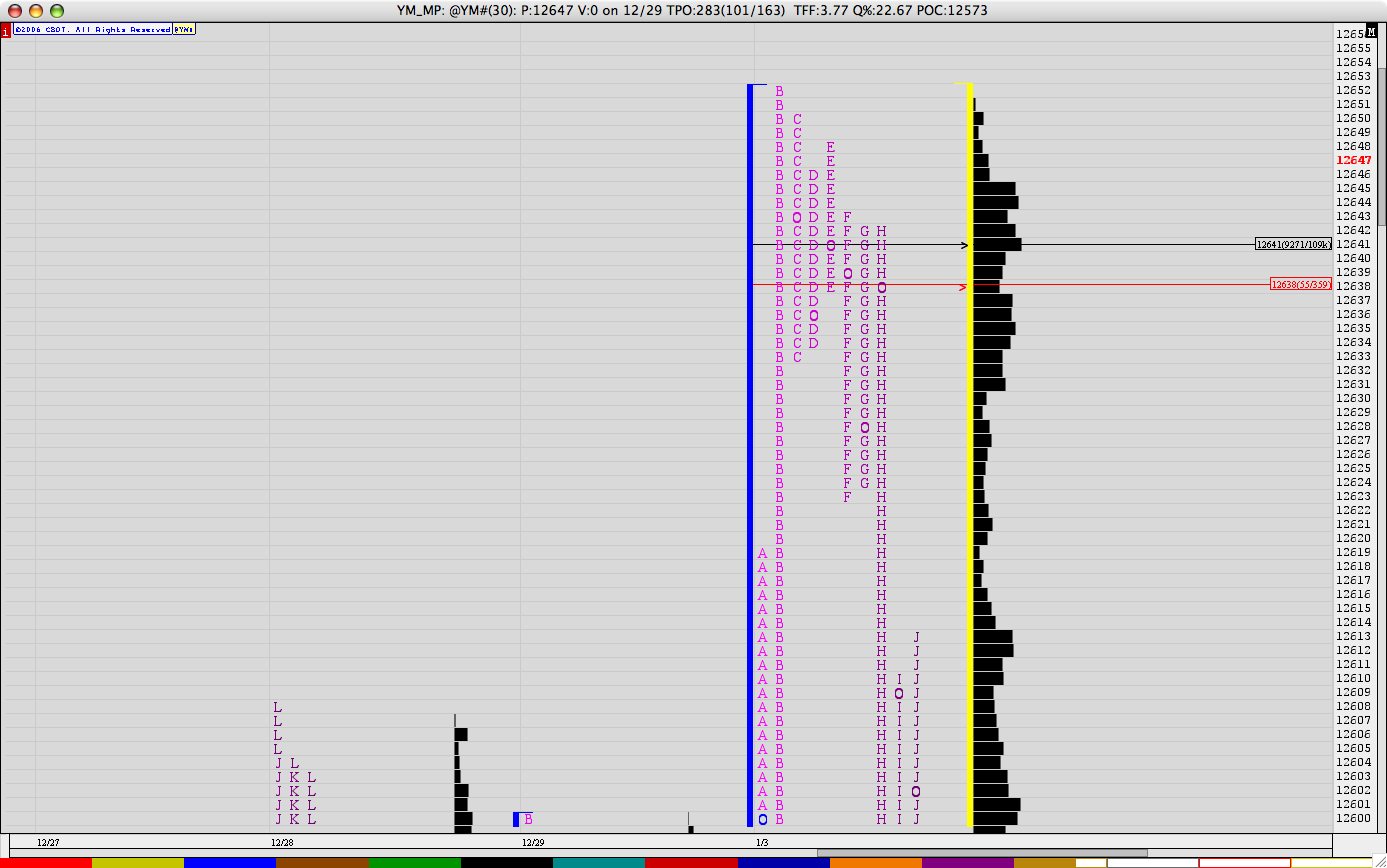
Today was an absolutely perfect day in all respects. Had nice up moves that were signaled, and a HUGE down move that was signaled loud and clear by the MP structure. In this screenshot of the YM notice how the C period couldn't overtake the B period for an upper range extension. Then...the D period couldn't take over the C period. This makes it evident that longer term sellers are getting their footing in the markets. E period would've been a great place to get in, while on the charts we had a lower high forming right under R2. Gave a nice entry point.
When you see things starting to form like this, its great knowledge to have. Like looking inside the Matrix. Auction periods not being able to overtake the previous period is definitely something to watch for.

-
Cool. Thought it might be. Good to see that sort of stuff being brought to the masses, though.
-
Soul, was blood diamond more of a screen play or documentary kind of thing?
-
InvestorR/T is awesome...
Their MP charting is really wonderful. -
The things he puts forward are certainly things covered by both of those guys, torero, but Brett seems to put things into different ways of thinking. Tough to explain for me...but if you read a little bit of Psychology of Trading, you'll know exactly what I'm trying to say
-
YAY! Happy happy
-
Because relying on someone else is dangerous. You must learn about the markets yourself to make your own decisions. No one..and I mean NO one can tell the future. It's an absolutely ridiculous thing to think otherwise. Reliance on another person is a surefire way to lose in the long run. I'm with Soul...give me a few bucks and I'll tell you how to invest your money.
Please, learn the dynamics of the markets if you want to put your money into this sort of investment vehicle. You never will know if this guy is being honest or is wanting to push the crowd in a direction to take the opposite side of your trade.
My 2 cents...
-
Brett says amazing things in ways one wouldn't normally think. This article, along with his book Psychology of Trading, are amazing. He really and truly "gets" trading. Amazing stuff.
-
Hey Ant,
I just use IRT with Market Profile...I don't use Market Delta with it. I use dtniq for my feed, and all together it's around 130 a month I think.
-
Hey Nick,
At the bottom I'm plotting the delta of the bid/ask. So when there's more selling, the line is red, and vice versa. Helps me see if buying or selling is decreasing coming into the pivot points that I use. Also, I'm using InvestorR/T from linnsoft.com.
Hope that helps!
Chris
-
Just because he doesn't think it's a good way to make money doesn't mean he doesn't know what he's talking about. Maybe it's just not a good fit for him. When someone finds something that works for them, it's good that they stick with it. If scalping works great for you...awesome. More power to you. Just please don't go saying it's the only way to make money, because it's not.
-
Peter never mentions that he scalps, he actually says he's not a scalper and doesn't like to trade in that manner. I'd ask you to listen to what he's got to say on his radio show (shadowtrader) before making assumptions that he never made a dime. Those kinds of comments just aren't constructive, and not really appreciated either.
-
And the correct segmentation would be.....???


Today's action...where might it lead?
in Market Profile
Posted
I'm with you on that assumption Looking forward to next week!!