
Welcome to the new Traders Laboratory! Please bear with us as we finish the migration over the next few days. If you find any issues, want to leave feedback, get in touch with us, or offer suggestions please post to the Support forum here.

TinGull
-
Content Count
1444 -
Joined
-
Last visited
Posts posted by TinGull
-
-
Was it just Genentechs earnings that blasted the YM through the roof?
-
It's been quite a journey from a startup forum of 1 member (me, myself, and I) to having over 1100 members in approximately 5-6 months.Isn't that 3 members?
 I love the site. I dont know that a blogging setup would be something I would want, as I've got my own that I use. I think the site is great as it is, personally. Some things like TL Groups I dont know if they need to stay. I don't see them getting any use, and maybe that spot could get used up by an economic calendar.
 -
Welcome
 Hope it helps.
 -
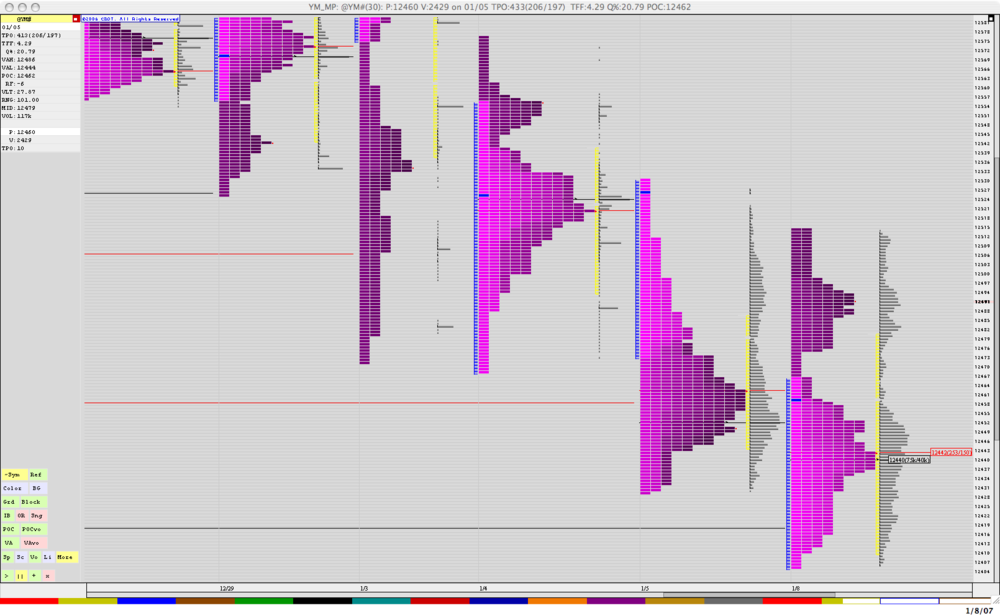
Yesterday in the chat room someone had asked what might happen tomorrow (being today now). TPO counts shows sellers in favor of the win. Sure enough...now the YM is printing 44 below its close.
When more TPO's reside above the point of control we have the sellers in force driving price back down from the top.
The profile from yesterday is interesting because value took place almost completely under the Initial Balance. Same thing happened on 12/21 adn what happened then? The YM closed at 12512 on the 21st and opened up about 20 points lower to never see that opening price again and closed nearly 100 points lower. Interesting to see that. IF we were to open inside of value...what kind of range could be expected? Well...I'd say no matter what we could potentially see a 100+ point range day, but looking to be right around 100. !0 day ATR is showing just over 100.
How could you play it to capture a good part of the range? Let's see where the most likely candidates are, shall we?
When we have the first period (A period on my charts) setting the tone, we want to see what the B period will do. This consists of the Initial Balance. Notice that in the B period, we auctioned lower by a touch, but mostly ranged about 10 points either side of the open of that period. Then..we see C period open higher, but get rejected above B. This is an imbalance. A good trade location was right around that 510-513 area, which was also a weekly pivot and the previous days high. We see that from there, we auction much lower to the low of 440ish, which was the POC from the day prior.

Noticing these kinds of imbalances quickly helps you get great trade location.
Going to the upside...you see that E and F periods stalled at 438, both periods. When you see this type of ledge forming, and then the FAST rejection in the G period, we're heading up. If you placed your order at the POC, 442, you could place your stop around 434 and know if you got stopped, balance is being found in that area.

Points to watch for:
Resistance:
496
532
513
Support:
405 is a key level, big buyers sitting there
-
Hi there,
Just curious as to those of you in the US who trade futures ONLY do your taxes by yourself or have someone else do them? And...how much does it usually cost to have someone do them for you? I've only been trading as a business since September and have maybe 60 trades to account for under that. Is it worth having someone else do it so it doesnt get messed up?
Thanks all!
Chris
-
Welcome to the team, Brett! Are you currently trading anything else? When did you decide to get into eMini trading?
Look forward to talking with ya!
chris
-
No prob. If you were just going to do index futures or gold/silver futs, then I'd say thinkorswim is awesome for that. I used to set up trades like that all the time.
-
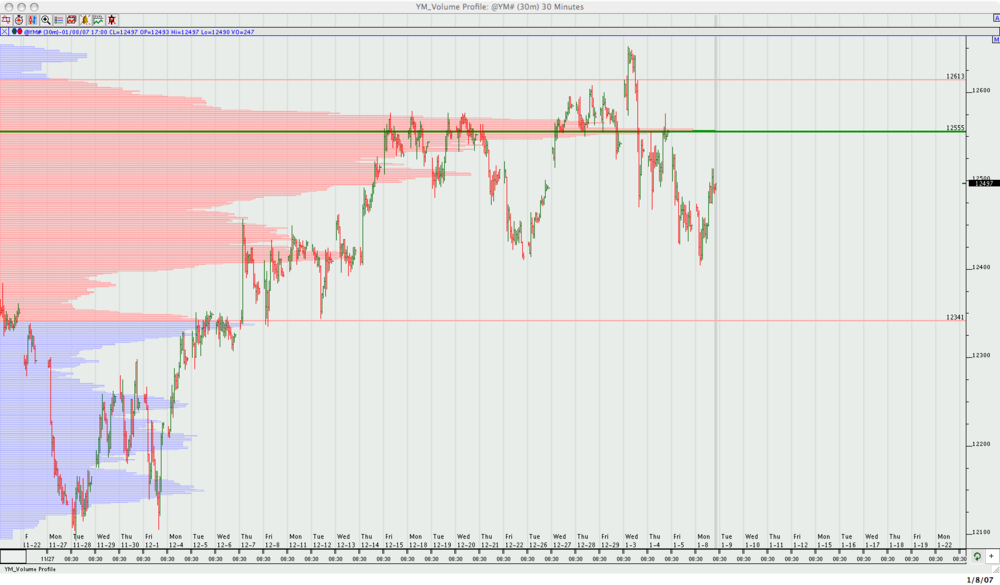
555 is POC for last 30 days of a profile. Lots and lots of volume at that area. The red area is the value area for the past 30 days.
Was pretty choppy today. Looking forward to tomorrow!
-
So basically having 2 "1st triggers other" orders, right? Bracketing the trade and having one trigger at the breakout, triggering a stop order to go into working...but have 2 of those. What contracts are you looking to swing on?
-
Crazy day today. Was aware of downside potential from the TPO count of Fridays profile, and today the sellers outnumbered the buyers 252/150. We had to distributions and a very wide value area for tomorrows trading.
A 110 point range was called for by superimposing Fridays range of 102 points onto todays trading as we opened up right inside of value.
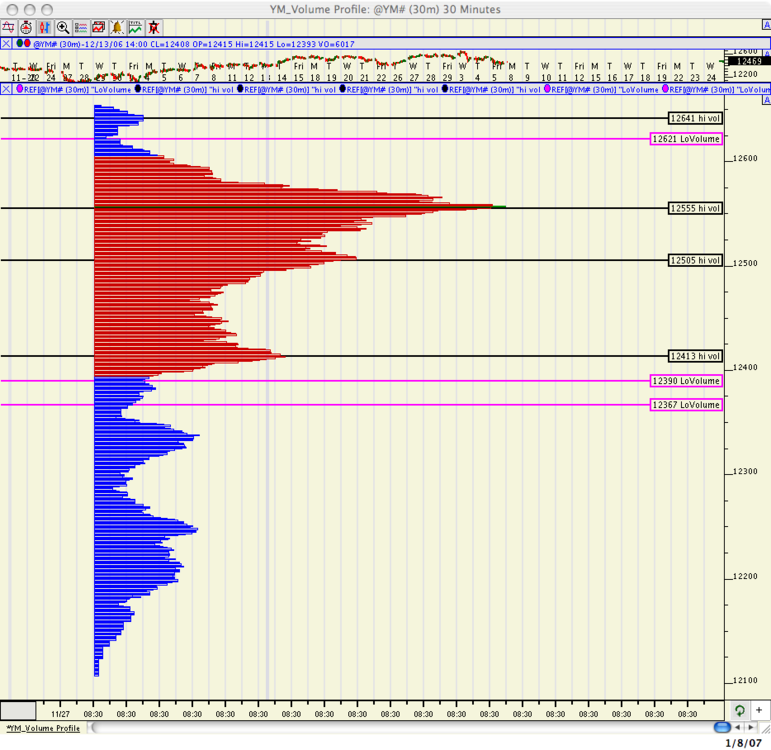
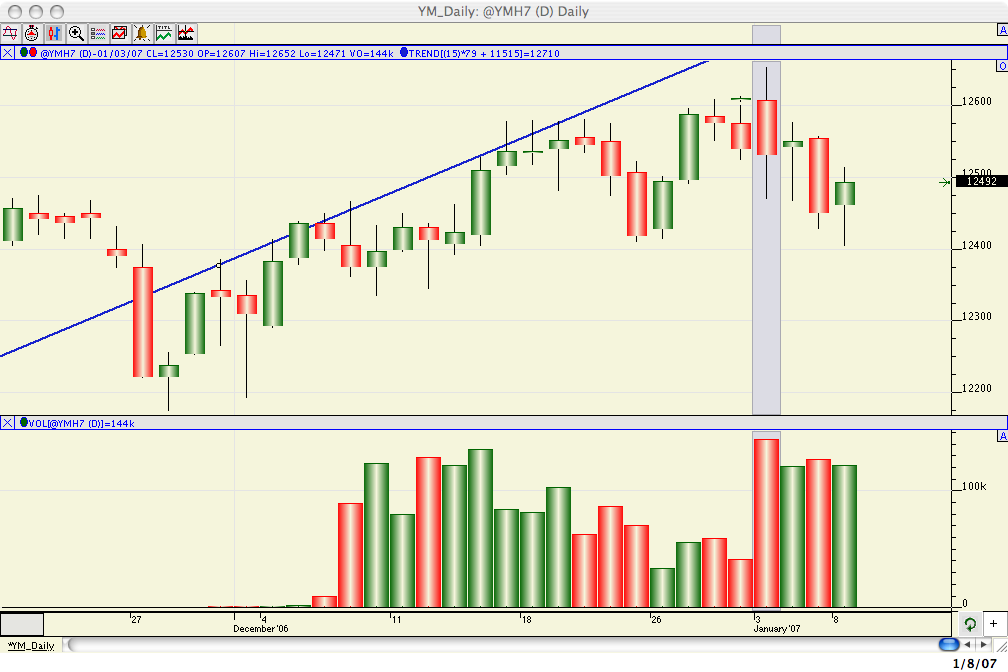
What might we expect for tomorrow? Looking at a daily chart of the YM you can notice that volume today as well as volume last thursday were lighter than the 2 big down days we had. With today being a fairly balanced day overall, but sellers way outnumbering buyers...we may look for some more downward to sideways action. The wide value area (71 points big) will give the YM some space to churn if it wants to. We closed outside of it, so we'll see what tomorrow brings.
I've added the past 3 profiles to see what has been happening, as well as a daily chart of YM. Tomorrows action depends on how we open. If we open above VAH...I'd look to buy a pullback to it around 480. We may see a short term relief bounce soon.

-
Bam. MP led the way again. Having some more selling take place this morning, and by the looks of it, we'll keep around here or head a bit lower. Possible to the 375ish area based on recent range activity.
-
Also to note...413 is showing a high volume node over the past month. Another reason to watch that price. 505 and 555 all could give some possible turning points.
-
Wow...thats an intense cluster if I do say so
-
Soul, you mean making the high and the low for the day in the first 60 minutes?
-
Support could also come in around 410-415, too. Lows from 12/22 and 12/26. They might coincide with 400...I'll be careful to not wait for the 400 area in case something pops up....for support.
Funny how we're right at 471, and couldn't shake that overnight either. This is a very key number to watch. In a lot of peoples minds recently.
-
Thanks Ant!!!
-
Also, Ant...do you subscribe to alexandertradings newsletter? Just notice the wicked similarities between this post and the newsletter....
Also...maybe you could tell me what KRA stands for? THANKS! -
Welcome to TL!
I know thinkorswim.com gives you the trading platform, reasonable charts and indicators, demo account...but they don't have a backtesting setup. As for something that's free that will give you backtesting.......I'm lost on an answer unfortunately. I know TradeStation is like the king in backtesting and coding worlds. I personally use InvestorR/T from linnsoft.com and love them, but they aren't a brokerage. Just charting with custom indicator possibilities as well as backtesting performance of trading systems.
And for YM, you've come to no better place than TL! Lots of YM traders and the founder, SoulTrader, is one of the best YM traders around
Welcome!
-
Chris, I basically try to enter a trade near a key reference area identified by Market Profile when market internals are weakening - nothing new here. I just try to enter a trade in the first 60 mins any chance I get because of the risk/reward. That's why I think that the first 60 mins of trading is perhaps the most important. I also use the IB range and potential day type for determining whether a high or low is being set in the IB period. For example, the extreme of a wide IB range usually holds, a narrow IB range may turn into a trend day, etc. With respect to day type, a Normal Variation day tends to have range extension that doubles the IB range - stuff like that, but those are really details. The key point is to try to enter a trade, based on your trading strategy, around the first hour or so to catch most of the daily range about 70% of the time. At least, that's the goal... The chart below is my attempt last Thursday, 1/4, but I royally messed up the exit, but I won't get into details here.
  Did I answer you question?
Thanks Ant...yes, you answered it.
I was thinking you were doing something else...it all makes sense from MoM. Thanks again~!
-
Very very interesting stuff Ant!! Thanks so much for sharing. So...when you're trying to guage the top using the 10 day ATR, how are you coming to the price where you think the top will be?
Chris
-
Nice work rwalkerx! Love to see you in the chatroom in the mornings when we trade. Most trade the YM...but there are a couple who brave that tornado that is ER2
-
Heck yea it is
-
Excellent. I'm sure you'll love it! Tell Bill Linn I sent ya and they'll treat you good.
-
Thanks ant, and I definitely will be keeping it up
And yes, if we can break through that area...here we come 300! Aren't bearish times more exciting than those bull days of yesteryear?
Thanks for the volume profile, definitely appreciate it!


What happened after market close?
in General Discussion
Posted
Some people wear Superman pajamas. Superman wears Chuck Norris pajamas