
Welcome to the new Traders Laboratory! Please bear with us as we finish the migration over the next few days. If you find any issues, want to leave feedback, get in touch with us, or offer suggestions please post to the Support forum here.

BlueHorseshoe
-
Content Count
1399 -
Joined
-
Last visited
Posts posted by BlueHorseshoe
-
-
....i have to go fishing to get away from the noise...Do you fish with a Joe Ross Hook on the end of your line, Patuca?

BlueHorseshoe
-
Patuca,I use limit orders. There is no slippage with limit orders. However, there is the risk that the market will fly right past you without filling your order; but there is no slippage. I only post the trades I am filled on.
You are welcome to take the course through Joe Ross or try and get some perspective by reading his books. I needed the private sessions since I had no background in trading. But an expert such as yourself might be able to just read the books.
Thank you.
Tony
Hi Handle,
Would it be possible to post two charts for your next entry, one with a five minute chart, and another with your entry price marked on a tick chart with a volume pane beneath?
Many thanks,
BlueHorseshoe
-
Thank you for the concise explanations . I'm taking all these information for consideration and putting them l in my plan .I know this is not the right question to ask, but is what I'm doing using the spx as a filter and all th right thing to trade stocks? I just want to get some insights how professionals do it and retail traders do it while making consistent profit. I just want to now if what I am doing is the right path.
Thanks again.
Cheers !!
Hi Daytrade999,
I have never traded individual stocks (this is a minor lie - I briefly held BP as it began to recover from the deepwater horizon spillage), so I can't provide you with specific advice like this.
The general spirit of what I am trying to do, however, is to encourage you to generate lots of ideas and then methodically test them to see what works.
In principle, the idea of using SPX as a filter for the broader market trend seems sound. But it all depends on what you're doing and what you want to achieve.
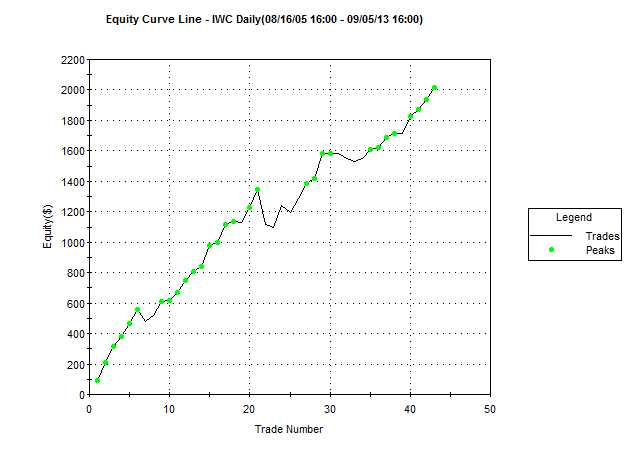
Here is an example . . . I have taken a strategy that buys a pullback in the IWC microcap ETF when IWC is in an uptrend (defined as closing above its 100 period moving average). This is the first equity curve attached below.
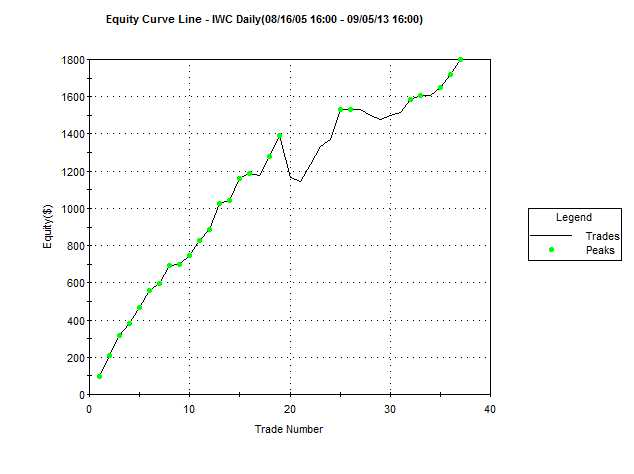
Then I have prescribed that the strategy buys a pullback in the IWC microcap only when both IWC is in an uptrend AND the Spider ETF (broader market) is in an uptrend. This is the second equity curve below.
Applying the overall market trend filter in this instance improved the profit factor from 5.61 to 6.73.
But it is important to realise that this is just one example and should be treated as such.
Hope that helps - go experiment - and do so in an objective and structured fashion!
BlueHorseshoe
-
Consider this: the longer time frame the more variables enter into the picture.. War...news...traders sentiment...fed reserve....hft jolts...algo's..etc.A cursory look to the left will have a high probability of telling you where prices will go in the next five minutes...therefore, why do so many want to make big gains by attempting to play for larger moves? The larger moves, by definition, are harder to "anticipate" (since the word "predict" sends many traders into mental convulsions) thus causing the probability of success to be less. I know one is looking for a bigger RR thinkng higher RR is the key to mega $$$ rolling in to ones account. However, once one gets REALLY GOOD at anticipating 5 minute moves it is entirely possible to have an actual RR of 8:1 or 10:1 and on top of that a high win rate.
Consider this: a trader only has to average a consistent 2 points per day in the ES and simply up the size to 5 lots. In a year he will have made 120,000.00 - 24,000.00 aproxRT commisions assuming 4 trades per day to get the 2 points. In actuality, many days 1 trade will get the 2 points but just saying if it takes up to 4 trades to net 400.00 per day trading 5 lots. Point to be made is several fold.
First, It is easier to anticipate a 1 or 2 point move in the ES over the next 5 to 15 minutes than a 10 to 15 point daily move.
Second, you can mathematically have a very good positive traders equation and a very good RR once you get sharp at predicting 2 point moves on 5 minute chart.
Third, it is achievable to have a very high win rate doing this.
Fourth, many days there will be 4 or 5 or more points gained which will more than make up for losing days.
Now, throw in the NQ together with ES and trading 5 lots and capturing 5 point moves (net) day...add this to the points net on the ES......well you get the picture....
It is easier to make many base hits than home runs in the markets...
Of course, I am at the complete idiot level so you might want to take what i say with a grain of salt. It certainly isn't for everyone but with those so inclined it just might work for them if they can get good at it. Many times the points can be made within 30 minutes of the open....
Just another dipstick viewpoint.....
Hi Patuca,
I disagree with this, although I have respect for the argument you make.
Certainly, if you can predict short term price movements with any accuracy then, to put it simply, you'll have a much smoother ride than any longer term trader. If this weren't the case, then all those HFT firms wouldn't bother.
But is this possible? If not, then the very first premise of your argument is flawed . . .
The more variables that enter into the picture (especially those with high granularity as opposed to major fundamental events like wars), then the more "smoothed" their effect will be. If you look at a weekly chart and there's an uptrend, then this uptrend is the result of opinion in spite of whatever short term fluctuations the influences you list may generate.
The shorter the timeframe, the lower the signal to noise ratio.
For me, this has a clear consequence: you can trade against short term noise in favour of the long term trend.
Example: long term uptrend but news (it's just noise) causes a three day sell-off = buy.
Example: long term downtrend but war (it's just noise) causes a brief rally = short.
Trade the trend, and fade the noise for great entries!
As soon as you move to intraday the difficulty is that the trend (?) is just the noise from the higher timeframes. I imagine there is some sophisticated way to assemble all this (some incredibly complex fractal hedging in multiple timeframes?), but I have stopped looking for it - end of day works well enough.
The point should also be made (so I'll make it!) that I may just be cynical because shorter term trading isn't something I myself have had any success with.
Finally, a R:R of 1:1 is fine if you have a high win rate.
BlueHorseshoe
-
Wow thank you to the part on correlations .
In its simplest form, the idea would be something like:
1) Overall market trend SPX is up.
2) Stock A gives a signal for long entry.
3) Stock B gives a signal for long entry.
4) You decide that a position in Stock A is a better option than a position in Stock B because you know that A is more closely correlated with SPX than B. If SPX continues to rise then A is more likely to follow it than B, which often behaves contrary to SPX.
I like to focus on small caps but I'm not sure if the spx is the right one or should I use the Russell ?
I can't answer that for you. You will need to find a methodical way to test various possibilities. For smallcaps, you've always got IWC - but is this really a useful filter, as it can't really be considered to represent the broader market?
If you can provide me with a way to learn more about the counter trend trade part in the above paragraph I would be really grateful for that.
It's really just extending your own idea of using the SPX as a trend filter. If the broader market is trending up, and so is the sector , and so is the stock in that sector that you want to buy, then a good time to buy the stock is often following a brief sell-off. The sell-off is counter to the broad market trend, the sector trend, and the stock's own trend - there is therefore generally a higher probability that the stock's counter trend reaction will be short-lived, and the prior uptrend will resume.
This is known as "buying a pullback" (and can work in reverse, shorting brief rallies in falling markets).
It is entirely plausible that any stock will have 3 consecutive down days without there being any real significance attached to this. It is less plausible that a stock will have 6 consecutive down days unless there is some serious weakness.
Now, suppose a stock is trending up, and you decide to buy it. You decide you will exit for a loss if the stock suffers 3 consecutive down days.
The stock sells off for 3 consecutive days, and you now take a loss . . .
I also want to buy the stock (its long term trend is up), but I have waited until it has suffered 3 consecutive down days. I now enter long, and like you I decide to exit if the stock suffers 3 consecutive down days.
The stock sells off for a further 3 days, and I exit for a loss.
Can you see the difference? At the point you exited, there may have been no real weakness in the stock (3 consecutive down days are fairly inconsequential); by the point that I exited, the stock had suffered 6 consecutive down days, suggesting more significant weakness.
If the stock rallied after your exit, you may rightly have thought that you merely got stopped out by a normal adverse excursion or "market noise". If the market rallied after my exit, I would be less likely to feel so - 6 consecutive down days seem like something other than just noise, whatever happens subsequently.
This is only one approach, with simplified and imaginary examples, however, and you shouldn't allow other people's thinking to overly influence your own methods . . .
If I am wrong in my timeframe selection please correct me.
You cannot be wrong on your timeframe selection - this is something for you to decide.
Best wishes,
BlueHorseshoe
-
Hi Daytrade999,
It's good to see that you're getting lots of useful advice and ideas from the thread, and I hope it's helping you to make some progress.
I think the idea of looking at the broader market direction is a useful one. Do you look at how closely allied the behaviour of a stock and the S&P is? There are several measures you could use for this, correlation probably being to simplest. Is the S&P the best representation of the broader market? What about an ETF like VTI, which is all US stocks? If you're putting on numerous positions each day in individual stocks, are you hedging against market shocks?
Try out lots of ideas. For example, what happens when you trade counter-trend in a stock that is trader counter to the direction of the sector and broader market? What about if the stock is trading short term counter to it's own longer term trend? What happens if the sector trades counter to both the broader market trend and it's own long term trend - which stocks in the sector are the best to trade - those that lead or lag?
Learning how to do all of this with a computer (rather than by hand) is by far the quickest approach in the long run.
Also, instead of allowing suggestions like mine or anyone else's to influence you decision to trade or not to trade, another option is just to stick with much simpler criteria for that decision, and then allow all these filters to influence the size of the position.
As for what happens next in terms of your employment/education, then there is a simple solution - trade end-of-day only and get on with the rest of your life for the rest of the time.
Kind regards.
BlueHorseshoe
-
Please anyone can you give me some help ?Hello,
Stop trading. Unless the world ends, everything will be there for you to return to when you're ready, whether that's in a week or in a decade . . . there are more productive and less frustrating ways to make progress than to continue as you are. Plus you can't lose money if you're not trading.
You are trading "in the dark", by which I mean you don't seem to have any clear idea of the validity of your strategy. Maybe what you're doing is great, and your approach is merely going through a drawdown . . . or maybe you're doing the exact opposite of what you should . . . the point is that you appear to have no way of knowing.
Share some basic information, and people will be better able to help:
- What instrument and timeframe are you trading?
- What platform are you using?
- How long do you typically hold a position for?
- How did you decide to trade in the fashion that you currently are?
Kind regards,
BlueHorseshoe
- What instrument and timeframe are you trading?
-
Is it possible to create a indicator that just plots vertical lines of different styles and times that are user defined? ( A red dotted line at 10:34 and a solid blue line at 11:28 etc.) ?I'm pretty sure certain it is (you're a TS user, right?). I can't think how to do this off the top of my head, but I'll investigate it and try and give you a more helpful reply by the weekend.
I am sure I don't need to tell you this, but you realise you can draw vertical lines on the chart manually using the drawing tool?
In the meantime, you may also find that a creating a "ShowMe" study will do the trick - something like:
If t=1034 then plot(h,"",white);
or a PaintBar study:
If t=1034 then plotpb(h,l,o,c,"",white);
Regards,
BlueHorseshoe
-
I think it is also a myth that 'anybody can make money in demo'.
It's not a myth. I can teach anyone to make money in demo. They'll make money most days, certainly every week, and without a doubt every month . . .
The issue is to do with the way that demo platforms fill limit orders. Traders systematically under-estimate the impact of the spread (ie. market orders vs limit orders) on their trading.
I have seen very experienced traders unable to make money day-trading directional strategies - they end up net neutral - if they didn't have the spread costs they'd probably have made an amount equal to 20-30% - a strong return. If you're not realistic about how these costs impact upon your performance then you need to think again - these costs can add up to your entire weeks'/month's/year's profit.
If all of the above is giving you difficulty then you need to get outside the zone where these costs matter - swing or position trade (not so glamourous, I know!).
If you want to test your ideas in demo mode then you should click to buy/sell at market. If you actually intend to use limit orders then you can be re-assured that your actual performance will outstrip what you achieve in demo mode . . . despite the ubiquity of the algorithmic scalper, mutual funds and trend followers persist - why? Because they're not bothered about paying the spread . . .
If you're demo trading then assume you pay the spread.
BlueHorseshoe
-
Blowfish: I have been considering purchasing the Trend Dynamics course. The reason I became aware of it is because its concepts are mentioned in a book called "The Nature of Trends" written by Ray Barros.I reading his book, Mr. Barros apparently uses the Trend Dynamics concepts extensively, that I find interesting and make sense according to the Wyckoff techniques I have been studying and applying for several years.
My questions are these:
(1) Would you recommend the course to someone that is interested in amplifying his understanding of price action, without conflicting with the Wyckoff methodology that I currently use?
(2) And, in your opinion are the concepts as taught in the course, tried and proven? and do they reflect a realistic model describing how price action truly works and unfolds, or is it just another methodology that will lead a trader down the wrong path?
I would greatly appreciate your sincere answer and advice.
Hello,
You should remember that you're attempting to revive a 4 year old thread here, and that most of the participants will have moved on . . . So too might the markets. Or not. Depends upon the durability (not the temporary reliability) of the concepts.
Kind regards,
BlueHorseshoe
-
The commodity itself isn’t going to do anything for you….it is an entirely different game to buy a lump of something and hope that somebody else pays you more for that lump two years from now than it is to buy something that you expect to produce income for you over time”.
I'm almost certain that I remember reading something a couple of years back about Buffet/Berkshire accumulating a physical holding in gold.
May just be me mis-remembering though . . .
BlueHorseshoe
-
Hello,
I wondered whether it might be useful for you to try to distinguish whether the issue is:
a) a psychological/disciplinary issue to do with following a strategy?
b) an issue of what the best parameters for the strategy would actually be, based on your need to generate relatively steady income?
Hope that's helpful . . .
BlueHorseshoe
-
You can also choose to flip multiple coins at once (any idea why one would want to flip multi coins at once?)Enjoy!
There is an extremely good reason why - using multiple coin flips you can start to simulate specific probability distributions through a random process.
Regards,
BlueHorseshoe
-
Risk Control:2. We control the daily drawdown under 10%. If the system hit the drawdown then we stop the system for a while.
This is nonsense.
If the system has a positive expectation then following a drawdown it will revert to its previously upward-sloping equity curve. And you want to trade out of the strategy during this period!?!?
Stopping trading because of a drawdown makes no sense whatsoever - for a strategy you have very high confidence in there is actually a good argument for increasing position size during a drawdown.
BlueHorseshoe
-
As I understand it,this thread is based on random entry based on a coin flip.Whereas the above quotes talk about random entry based on trend following,with the implication being that even trading randomly (with the trend) there is an edge in identifying a trend and trading with it.
Until the bit about "long term trend filters" towards the end, then it's not a random entry with the trend, it's a random entry that could be profitable if it is with the trend, or will be unprofitable if it is against the trend. No judgement regarding the direction of the trend is being made as part of the entry decision, as far as I can tell.
Of course, it's hard to know exactly what was tested.
And I personally believe that efficient entries (better than random) are possible and, if you accept that the data is largely random, then non-random entries make perfect sense.
And yes - this thread was just a bit of fun, I think.
BlueHorseshoe
-
A brief article here investigating random entry portfolio trend-following:
Why random trade entry is as good as any technique
BlueHorseshoe
-
OK what do you think I have left out?Ticks certainly seems willing to be open about what he's doing and share information . . . Maybe someone with a better understanding of options could pick through this latest post and comment?
BlueHorseshoe
-
The only way this strategy will work to your benefit is if you are entering positions when the instruments you are choosing are mis-priced;So then there's the question - "mis-priced how?" Statistically mispriced? Fundamentally mis-priced?
And who else is looking at the same thing (faster)?
I'm with the other comments here (Mitsubishi, Siuya, MightyMouse etc) - there would have to be more to this than what Ticks is describing for it not to have an unhappy ending . . .
BlueHorseshoe
-
Really... I don't know what to say to that. I flipped the coin and made an entry because it seemed like a fun diversion, and that Mystic was asking for volunteers. True... I don't place much value on such "projects" (if one could call it that). It was my understanding that this was purely entertainment. To Mystic: if I've said anything that offended you, I apologize... it was unintended.Apologies - my reply was totally sarcastic - I was actually agreeing with your post.
I was taking the piss out of Patuca's hipster doofus language and "bad vibes" bullshit - not you!
Of course the thread is just for fun, and I'm sorry the joke wasn't clear in writing
BlueHorseshoe
-
None of the above... it's a coin toss. Anyone who believes in " (bad) vibrations, (bad) magnetism, or (bad) luck" should find another occupation.Patuca's so right - there's like, a really negative atmosphere around you dude - like you're just willing for stuff to go wrong and bringing all this negative energy to the project . . . maybe you should just, like, blow this whole scene and go find your own space man, yeah?
Random-Generator-Cyber-Bullying - now there's an original idea!
BlueHorseshoe
-
For what it's worth, fair coin tosses should follow a binomial distribution. Stock prices do not. So any system based on some fixed random distribution, binomial or otherwise will ultimately fail.As far as guessing 1000 winning trades in a row, it's 1/2^1000. Even getting 10 winning trades in a row is pretty small, approx 1 in 1000.
Enjoy the entertainment.
Binomial might be a bit of a red herring - a market always closes up or down from it's prior close - that's a binomial outcome, isn't it?
Stock prices don't behave like a coin flip, I agree . . . but nor do they consistently behave unlike a coin flip. Sometimes they are auto-correlated; sometimes they are not. A bit like a coin that is only weighted sometimes, and truly random the rest.
Markets only have to behave like a coin flip some of the time in order to make money from this observation. You just have to lose less when they are non-random than you make when they are random. And when they are non-random, because you assume random-ness, you'll still be correct 50% of the time - that is to say, if you flip a coin to decide up or down, and the market is only ever up, then you'll still be right as often as you are wrong.
BlueHorseshoe
-
Unfortunately guys/gals 10 coin flips is not going to tell you much. You need somethinglike 1000 flips to get any realistic statistical data.
Hi Jerry,
I'm not sure how logically consistent your statement is . . .
Do you think that 1000 coin flips will suddenly become something other than random? If every coin flip from the ten produces a winning trade, will we suddenly have a great trading system in our hands? If 1000 coin flips were to produce 1000 winning trades (can happen, but I can't do the maths!), what then?
Larger sample sizes usually mean greater statistical significance, but this is not always the case.
Anyway, this is all just a bit of entertainment
BlueHorseshoe
-
( why am I starting to feel like a bookie ? )
I've never trusted that Siuya, so I flipped a coin for Thursday 25th . . .
Heads - Buy.
BlueHorseshoe
-
I'd love to get involved, but I'm a little short on change . . . Could anyone possibly lend me a coin?
BlueHorseshoe
Applying Joe Ross Trading Methods
in Traders Log
Posted
Hi Handle,
Possibly you misunderstood my intention . . . I realise that you trade from a five minute chart. But you are using limit orders - what I am interested in understanding is exactly how you obtain fills on these orders - marking one of your entries (from your 5min analysis) onto a single tick chart (or even a 1 min chart) would help to give some idea of this.
Or, you could describe what you do.
You get an entry signal - now what do you do to get a limit order filled?
BlueHorseshoe