
Welcome to the new Traders Laboratory! Please bear with us as we finish the migration over the next few days. If you find any issues, want to leave feedback, get in touch with us, or offer suggestions please post to the Support forum here.

BlueHorseshoe
-
Content Count
1399 -
Joined
-
Last visited
Posts posted by BlueHorseshoe
-
-
Help! I Need a Broker )
) No you don't.
BlueHorseshoe
-
There are three types of horizontal lines that one can draw on charts:
1) Lines based on price - eg traditional support and resistance levels or consolidation zones (try Auction Markets).
2) Lines based on mathematical derivations of price - eg fibonacci levels or "daily pivots" (try Red Team, Green Team).
3) Lines partially or wholly based on or derived from non price data - eg MP points of control or VWAPs (try Trading with Market Profile)
All three are also well covered in various other threads around the site.
Best wishes,
BlueHorseshoe
-
No, I have not.Can you please tell me what it is ?
Hi Larry,
This has been linked from TL dozens of times, but the folllowing article will give you a good idea of "Death by a Thousand Cuts". And it's alternative. Hope it helps!
BlueHorseshoe
-
Hey Bh! That is what I needed thank you for your time is is appreciated.Pi
Glad to be a help!
Kind regards,
BlueHorseshoe
-
Hi Db,
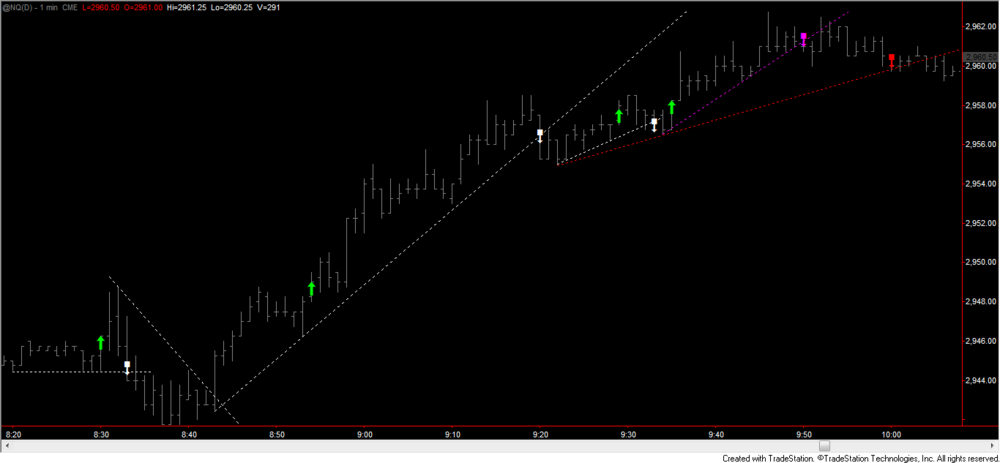
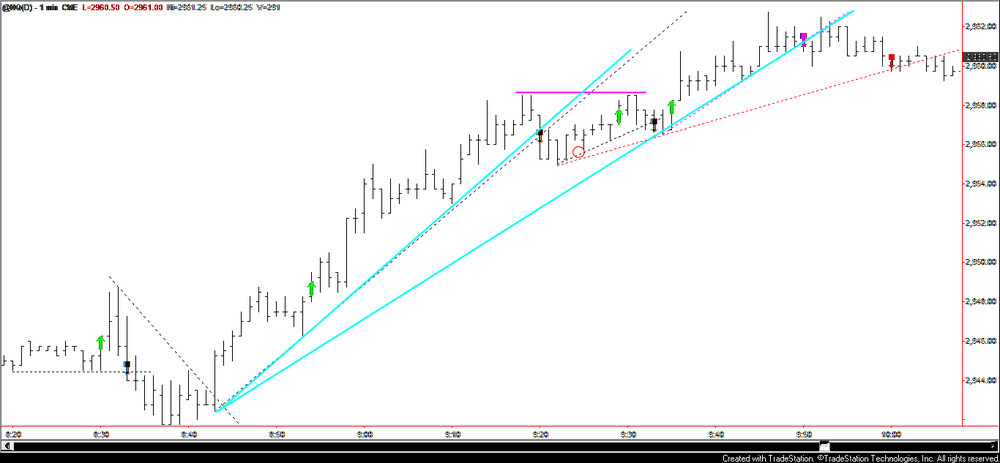
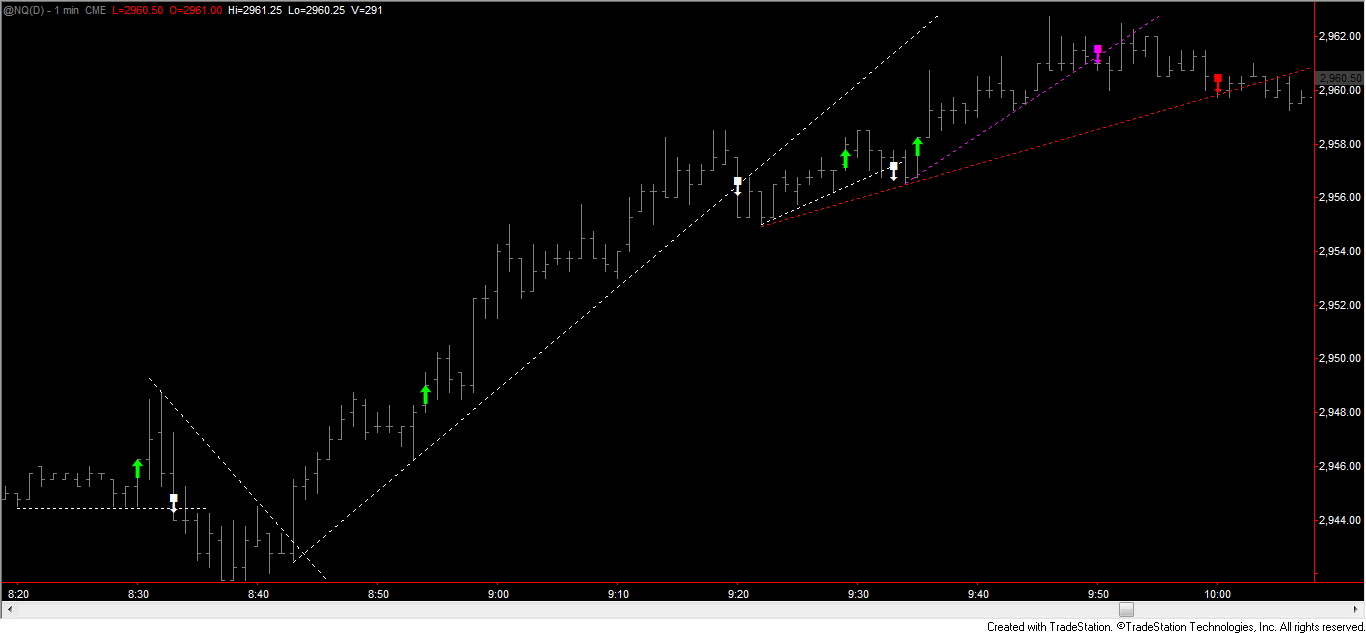
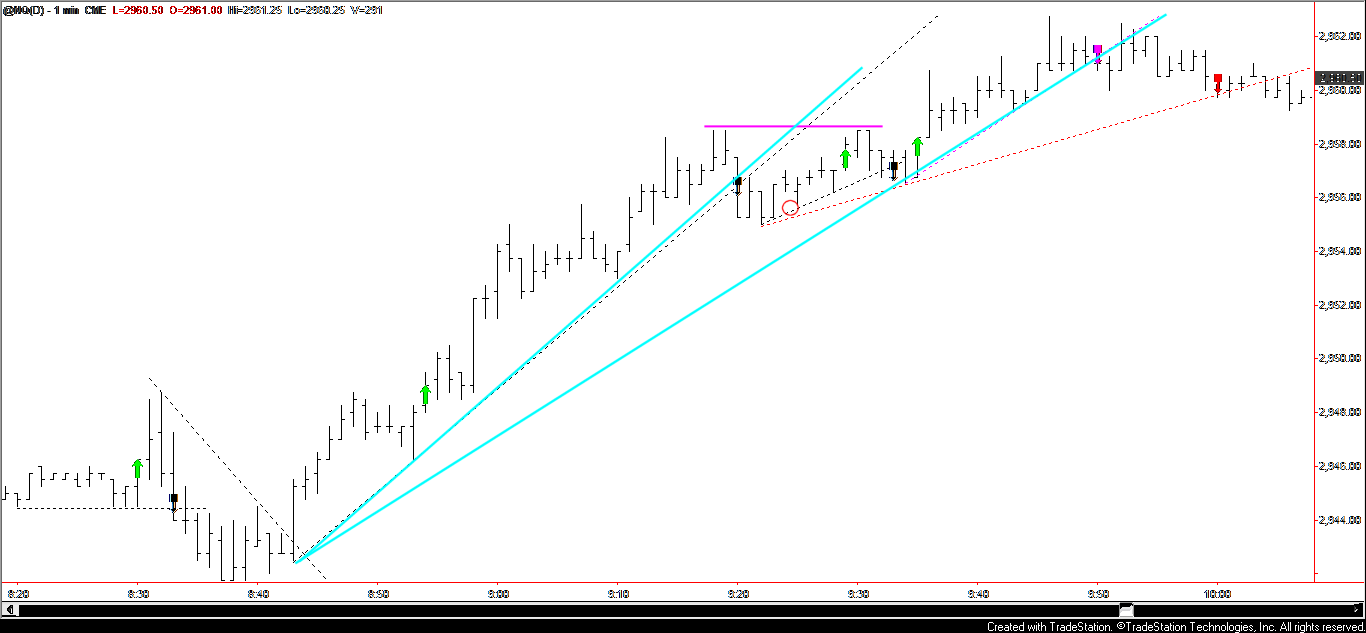
How does the chart below (today) look in terms of entries and exits?
Fine except that I would try the first short after the first break of the line (the hollow red circle), which would not have been triggered. After that, I wouldn't try another long until a new high was made (your 0935 arrow).
There is of course no one way to do this. The point of the exercise is not to teach a system but to persuade beginners to become sensitive to price flow. The particular entry or exit is largely irrelevant as long as one has a well-thought-out rationale for it.
Would you have used the red or the magenta line for the final exit (not that it made a masive amount of difference in this particular instance)?
Neither (see my chart). Given the failure to make a new high at 0951 and the hour and the decline in activity, I most likely would have quit for the day.
Am I correcting in thinking that the nearest potential short entry would have been after the retracement at 08:40?
Yes.
Thanks,
BlueHorseshoe
Thanks again. BH.
-
I have been trading using PnF strategy and if any one wanna share and learn from each other, most welcome.cheers
Why not do it here in the public forums where everyone can join in and learn, rather than via private email?
Thanks,
BlueHorseshoe
-
Thank you BH that solves the verifying problem. However I will still need to have the Hull avg displaced. Does this throw a monkey wrench into the works?Thankx
Pi
Hi,
Apologies for the delayed response.
Based on my understanding of displacement from your description above, I think that the following code should do what you want. Please take a look at it alongside the indicators on the chart, and see if the signals match with what you expect.
Inputs: length(9), length2(12), length3(20), price(close);
Vars: HMA(0), avg2(0), avg3(0);

HMA=jthma(price,length);
avg2=average(price,length2);
avg3=average(price,length3);

If (HMA[1]>HMA[2] and avg2>avg2[1]) or (HMA[1]>HMA[2] and avg3>avg3[1]) or (avg2>avg2[1] and avg3>avg3[1]) or (HMA[1]>HMA[2] and avg2>avg2[1] and avg3>avg3[1]) then
Plotpb(H,L,O,C,"Buy",Blue);

If (HMA[1]<HMA[2] and avg2<avg2[1]) or (HMA[1]<HMA[2] and avg3<avg3[1]) or (avg2<avg2[1] and avg3<avg3[1]) or (HMA[1]<HMA[2] and avg2<avg2[1] and avg3<avg3[1]) then
Plotpb(H,L,O,C,"Sell",Red);
Kind regards,
BlueHorseshoe
-
Hi Db,I probably overcomplicated the question by giving an indicator-based example (just trying to give some context) . . .
Asked more simply: would you keep in mind any kind of longer term bias (eg daily trend) when trading from a 1 min chart?
See the first post in the content thread.
And incidentally (ignoring indicators, timeframe etc), why do consider this so different from what your thread describes - i.e. trading retracements?
Why do I consider what so different?
Thanks for your thoughts,
BlueHorseshoe
Hi Db,
The first post in the content thread doesn't really answer my question.
The analysis in the first post states "So, Monday morning, price could take off from here or drop back into range", and the trades you show are both long and short.
There is nothing wrong with this analysis as far as I am concerned - but I am asking whether it would ever be different (ie a definite directional bias from the daily chart), and whether that would mean that you would only take long/short positions on the 1 min chart?
Many thanks,
BlueHorseshoe
No to both.
Thanks Db. BH
-
Hi guys, any legal notes should probably be in private messages. (However, I am not sure that legal action here is the best step!!)Or, if we keep this sort of thing in the public forums, you could arrange to have this added to the smilies:

BlueHorseshoe
-
I can't answer that. I don't use indicators and the approach you present is different from that addressed in the content thread. Since the ES is generally mean-reverting, it's unlikely that the approach presented in the content thread would be of much benefit.Hi Db,
I probably overcomplicated the question by giving an indicator-based example (just trying to give some context) . . .
Asked more simply: would you keep in mind any kind of longer term bias (eg daily trend) when trading from a 1 min chart?
See the first post in the content thread.
And incidentally (ignoring indicators, timeframe etc), why do consider this so different from what your thread describes - i.e. trading retracements?
Why do I consider what so different?
Thanks for your thoughts,
BlueHorseshoe
-
If you're referring to the profit %, none. As I said in the introductory post, the profit % has to do with how many points traded resulted in profit. The degree of profit is not considered.If you're asking about the impact of commissions on trading a small interval such as the 1m vs a large interval such as the daily, total commissions would of course be higher with the former. However, profits, if any, will depend entirely on the skill of the trader. Scalping is no more a guarantee of monetary success than is trading a 15m bar or a weekly bar. Our current NQ long is 170pts in profit with only one commission, but a bad daily trade can easily be counterbalanced by a series of successful intraday trades, regardless of commissions.
Hi DB,
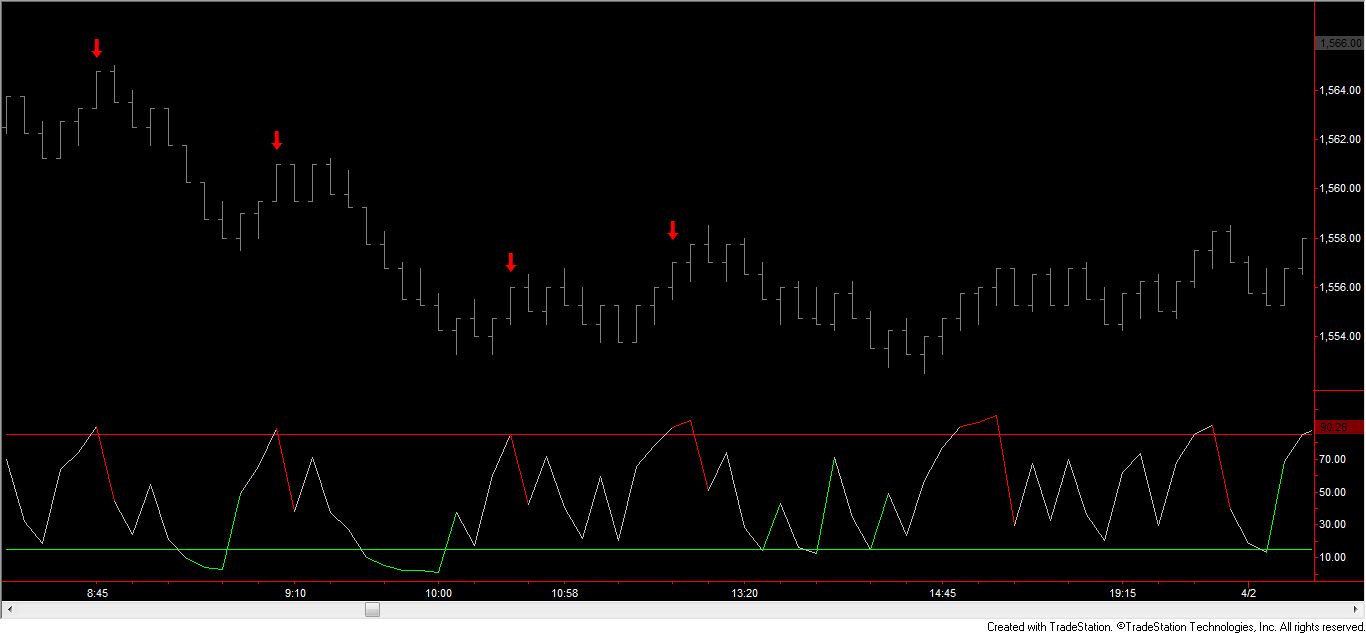
I was asking about small interval trading above.
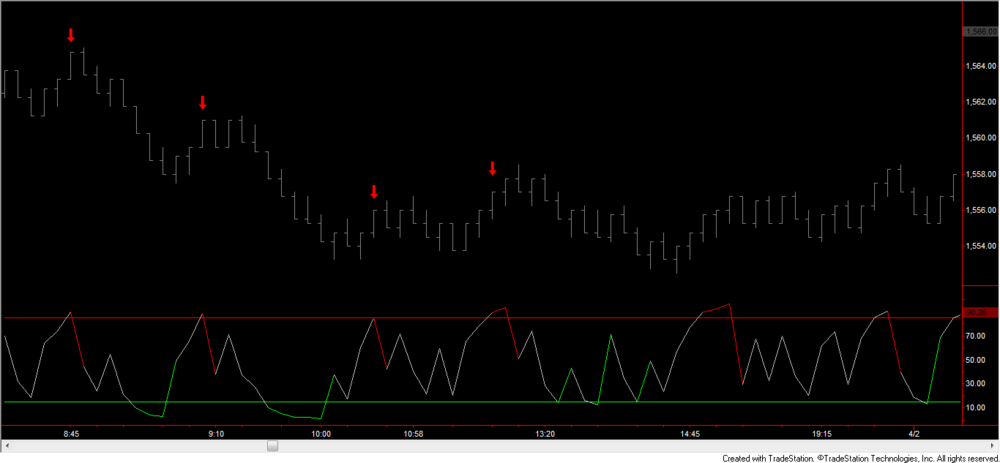
I have attached a chart which shows activity in the ES during the same period as your charts for NQ show, along with the type of entries that could have been triggered using a single indicator and a basic awareness of trend.
Trading like this (with the indicator) works well for as long as the trend has been correctly identified; to what extent (if any) would you incorporate a longer term directional bias when making decisions from a one minute chart as per the thread? At all?
Many thanks,
BlueHorseshoe
I can't answer that. I don't use indicators and the approach you present is different from that addressed in the content thread. Since the ES is generally mean-reverting, it's unlikely that the approach presented in the content thread would be of much benefit.
-
Hi DB,
I have no questions about the entry and exit rationale, or none that I haven't asked you before, but I wonder what sort of a dent you would expect that typical retail commission would make in the profit from this process in this timeframe?
And, did you trade this, and did you experience any execution difficulties beyond those you have indicated?
Thanks,
BlueHorseshoe
If you're referring to the profit %, none. As I said in the introductory post, the profit % has to do with how many points traded resulted in profit. The degree of profit is not considered.
If you're asking about the impact of commissions on trading a small interval such as the 1m vs a large interval such as the daily, total commissions would of course be higher with the former. However, profits, if any, will depend entirely on the skill of the trader. Scalping is no more a guarantee of monetary success than is trading a 15m bar or a weekly bar. Our current NQ long is 170pts in profit with only one commission, but a bad daily trade can easily be counterbalanced by a series of successful intraday trades, regardless of commissions.
-
Thanx for the code BH however the code will not verify. It keeps coming up with an error message saying ( this plot has been defined using a different name) referring to the word "SELL" .Thanks Again
Pi
Hi,
I have now checked, and this verfies fine with the amendment I suggested above.
At a glance, it certainly looks like it could form the basis of an interesting strategy . . .
Kind regards,
BlueHorseshoe
-
I "get it" just fine Onesmithand for the website owner Mark...apparently this guy is a stalker......I won't post on this thread again....
Hi Steve,
Why do you keep stating "for the website owner Mark"?
Is it because:
- You wish to reassure Mark that he owns the website?
- You wish to reassure yourself that Mark owns the website?
- You think there is authority and/or kudos to be derived from knowing the website is owned by Mark?
Linguistically, it's just a curious thing to keep doing, that's all . . .
Kind regards,
The occasional website contributor BlueHorseshoe.
**************************
ps. I was looking at an old ActiveTrader article by Thomas Stridsman (attached) the other day. Elements of his thinking seemed to resemble what I know of your own - might possibly be of interest or use to you?
- You wish to reassure Mark that he owns the website?
-
Thanx for the code BH however the code will not verify. It keeps coming up with an error message saying ( this plot has been defined using a different name) referring to the word "SELL" .Thanks Again
Pi
Hi,
Sorry - I'm writing this on a machine on which I don't have TS installed, so I can't check the code. Plus I haven't written a PB study in ages, so I'm doing it from memory . . .
Try removing everything from within the quotation marks for both buy and seel signals, so that they just look like this:
Plotpb(H,L,O,C,"",Red);
Any good?
BlueHorseshoe
-
I was hoping that somebody could help me with some coding. I want to create a paint bar study that utilizes 3 MA,s ( 2 simple, and 1 hull avg. )Hi PitTrader,
Firstly, the code you give above is not the code for the Hull Moving Average. It's just code to call that function. But that's not an issue here . . .
Because of the way that the HMA is calculated you might want to try using a square number (9 or 16?) for the length setting - not quite hocus pocus in so much as there is a mathematical reason for doing so, but not necessarliy bound to make any improvement to your indicator.
I'm confused by (high+low)/1 . . . There's no point dividing by one as this won't change the parenthisized value. If you're after the "midprice" of the bar, then you need to divide by two. In the code below, you can do this by replacing the "Close" for the Price input with (H+L)/2.
I'm confused by the whole displacement issue as well. For now, let's ignore this and try and get some basic code for you to play with:
Inputs: length(9), length2(12), length3(20), price(close);
Vars: HMA(0), avg2(0), avg3(0);

HMA=jthma(price,length);
avg2=average(price,length2);
avg3=average(price,length3);

If (HMA>HMA[1] and avg2>avg2[1]) or (HMA>HMA[1] and avg3>avg3[1]) or (avg2>avg2[1] and avg3>avg3[1]) or (HMA>HMA[1] and avg2>avg2[1] and avg3>avg3[1]) then
Plotpb(H,L,O,C,"Buy",Blue);

If (HMA<HMA[1] and avg2<avg2[1]) or (HMA<HMA[1] and avg3<avg3[1]) or (avg2<avg2[1] and avg3<avg3[1]) or (HMA<HMA[1] and avg2<avg2[1] and avg3<avg3[1]) then
Plotpb(H,L,O,C,"Sell",Red);
Have a look at that and compare with what you see visually with your indicators alongside. Let me know if we're in the right ballpark and then we can try and tweak the displacement thing.
Kind regards,
BlueHorseshoe
-
This is for Patuca....................Third from left?
BlueHorseshoe
-
Hi Onesmith,
If I consider anyone on here is worth my time, I tend to speak with them using PM. You know whether or not I speak to you through PM. You don't know whether I speak to Steve through PM. I will tell you whether I speak to Steve through PM in a PM to you, should you be one of those people with whom I speak via PM. If you're not one of those people then you'll never know whether I speak to Steve via PM, but you will know that I don't speak to you via PM, and therefore likely consider Steve's attack from last year to be accurate.
BlueHorseshoe
-
Basically the pricing mechanism for this should be arbed out if everyone knew and thought it was perfectly random.....so in a perfectly random market would still be incredibly hard to trade as it would simply be luck - that is the whole point of a random market.
.
That's not something I had considered. In theory, I suppose, arbing out randmoness would lead to . . . non-random behaviour? I should stop visiting threads like this before 9am
"the perfectly random will still have some series of long runs more often that you can stay solvent" - which is why even Casinos limit some people and bet sizes
For anyone who can be bothered with it, there's a detailed explanation of the maths involved in casino limits and long runs in Ed Thorp's 'Beat the Dealer'.
BlueHorseshoe
-
So we get a trader that may keep adding to losers in the hope that the markets are completely random so I'll double up and my next trade has a 50% chance of making all my money back. This is dangerous thinking, wouldn't you agree theDude?I wouldn't agree. Lots of people grind down accounts with stop-losses - death by a thousand cuts - and call it "risk management". Once the money is gone, it's gone, so it really doesn't matter whether you blew it all on one trade, or you got stopped out a thousand times.
Knowing the probabilities involved in each is the only thing of importance . . . Can anyone name an ETF that went to zero? Can anyone even show me a chart of an instrument (any one will do) that fell, let's say, more than 50% from it's highs without a pullback that would have provided a better than worst case exit?
Doubling up on a position is only dangerous if your starting position is heavily invested or heavily leveraged. Otherwise, it's just buying more of something at a cheaper price.
BlueHorseshoe
-
Hi there,Never bothered to trade or even watch any stocks - recently decided to remedy that and set aside some time for investigation.
Proposal:
Using third party software to consolidate my ninjatrader time&sales, I am thinking to stare at the time&sales for whatever US stocks happen to be "in play" that day.
By "in play", I mean likely to attract institutional buying/selling on the back of pre-market news or what have you.
Just to satisfy my curiosity, I will be staring at the T&S for a particular event:
large market orders of peculiar size being repeated in quick succession.
I stumbled upon this random idea on another trade forum - one of the posters suggested that it might signal the disguised actions of a specialist acting on behalf of more than one large client.
Whether the idea is credible, I've frankly no idea - but happy to watch and make some conclusions based on actual observation rather than speculation.
Would welcome ideas on the following:
1) Thoughts on the concept
2) Methods or websites that would help in identifying potential "in play stocks" - preferably smaller caps to reduce noise on the T&S.
Thanks in advance if anyone has any input
I have no thoughts on whether the concept is sound or not, but wouldn't you be better looking at a more automated and mechanical way of doing this, rather than 'staring at a screen'?
It's perhaps not much good looking at volume of executed trades (as this may alert you too late), but why not just sum the depth of book and have some sort of average or threshold to reference against? Two other thoughts:
1. You could net off orders of a smaller size from the above (although this could be dangerous as you might miss icebergs etc).
2. This is purely a guess, but mightn't someone wishing to work a large order in a less liquid stock need to do so across multiple exchanges? If that's true, then you could include a requirement for that in your "in play" criteria.
Hope that helps.
BlueHorseshoe
-
there could be a strategy that has a million flips that resulted in a loss each time.
The answer is 'yes'.
And with equal probability there could be a million winning flips in succession.
But why does this matter in terms of thinking about trading?
I disagree with SIUYA's statement: I think that a market that was perfectly random would be incredibly easy to trade. The probability of long runs of similar behaviour would be incredibly small, and you could bet against the continuation of such events.
Unfortunately price clearly isn't completely random, and nor is it completely non-random, hence trading is difficult . . .
I am taking the needle off my own stuck record now
BlueHorseshoe
-
I am sincerely pleased when your're inspired regardless of the source.Well . . . "inspired" is a strong word. I don't recall ever having been inspired by a post in Steve's thread . . .
BlueHorseshoe
-
Has anyone found anything articulatably tangible within steve46's teachings? That consistently wins? More than it loses?You'll have a hard time explicitly testing any of it, unless you have access to some special indicators that Steve has created (and to the best of my knowledge hasn't shared).
Nevertheless, the gist of what Steve says is reasonable enough - he doesn't generally spout the same tired claptrap that many vendors do - take the comment above that forex tends to undergo more sustained trending behaviour than indices, which tend to be more cyclical. Seems fair enough, doesn't it?
BlueHorseshoe
Why Successful Traders Use Fibonacci Retracements
in The Markets
Posted
It's because many traders are unsure whether the relevant fib level is 61.8 or 38.2, so they add them together and divide by two to get an average retracement level of 50 . . .
:rofl:
BlueHorseshoe