Welcome to the new Traders Laboratory! Please bear with us as we finish the migration over the next few days. If you find any issues, want to leave feedback, get in touch with us, or offer suggestions please post to the Support forum here.
-
Content Count
167 -
Joined
-
Last visited
Posts posted by ehorn
-
-
... Remarks such as these serve only to detour the beginner down paths that will waste his time and his money, perhaps for years.Here is another quote I am fond of:
"Even if it were possible to prevent the gullible from being led down the garden path, one would first have to determine what is or is not a garden path, then determine who is or is not qualified to prevent the gullible from walking it"
Though I am unable to validate the wisdom of its author.
-
The volume will give you a clue...+1 for this - Volume (more accurately the sequences of volume leading price) is a leading indicator of price and trends (whether price is moving in a non-dominant direction (retrace) or dominant. IMHO, using price alone to determine a trend (dominance) is akin to gambling.
As a wise man once said...
"Price Action is a vendor induced fad and the dog will not hunt ultimately simply because it is not systematic. Meaning, there is no complete structure, no complete process and it is not possible the get results from the incomplete structure and process."
Best wishes
-
How bout something like:
int b=0; foreach (int i in array1) { (if i==0 | i%3==0) { array2[b] = i; b+=1; } } -
The most definitive source of correct and accurate information is the market itself. Everyday it provides us feedback. It shows a trader everything he/she needs and it shows us where our strengths and/or weaknesses lie. It tells us where we are solid and where there is room for refinement. Spydertrader cannot make the journey for anyone of us but only act as a guide. In his great efforts, he has provided us all a record of the things required to learn to listen to the market and to learn from the market. I think many of us have come to a place where we feel the need to be graded on our homework. The market gives out grades everyday and it gives out homework as well.
Just my 2c
-
-
-
Much more are those who believe trading is probabilistic.
-
-
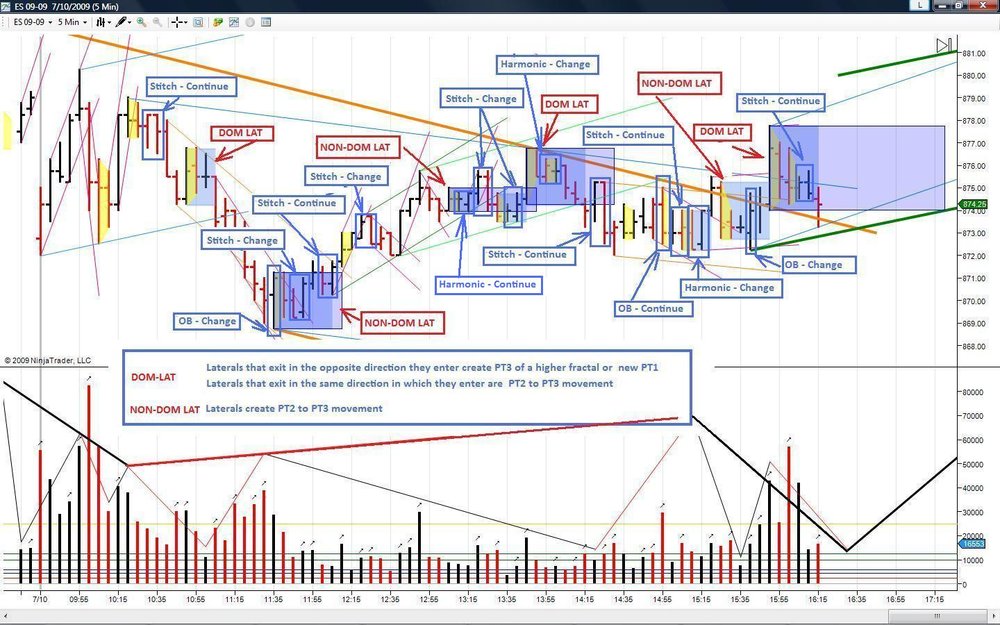
A timely lesson on Laterals Spyder

-
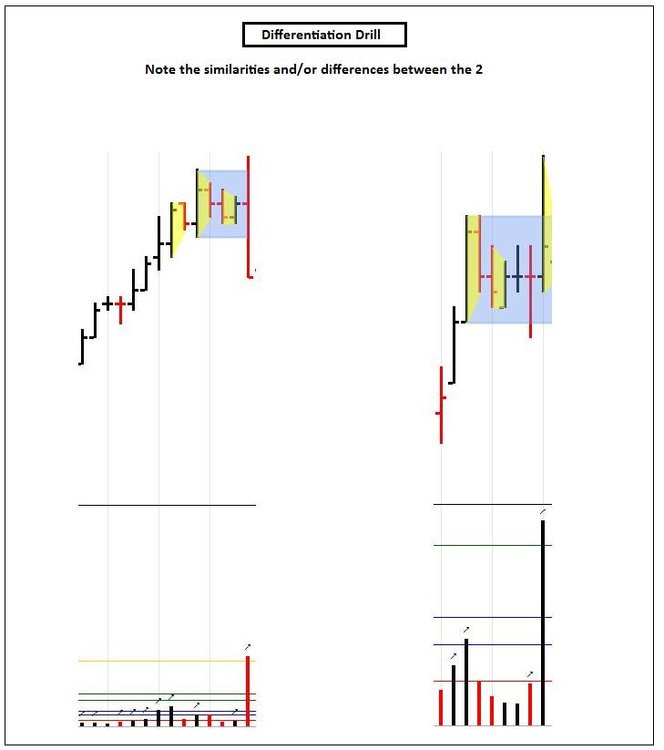
Would that I had your eyes, so that I too could see the truth. I shall learn to distinguish that which I believe exists from that which the market has actually provided me.As Spydertrader describes - the process consists of a 4 part routine (MADA). He is kindly providing the framework necessary to accurately perform the first part (M)onitor. As a practitioner of these methods performs the routine, over time, the mind becomes differentiated to be able to "see" what cannot be seen at first.
Best wishes
-
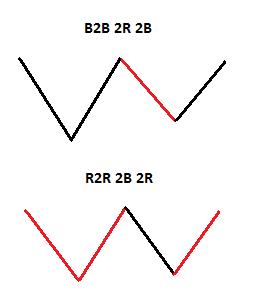
I cannot find the definitions for;B2B 2R 2B
Or
R2R 2B 2R
What does "B2B", "2R", and "2B" mean/stand for?
What does "R2R", "2B", and "2R" mean/stand for?
What does Gaussian mean?
Many thanks!
Please review Spydertraders original post highlighting Gaussians and there formations below..
GaussiansThe Volume Sequences (represented by Dominant and Non-Dominant Gaussian Formation) when matched with the above drawn trend lines for each trading fractal create the B2B 2R 2B (uptrend) cycle, as well as, the R2R 2B 2R (downtrend) cycle. Increasing Volume in the direction of the current trend represents dominant Volume. We represent such phenomenon with an increasing Gaussian line in our Volume Pane with the goal of syncing our trend lines with our Gaussian lines of equal weight See Attached.
To Be Continued ...
- Spydertrader
Here is another view of the volume gaussians sequences:
-
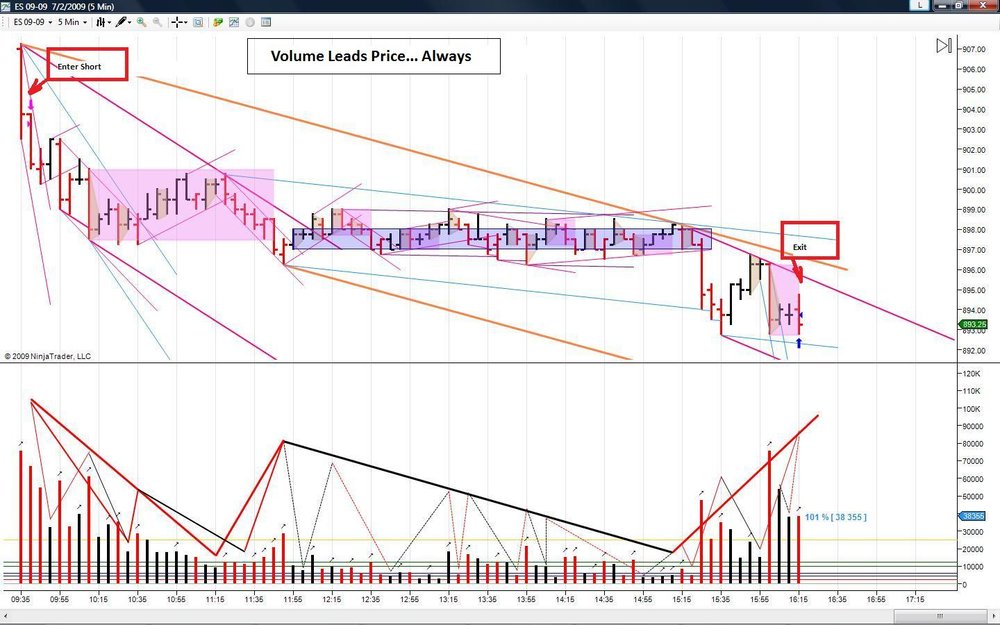
Volume leads Price. Always. And without exception....Lastly, the market speaks on every single bar delivering its signals to the trader in a timely fashion – and well in advance of the next trend. It turns out; one need not know how long a particular trend will last. One only need know the signals for when a particular trend has come to an end. As all trends overlap, where one trend ends, the next trend begins....
- Spydertrader
Hear! Hear! It speaks and we strive to listen.

-
So the idea is that if you folks say it enough times the masses will start to believe it?The obvious answer to this rhetoric is no... I feel you adequately represent the masses (thinking and beliefs).
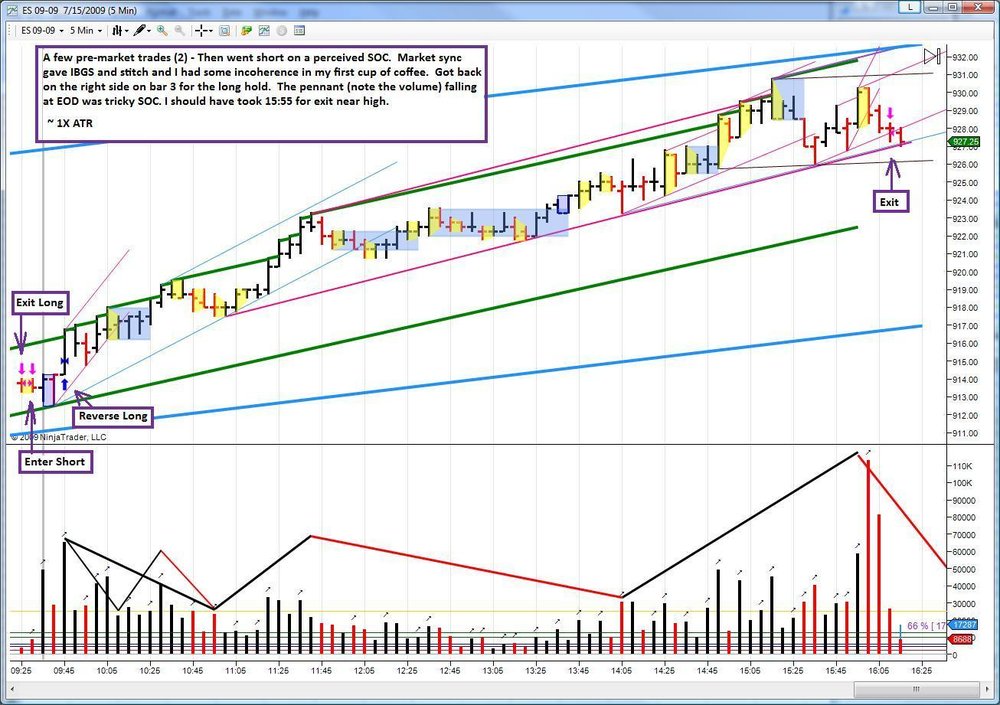
After all, are we to believe that bulk of the volume trade during the 15:25 EDT bar (based on Ninjatrader's time stamp) occurred prior to the price break, and price dropped in response to that increase in volume? Or did price break, and volume swelled as price continued to move down from the now broken support?You are free to "believe" whatever you chose. It is the sequences of volume which must complete and these sequences are what are being monitored (This is not a single data set as you perceive - i.e. one volume bar). A trader performs a routine of monitoring and analysis and then makes decisions and takes actions based on this price/volume sequence.
In the end, the real question is how do you trade it? See my charts attached here: If I were not already in a short position, I would have traded that break with a sell stop at 896 and a stop loss at 899.25. I would have had a profit target somewhere just above 891.25 support. Anyone, including my nine year old daughter, can look at the chart, read my explanation as to how I would have traded that break, and duplicate it in the future. This is emphatically not the case with the contributions made by you and your friends to this thread.
There are many ways to make money trading markets. Spydertrader purports one way and I concur with the principles he ascribes.
The history of the world shows that people are many followers and few leaders. People are always looking for someone or something to follow.My goal is to follow the market and listen to it. The principles of price and volume and the sequences provide (me) the information required.
As I said before, anyone can put "I sold here" and "I covered here" on a dead chart 72 hours after the closing bell and look, or I should say, try to look like a genius.There is nothing glamorous about the day or the trade. In fact it was just mundane. It was a slow day (it is summer) and the market did not provide any signals other than hold the entire day (for the fractal I trade). This is not genius stuff or an attempt to appear as such.
But no one here could look at what you did and duplicate the trade in the future on the basis upon which you claim to have made it, because there has been no basis given.The intent of the attachment was to demonstrate (more or less) a repeatable process of the application of the principles.
I really do not believe I am being unreasonable. If you folks are for real, then why not share the minimum required for intelligent and respectful human communication?I participate here at TL because it has always seemed, for the most part, like a forum of seriously interested folks, with very little of the guru speak and fraud that one sees over at other forums, most notoriously notable, ET. I have apparently stirred the nest and we have attracted the the attention of the minions of a few gurus who have a near cult-like following (see how many who have rushed to defend the manifesto are new to TL, and who have a mere handful or even fewer posts here). In the interest of preserving the character of TL, and hoping that this contagion maybe contained, rather than spread throughout the forum, I will no longer participate in this thread.
So you are acquainted with and have observed the intelligent and respectful communication effort undertaken to transfer knowledge of the principles of price and volume. I take no offense at your beliefs. I simply was unaware of this forum until yesterday and thought I would join up and say hello to some of my colleagues. I apologize for interrupting. Open and honest dialogue is never a bad thing regardless of ones views and/or opinions.
Happy Independence Day
Peace.
-


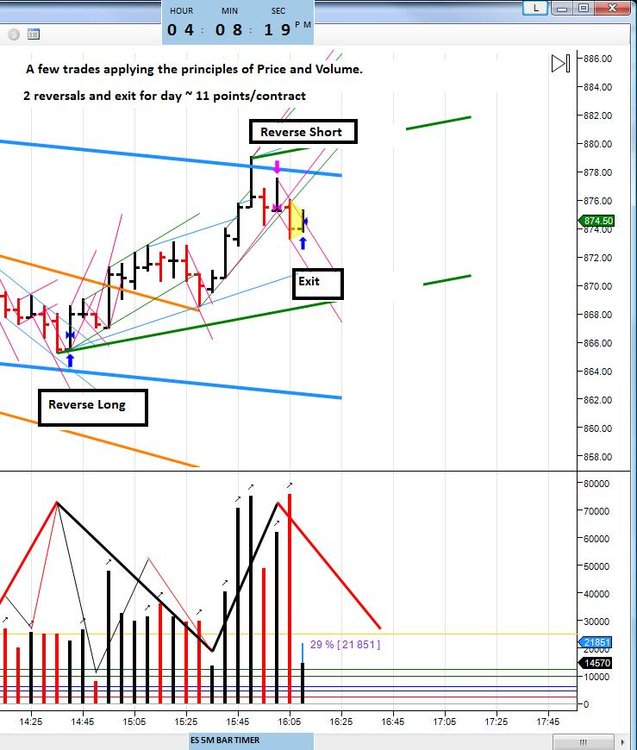
Trend Change or Retracement
in General Trading
Posted · Edited by ehorn
Hello aquarian1,
You have made a very good inquiry. It is a foundational question to a beginning of understanding how markets operate. I believe Tams has provided you the leading market variable for the answer to your question. I will expand on the application of volume information and its use that I have found to be true and has greatly contributed to my understanding of how markets operate.
IMO, the most reliable indicator for determining these beginnings and endings (trends) is price and volume. But moreso volume. Used together these present a formidable combination that allow the trader to see how the market operates and migrates from trend to trend. All trends have the same beginning and ending. The fundamental principle of determining whether price is moving in a dominant direction or non-dominant (retrace) is volume and the sequences that volume undergo to produce price movement and a trend.
Volume is not a static variable just as price is not static. The sequences of volume are sometimes explained with a simple notation:
(B2B 2R 2B) - Where the Dominant Trend is up
(R2R 2B 2R) - Where the Dominant Trend is down
or X2X 2Y 2X - when viewed on a time scale it would appear as diagonal volume rays tracking the movement of volume like this:
\ / \ / where /=X and \=Y; so applying this to our Dominant Trend we can see that for an up trend we will see the following behavior:
A new trend is established with decreasing black volume (\B) as it approaches the existing resistance point (Trendline). Price then breaks out of this resistance on increasing volume (/B; now B2B in the sequence). Once this occurs and is completed, price will begin its retrace which is signified by (\R; now 2R in the sequence) and then return to dominance (/B; now 2B in the sequence) - B2B 2R 2B.
All Markets are fractal in nature and this sequence (X2X 2y 2X) occurs on all fractals. All fractals undergo these sequences as the market forms trends within trends within trends. When all of these sequences have completed on all fractals the existing trend is extinguished and a new trend forms.
Many people choose to ignore this truism. Truth can be intolerable at times.
Best wishes.