
Welcome to the new Traders Laboratory! Please bear with us as we finish the migration over the next few days. If you find any issues, want to leave feedback, get in touch with us, or offer suggestions please post to the Support forum here.

ehorn
-
Content Count
167 -
Joined
-
Last visited
Posts posted by ehorn
-
-
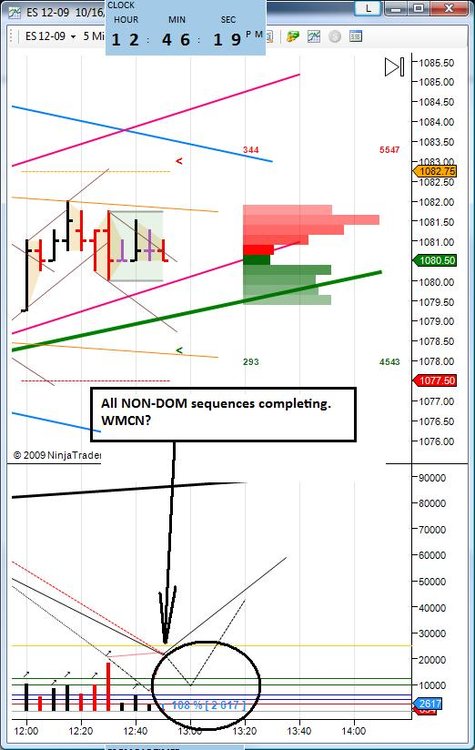
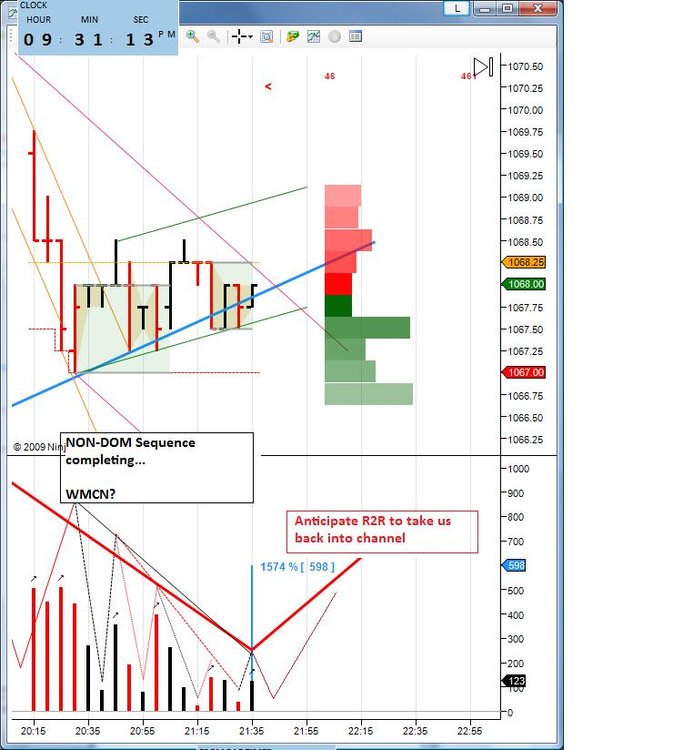
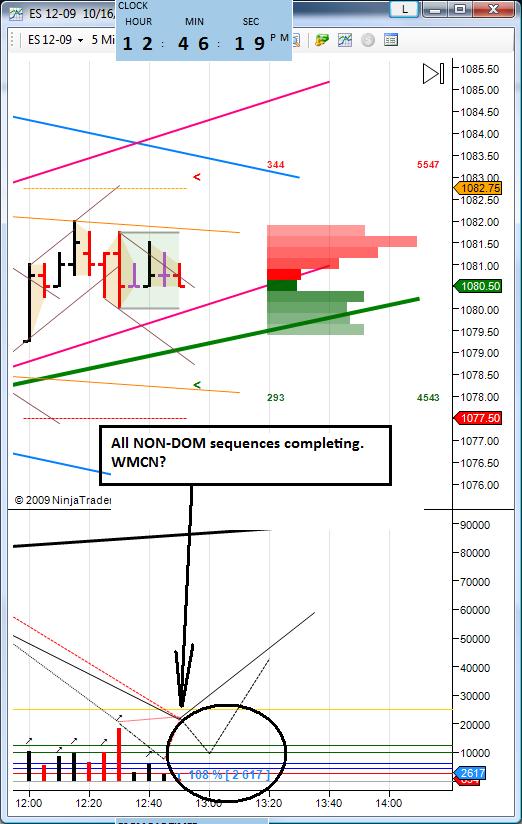
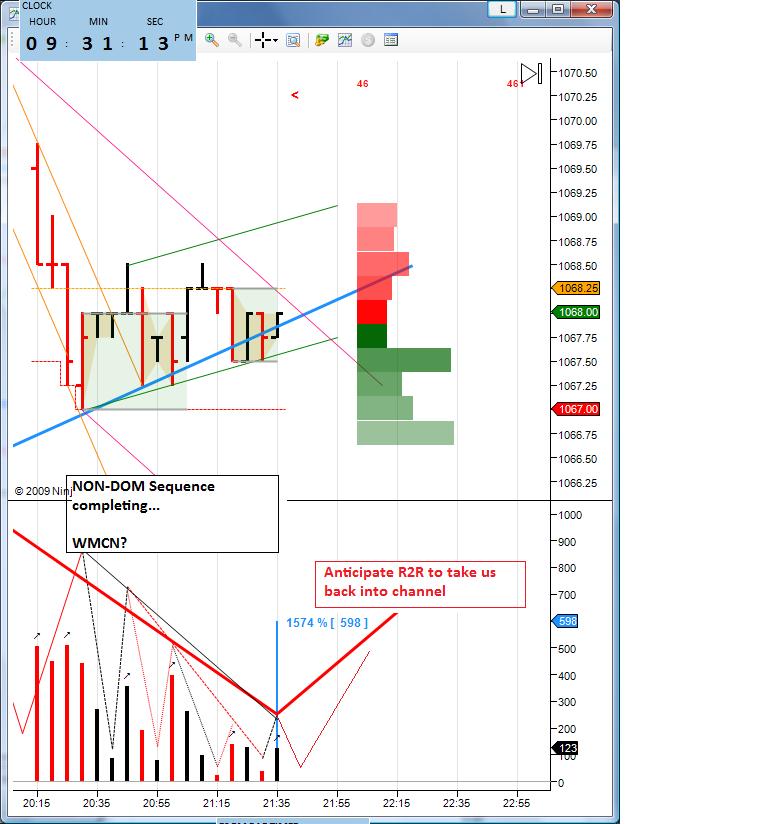
WMCN is the question every day, every bar....
Very powerful stuff!
-
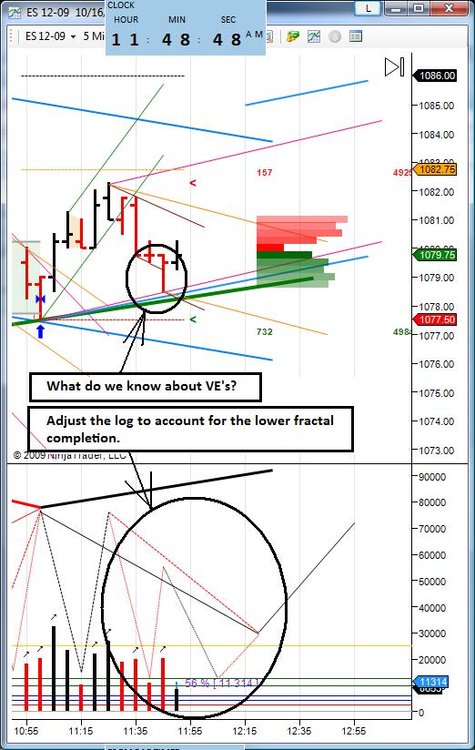
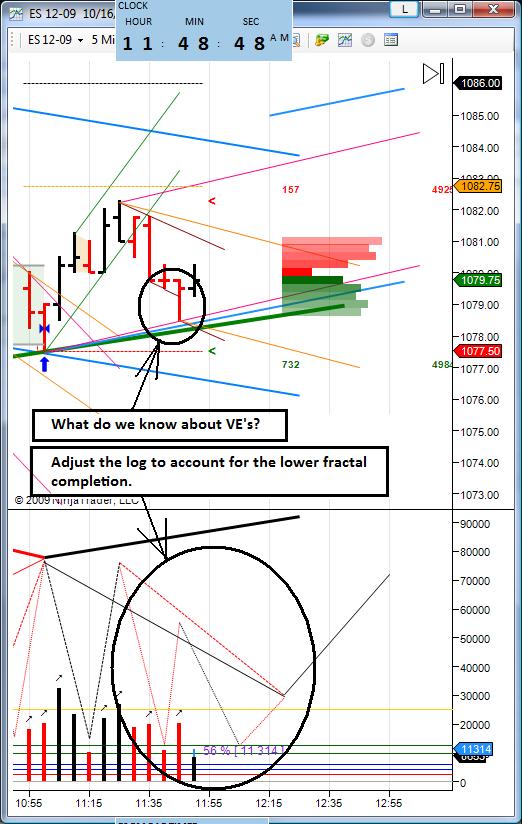
A VE must be accounted for... Adjust the log...
-
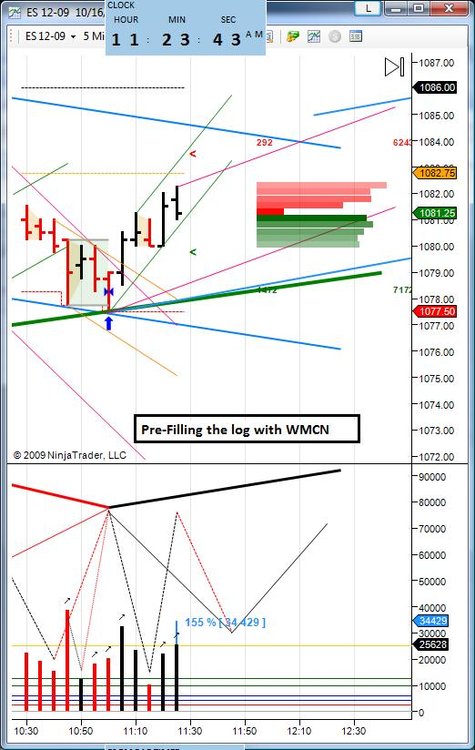
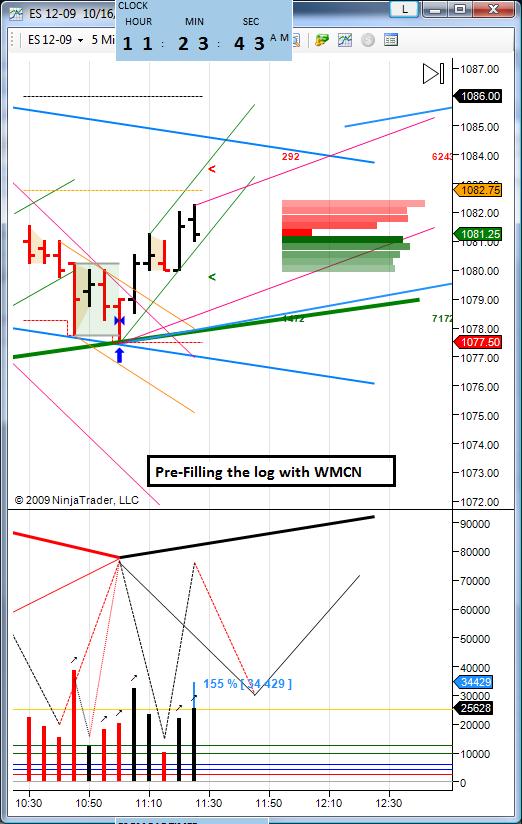
Pre-filling the sequence log in anticipation of WMCN...
-
Site is looking and performing great James.
Thanks again to you and your team!
P.S. Loved this image so much I had to snag it:

regards,
-
Thanks for postingI've noticed that your channel gaussians differ from mine. What color annotations do you use?
I am still learning to develop a more consistent coloring convention across all days.
My larger focus is on the following principles:
The fractal nature of price movement.
The sequences of Price and Volume.
FTT's and VE's
Continuation and Change
Always asking where am I in the sequences, how fast are things changing, and WMCN.
A tape, traverse, channel (call them goats - lol!) could consist of 5 bars or take 5 days (more or less). As a Intraday trader, IMO, focusing on the above principles allows a trader to participate in the market regardless of the duration of various fractal sequences. Fortunately, all fractals develop in exactly the same manner.
-
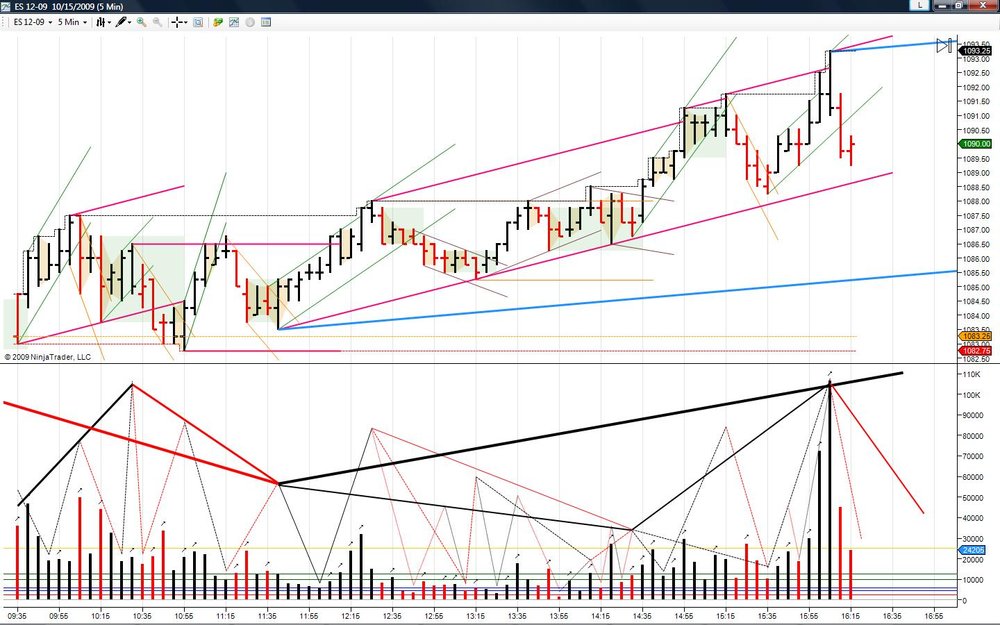
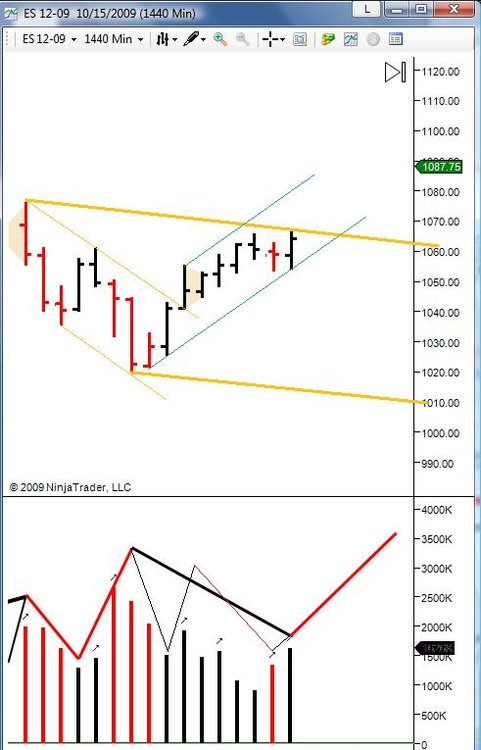
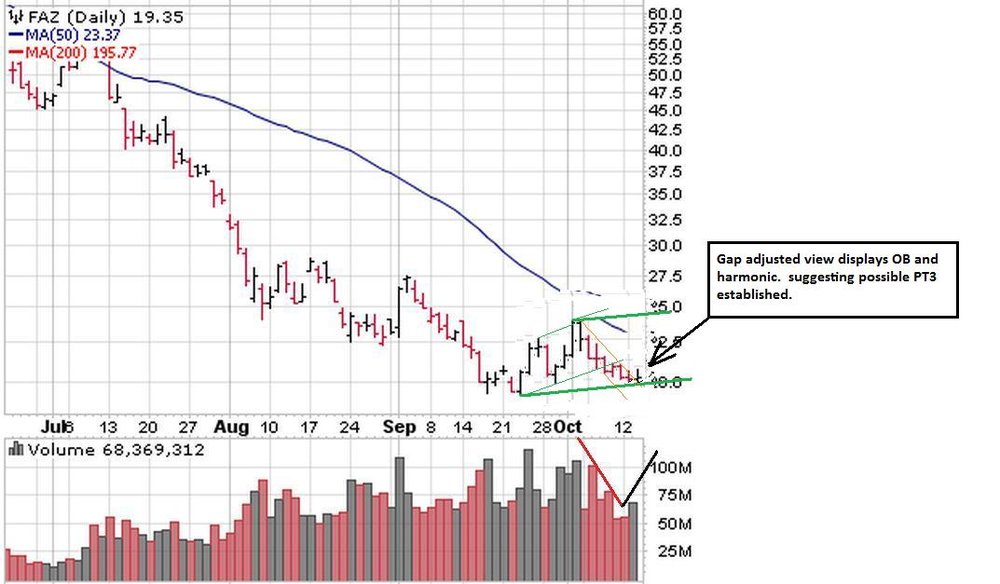
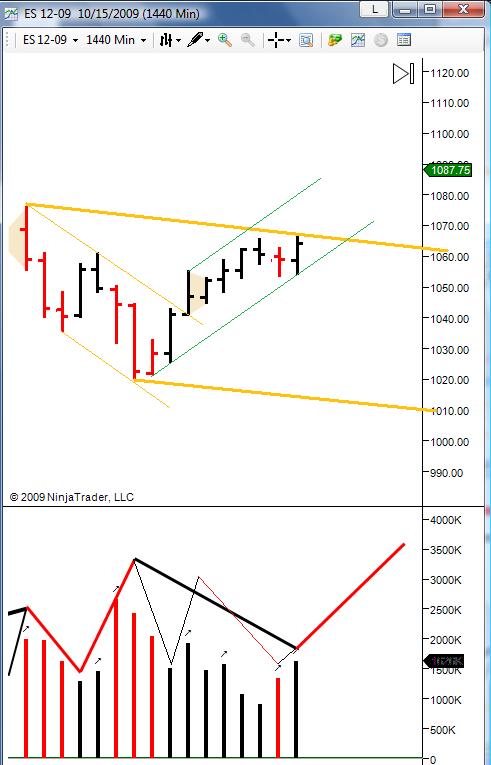
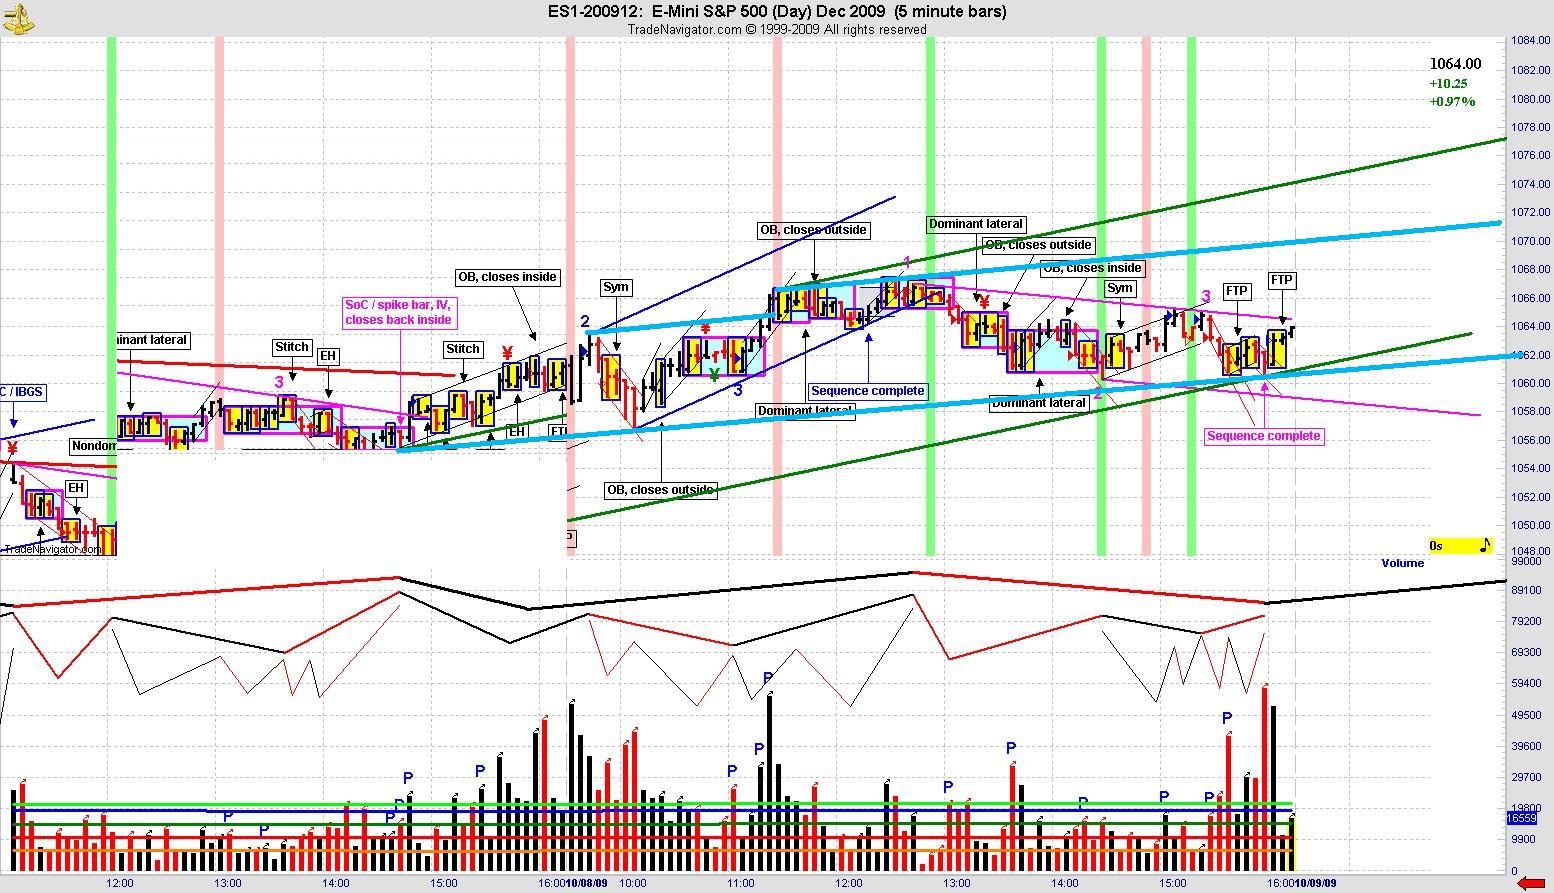
A "No Gap" view of the recent daily...
-
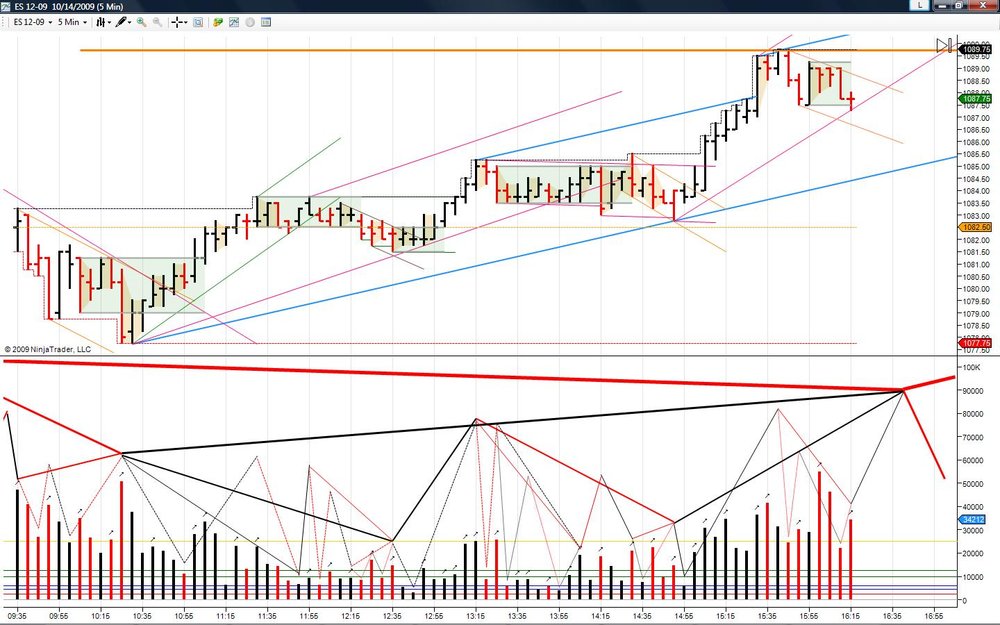
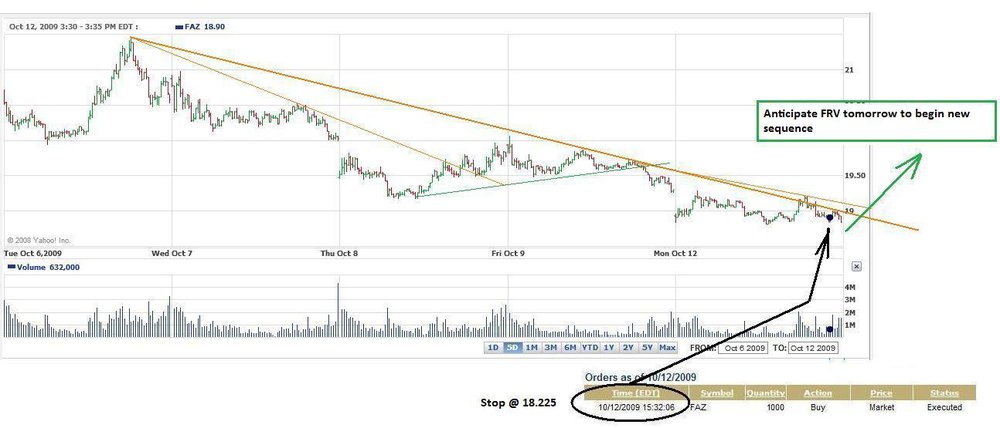
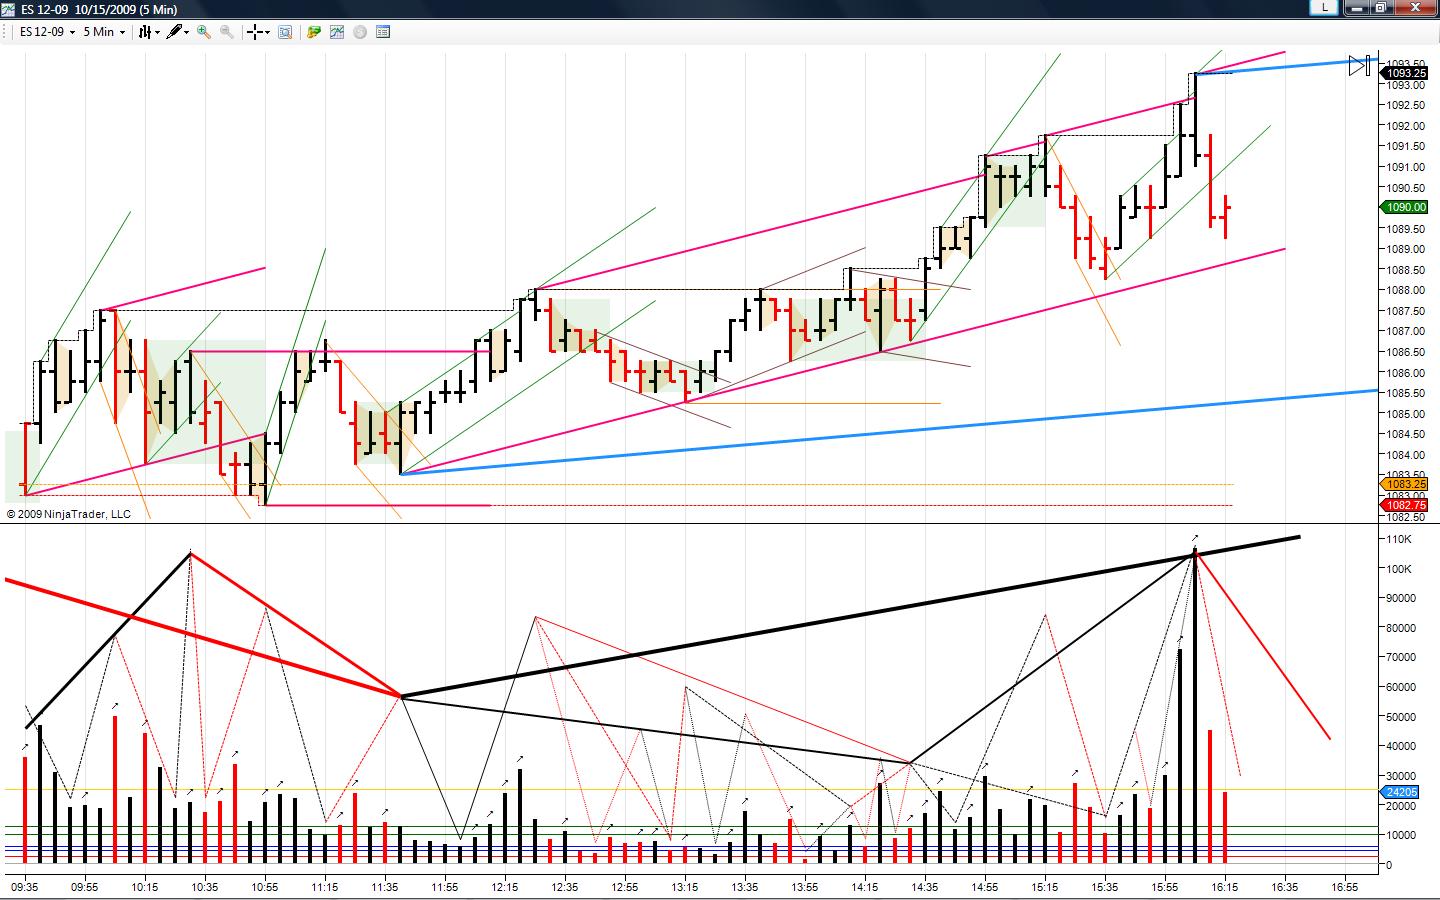
My view of the day...
OK,Sorry for polluting the thread...
MK
I think everyone would agree, you are in no way "polluting the thread".
-
OK - What is a 'goat'?LOL!... Spydertrader once used it to describe something OTHER than the 3 levels... and it caught on among a few of the folks

-
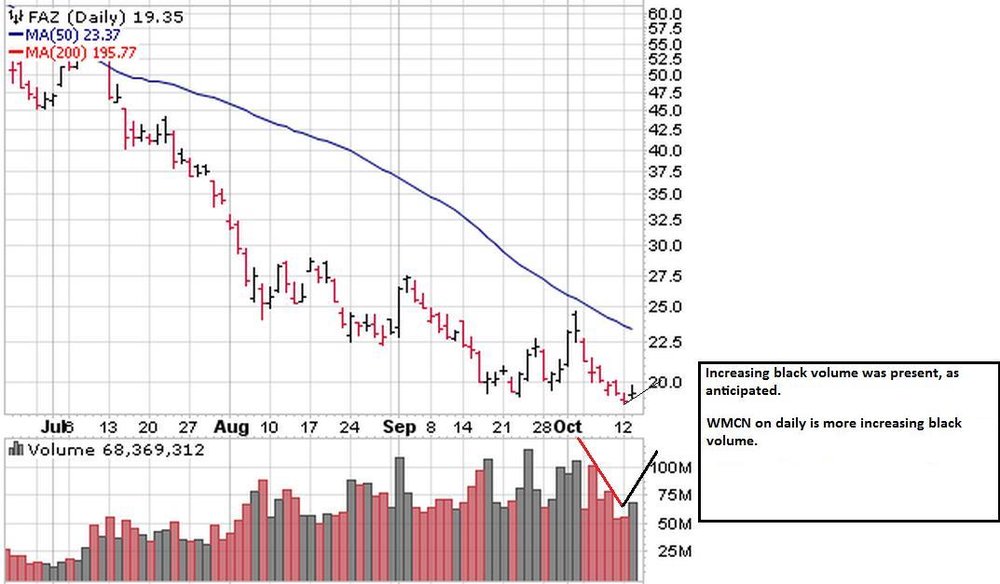
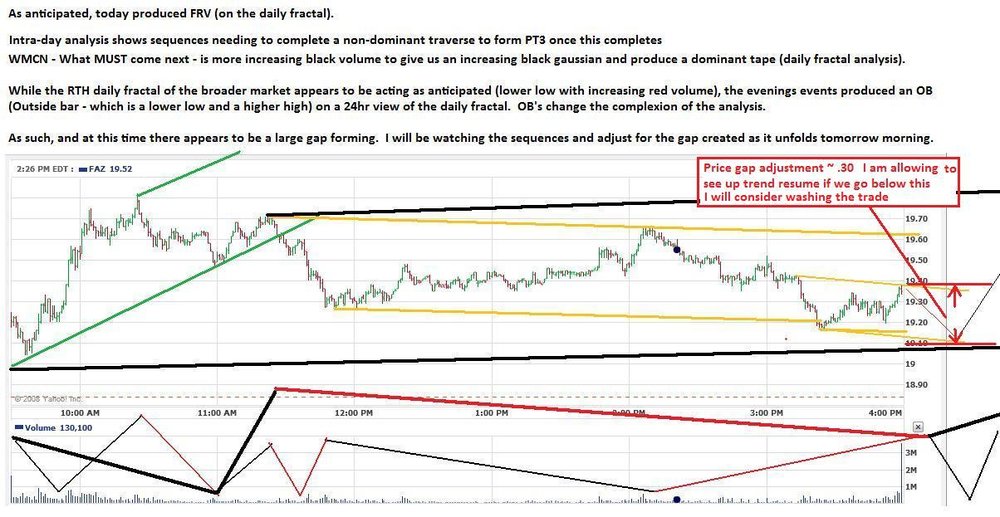
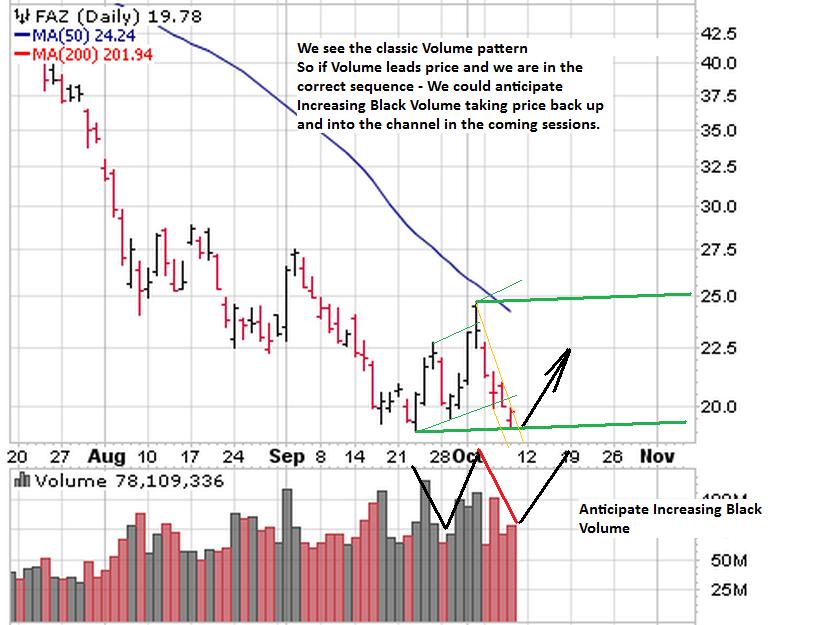
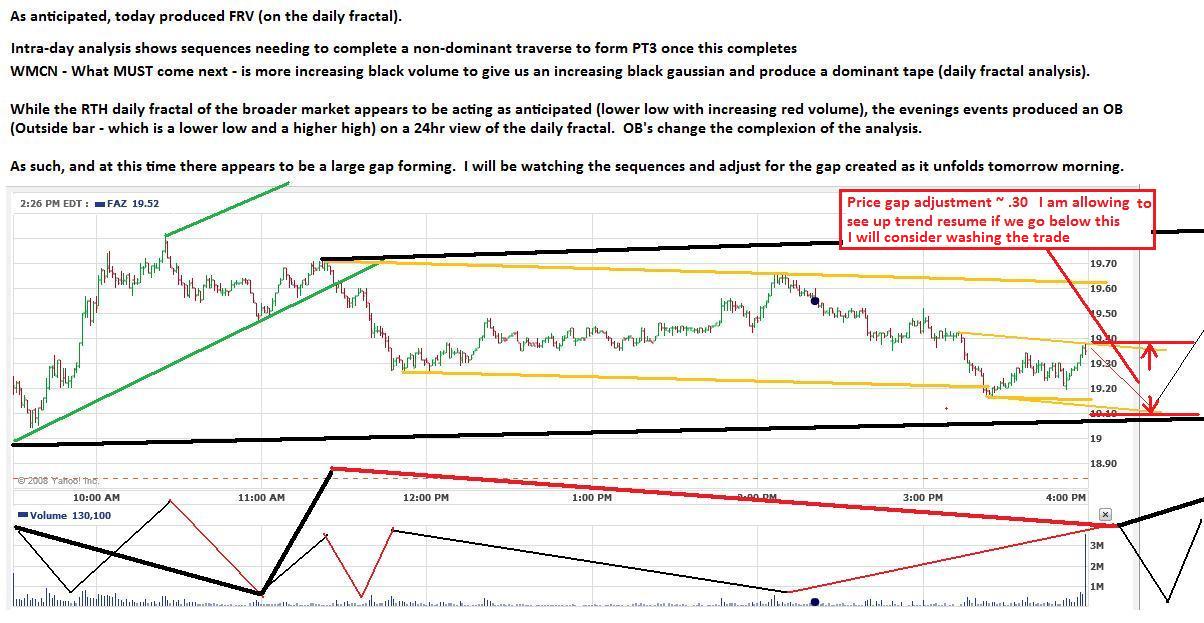
What must come next (for my anticipated place within the sequences for FAZ) did not today (I was looking for Increasing Black Volume) - and the stop took me out in mid-morning for a 0.61/share loss.
The sequences revealed that - my entry was early with point 3 arriving too deep for my initial stop-loss setting (PT3 will be arriving early A.M tomorrow). I may look for another entry then and if so I will come back and share my analysis.
Thanks for letting me share the routine I perform with you on your thread. I enjoyed it and hope to do it again some time.
-
Geez louise! They dragged out that approach to PT3
lol!
-
...After all, The 'opening' gap isn't the only Gap which does not exist.- Spydertrader
Been looking at a few charts... Very cool !!!!!
:helloooo:
-
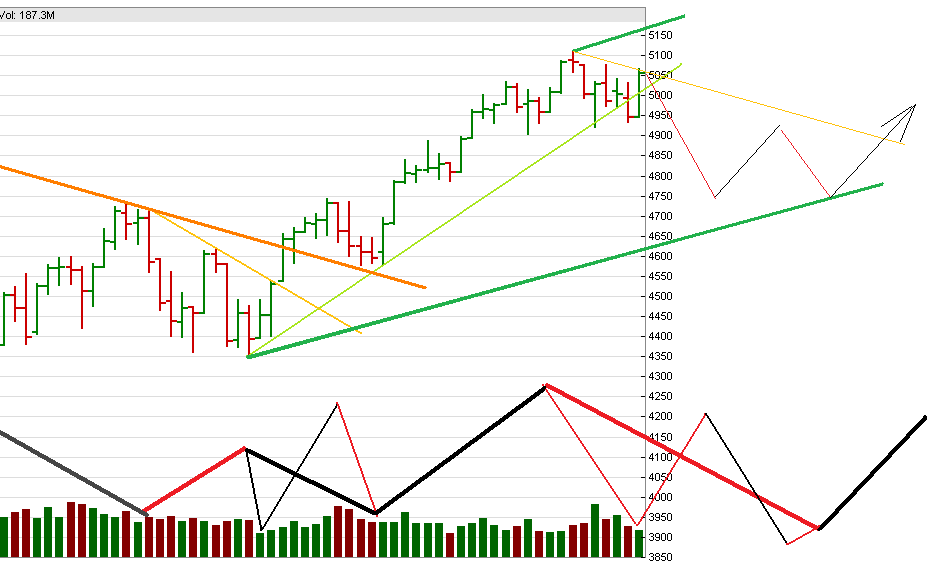
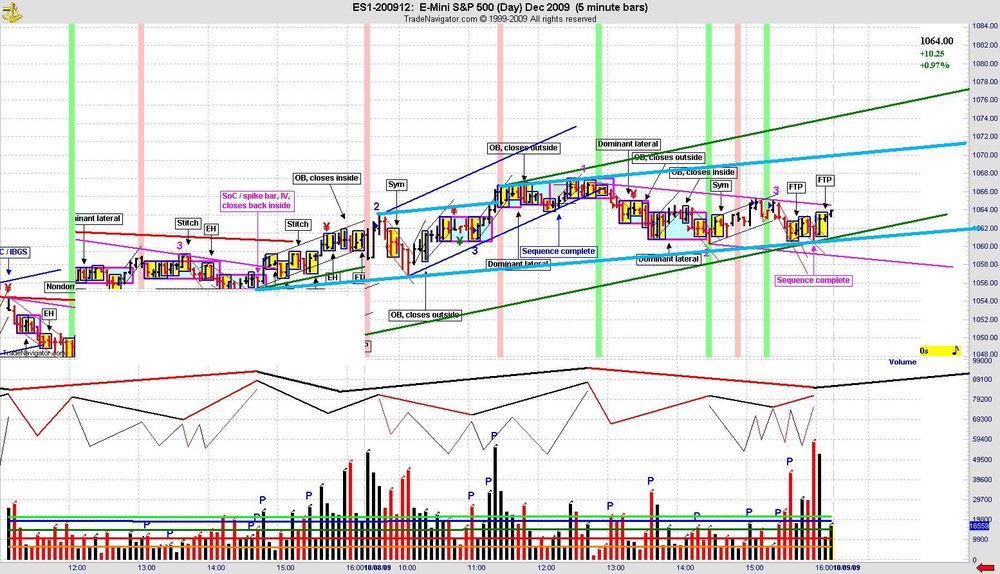
Attached are my updates to the sequences...
-
ehorn,I observed that some of the trendlines drawn by you have their guiding pivots just after the next one or two bars. I that a OK? I am asking because I was told that the pivots used for drawing the trendlines should be well-spaced.
Also, the lines that extend in future - are they purely trendlines or have to added some concepts like Elliot Wave and Wolfe Waves into it? I have no knowledge about EW/WW so just wondering of it is that.
Thank you,
-Bunny.
The analysis, and projections are based on a few key concepts which I observe:
Markets are fractal in nature (larger fractals are comprised of smaller fractals)
There is a demonstrable and consistently repeatable volume pattern on each fractal.
Trends overlap
The annotations are a picture of how I would apply these principles of Price and Volume to anticipate sequences of current and future price movement.
HTH
-
I don't know VSA. But volume is a primary indicator for me. If you don't mind, I will share my analysis. Albeit, without the benefit of larger context surrounding the chart.
-
Hi ehorn,Are you using volume to identify and distinguish dom from non-dom trend? From your posts of FAZ, I presume you are interpreting the dominant trend for FAZ to be toward higher prices. If so, is this a recent change from down to up according to your approach, or do you view the entire down trend from the all time high to be non-dominant?
Best Wishes,
Thales
Yes, volume (and price) is used to identify DOM or NON-DOM. More specifically, the sequences of volume within the containers (Trendlines) of price. This is the cornerstone of the principles and their application.
As mentioned previously, I believe these principles are applicable to any market - and equities is a starting point (some reasons mentioned above). Typically equities use a "culling" process which draws out stocks meeting certain criteria desirable for spotting new trends (a time saver for those who apply the techniques to equities). I am using FAZ here as a quasi-proxy for the broader market in an effort to demonstrate the principles and their application.
Today seemed significant to me in that it appeared that the broader market completed the sequences for this most recent up move, signalling a change in the trend. According to the price and volume sequences, as I have tracked them, this trend in FAZ (current down channel) appears to be also completing and so I am anticipating a new trend (up channel for FAZ) to begin. I am considering this new up trend to be dominant for FAZ just as I consider the beginning of the broader market trend (down) to be dominant.
I also view this trend as a resumption of the movement whos price container began last fall and I consider now to be Point 3 of this larger container (part of the higher [or slower if you will] fractal).
HTH
-
...I have attached some analysis based on the principles of Price and Volume....I have attached some commentary and an update to the sequences...

-
IMO, As one becomes more and more familiar with the routine, MADA becomes a series of sweeps and WMCN questions all day, on every bar, on all fractals. The binary aspect of the routine is that when WMCN does not, one is left with only one answer...
I also believe that as one becomes more and more effective (the goal of learning to learn) WMCN ultimately becomes WWCN...
-
An evening for quotes...
Those who say it cannot be done should not interfere with those of us who are doing it. -
...Hell, some have even suggested I am completely full of shit...- Spydertrader
That is because ......
"When you're one step ahead of the crowd you're a genius. When you're two steps ahead, you're a crackpot. -
I appreciate any real time analysis demonstrating the application of your principles that you are willing to share. Thank you for this example.Best Wishes,
Thales
yvw, Lets see how it goes
Equities are a great place to start for a person interested in studying these principles. They cycle much more slowly than more leveraged intruments do (cycles being the sequences of volume and price). This allows a learning practicioner to examine the principles and hone there routine in a slower paced environment. Then as one becomes more effective in the routine, they can pick up the principles an take them to higher velocity intruments.
-
I disagree.Just wondering if all those pretty lines everywhere actually make real money.
A simple question really. Anyone can draw lines after the fact and post pretty charts after the fact, but that doesn't mean much if it can't work in real-time.
I agree... it is a simple question... Drawing lines in real-time definately helps a trader make money. They don't even need to be pretty to make money LOL!. Anyone is free to draw lines after the fact too. It is a great way to practice learning these techniques.
-
Yeah, I also noticed some bars being below PT3 in the first part of the AM traverse (if that's what you mean). I used the binary approach for deciding what to do. I ruled out all other possibilities, leaving me with a 5 point profit on a PT3 entry
Gab-removal would be a very nice feature in TN.
Nice trading... It is very cool to see how the market "sync's" between AH and RTH.
I believe Genesis is going to be at Vegas... I will add that to the list of Q's
-
I am not so much an equity trader, but I believe the principles I espouse are effective across all liquid markets. I have attached some analysis based on the principles of Price and Volume.
Best wishes,
-
My take on 8/10-2009.Comments welcome
Thanks for posting - Looks good... I was early on that PT3 call. I jumped from the DOM LAT onto a NON-DOM FF. When I take your excellent chart and remove the gap (and butcher it in MS Paint) something interesting appears... Sometimes I miss Ensign... (it had Gap removal built in - one click of the mouse).


The Price / Volume Relationship
in Technical Analysis
Posted
My view of the day... Groovin with it!