
Welcome to the new Traders Laboratory! Please bear with us as we finish the migration over the next few days. If you find any issues, want to leave feedback, get in touch with us, or offer suggestions please post to the Support forum here.

ehorn
-
Content Count
167 -
Joined
-
Last visited
Posts posted by ehorn
-
-
Very cool!
I am reminded of the movie "The Astronaut Farmer"....
Charles Farmer: Hey kid you know what you want to do when you grow up?Child #2: I dunno.
Charles Farmer: Well better know what your going to do, before someone knows it for you.
Will Beacon: Mr. Farmer, how do we know you aren't constructing a WMD?Charles Farmer: Sir, if I was building a weapon of mass destruction, you wouldn't be able to find it.
-
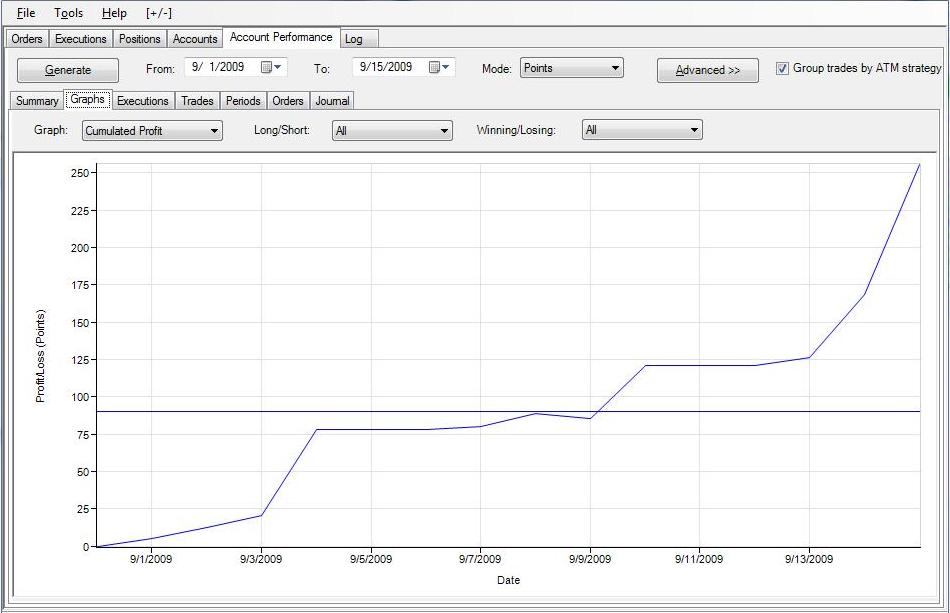
A neighbor of mine lost his job (upper mgmt with a tech firm) in the beginning of the economic fallout last year. He decided to give some attention to these techniques. He is a modest fellow, but he just emailed me a snapshot of his equity curve from 9/1 - present day with a quick note.
I asked for his permission to share.
He mentioned in his note that he does not think he will be looking for another job anytime soon. lol!
I believe this brief snapshot equity curve demonstrates someone who is becoming Operational.
-
A very wise man has said; "To get from square one to operational takes time and patience."
tapes? traverses? channels? These are all constructs for use in becoming operational...
Increasing, Decreasing, Continuing or Changing... and WMCN...
We perform the routine so that we may develop and refine our ability to become operational. Spydertrader has provided us all the tools needed to do this and through effort and experience we become more effective and efficient.
When emotions override logic step back and take a break. The market is the same yesterday, today and tomorrow.
Developing the routine and learning to learn is what the journey entails.
But enjoy the journey. It is meant to be enjoyed.
-
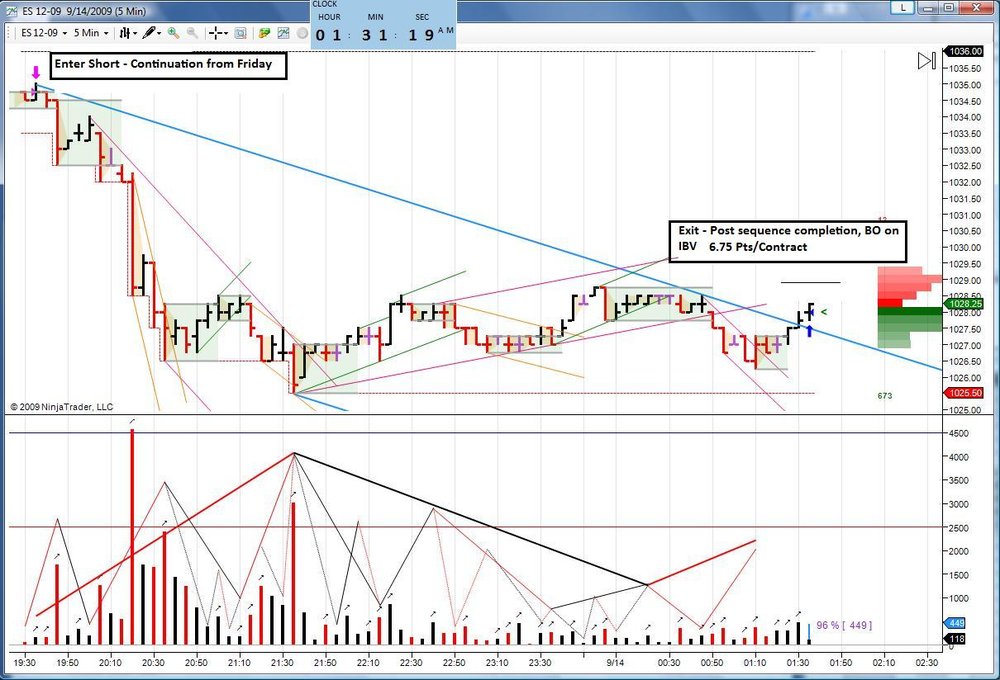
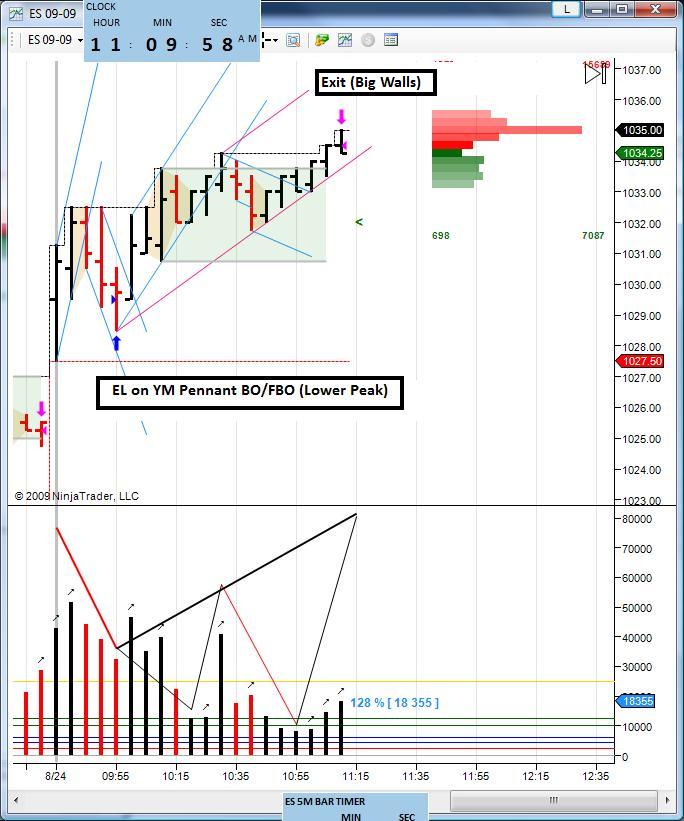
An AH evening trade...
-
-
NYCMB's recent inquiry to ehorn attracted my attention because he posted that chart validated by Spydertrader. You expressed your doubt too, so I thought to reset the discussion to a calibration point. I have no intention to increase anybody's frustration.I think he is a she...

-
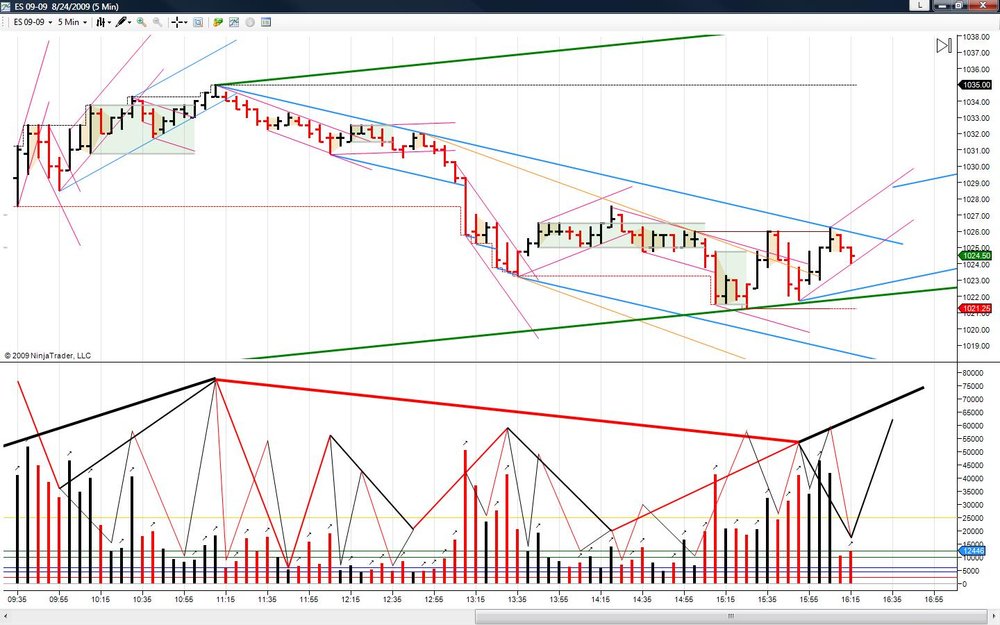
With the greatest of respect, referring me to previous posts that I have read 100 times does not help. When someone remains unable to understand something it is often beneficial to offer an explanation from a different perspective or even, dare I say it, an annotated illustration. Responses of the nature "it's all been posted here before" serve only to frustrate.I can appreciate your question and enjoy it because it makes me think. So keeping it simple (and considering that critical component of M is still being refined) then I will humbly submit my analysis (just based on PT2 analysis only):
If THIS was a Traverse (which completed Friday morning) then the down traverse which is being built requires a PT2 outside of the previous up traverse. We did not get that on Friday. Now If the preceding link is in fact a channel, then it is quite possible that what was constructed on Friday was Pt1, 2 and 3 of a down traverse.
Frankly, I may very well be stuck in SLOW MOTION coming off of the summer pace here. But my PFC is established and I will continue on with the MADA asking WMCN as each bar forms.
-
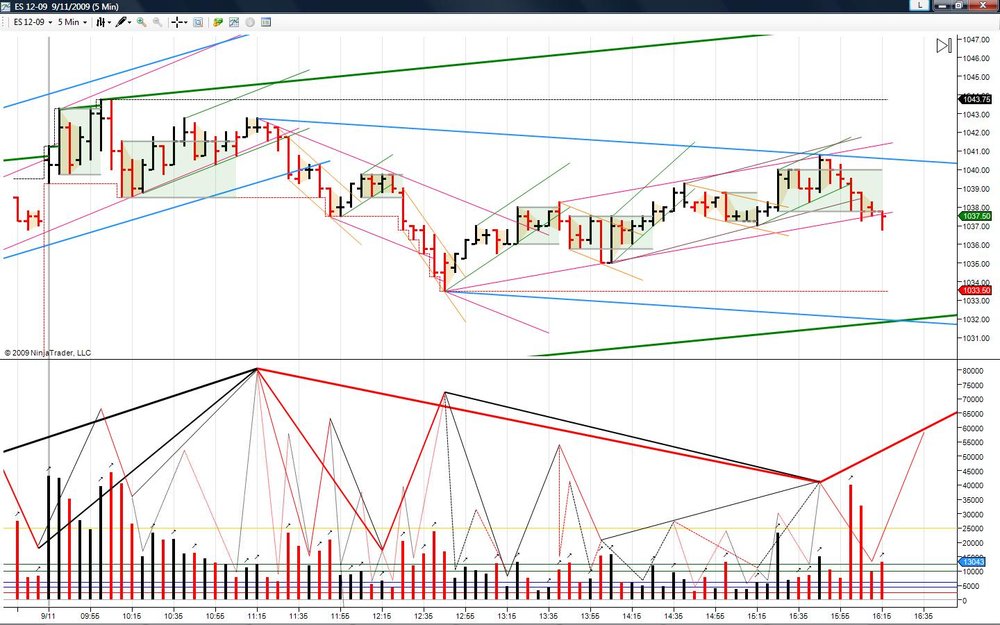
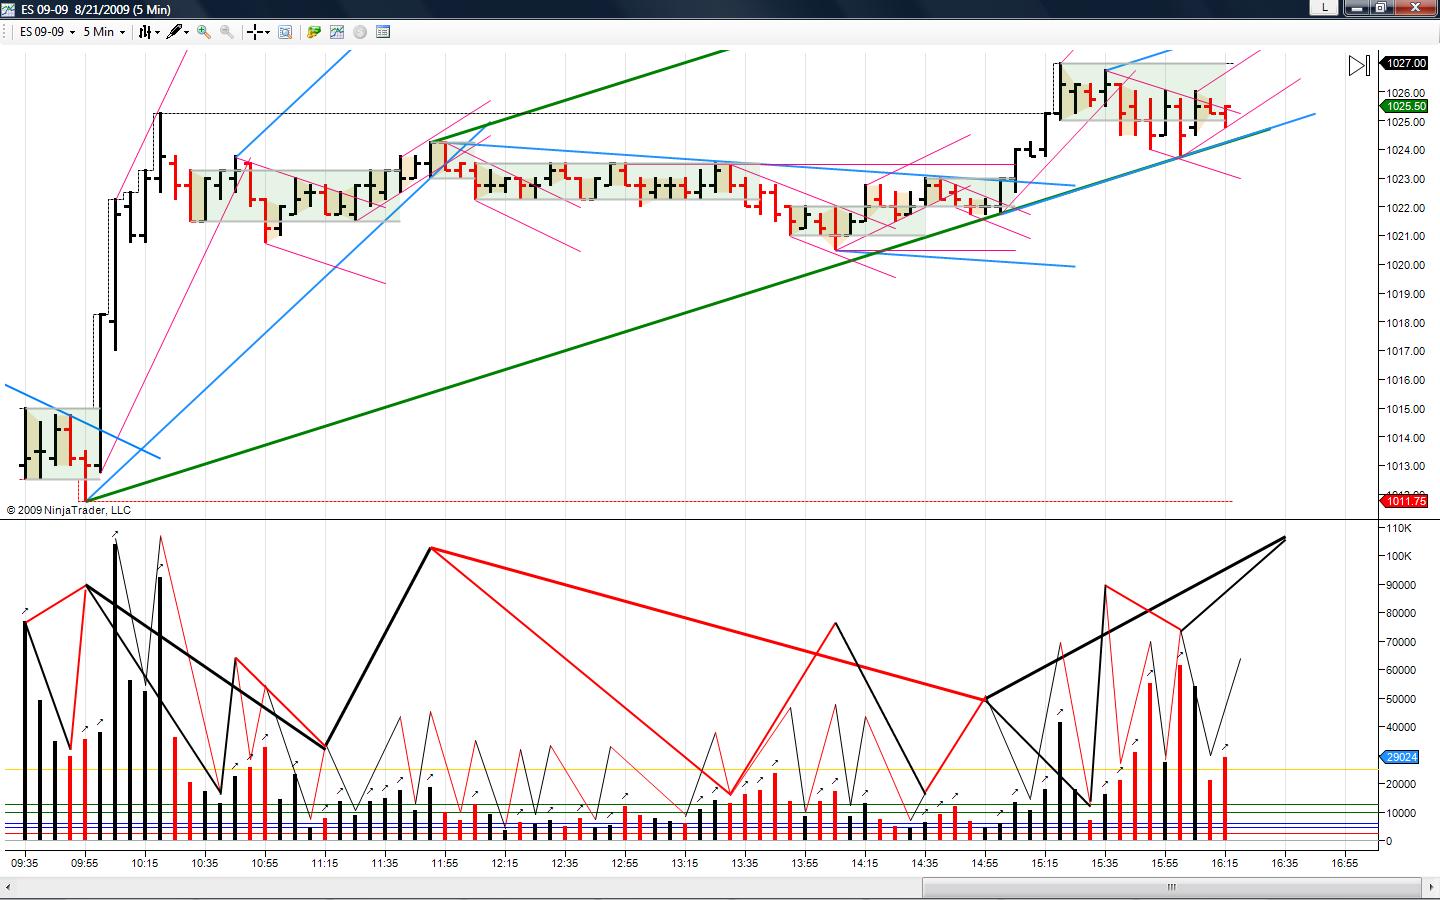
With Spyder's definition of tapes on page 1, post #5, could someone PLEASE explain how on earth the blue trendline could be considered a "tape" and the green trendline a "traverse"??
Hi dkm,
IMHO, Post #5 gives us a primer for the building blocks (i.e. BBT's).
As Spydertrader mentioned earlier,
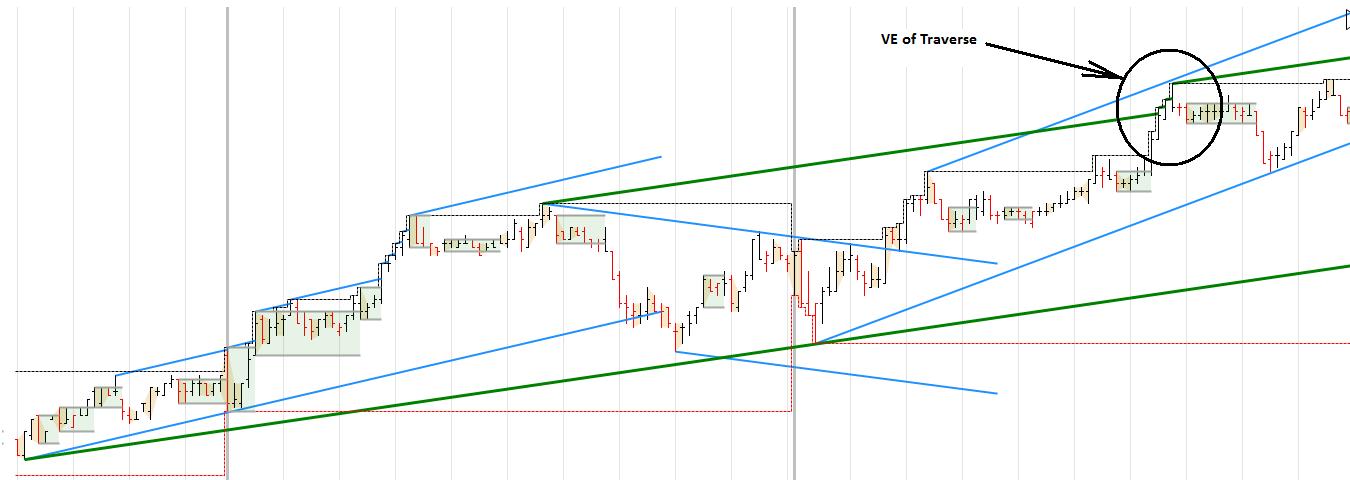
With that, I have annotated the story I read for Friday...
-
Hi ehorn,Does the green trendline represent "Traverse"?
Does the blue trendline represent "Tape"?
Please comment. TIA
This is how I have annotated it, yes.
-
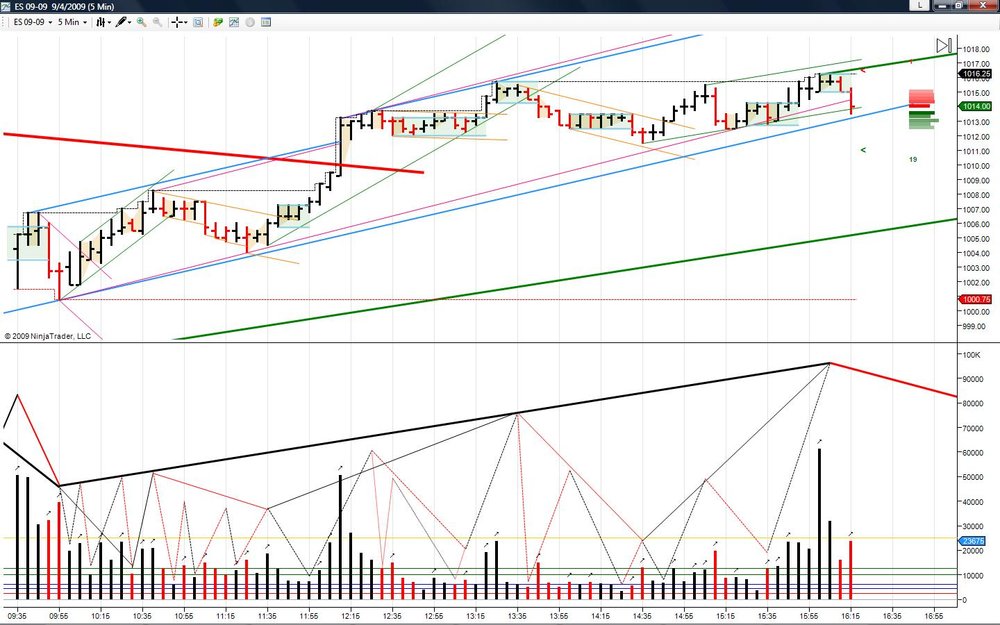
I see several visible fractals on the 5M chart today...
-
Hello James,
It appears that recent attachments "view counts" are no longer being displayed. Older attachments seem to report the number of views, but newer attachments are not displaying view-hits. I am not sure if this is an issue per say or a possible design change. But I thought I would report the observation nonetheless.
Thanks,
-
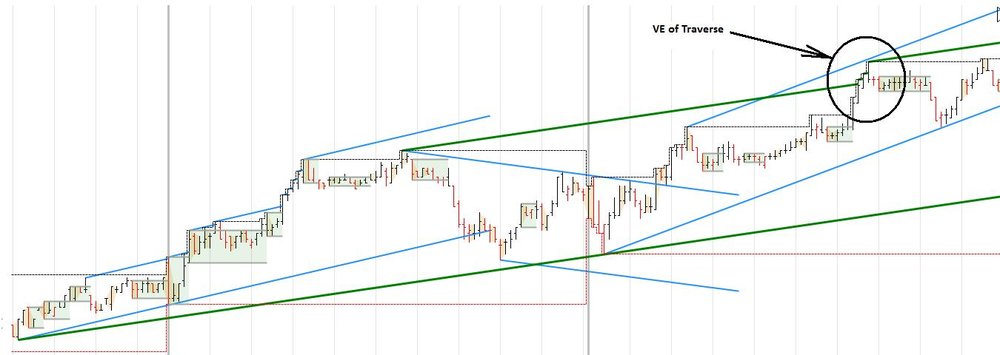
...Comments and your thoughts are greatly appreciated. TIAFWIW, I had a VE in that area....
-
...I don't think I missed any other factors that may influence the termination of medium B2B.For my annotations, it took the day to complete medium B2B.
-
Were you just referring to "hold" with the reference to flaws, or something else?Sorry for the delay in responding Ez - IMO, the segment had the appearance of non-dominance.
-
Thursday, September 3, 2009.Gets my vote... Ending the day in that DOM lateral still has me looking for PT2 confirmation on the 5M tape though
EDIT: Better double check my data provider on that one @ EOD (No LAT). Though personally, I am not comfortable calling 15:15 ET a PT2... So PFC has me looking for PT3 of tape then IBV to PT2 of traverse.
-
I always thought the site looked great. But 4X improvement is no small benefit. Nicely done and thanks for supporting this great community.
-
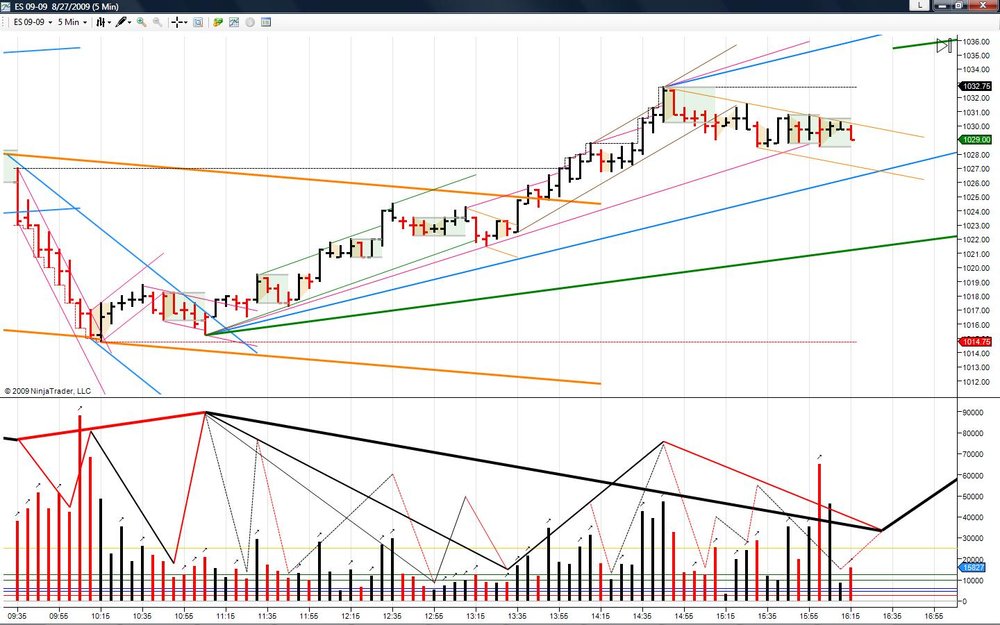
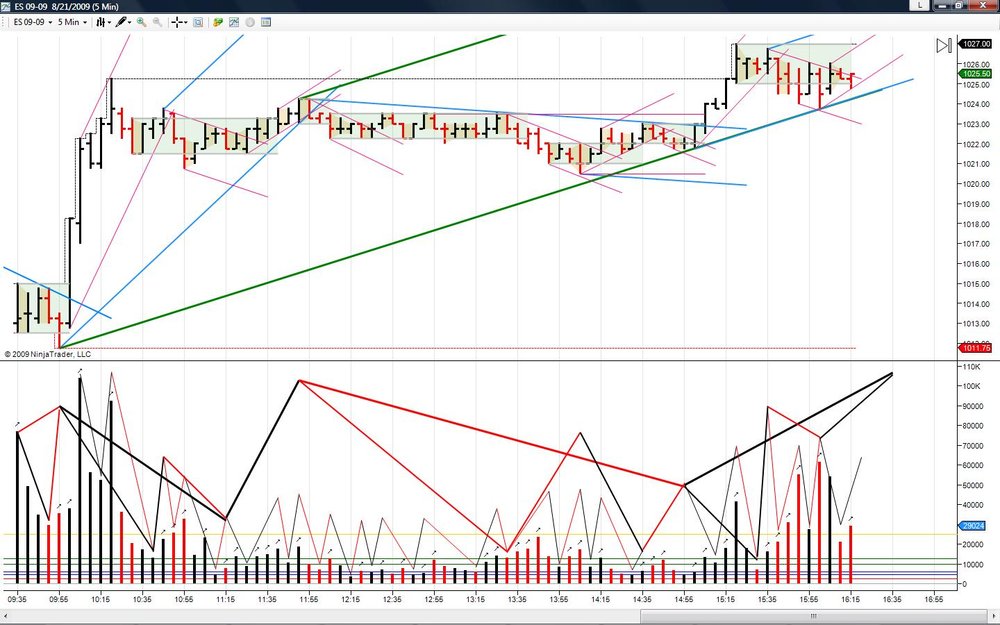
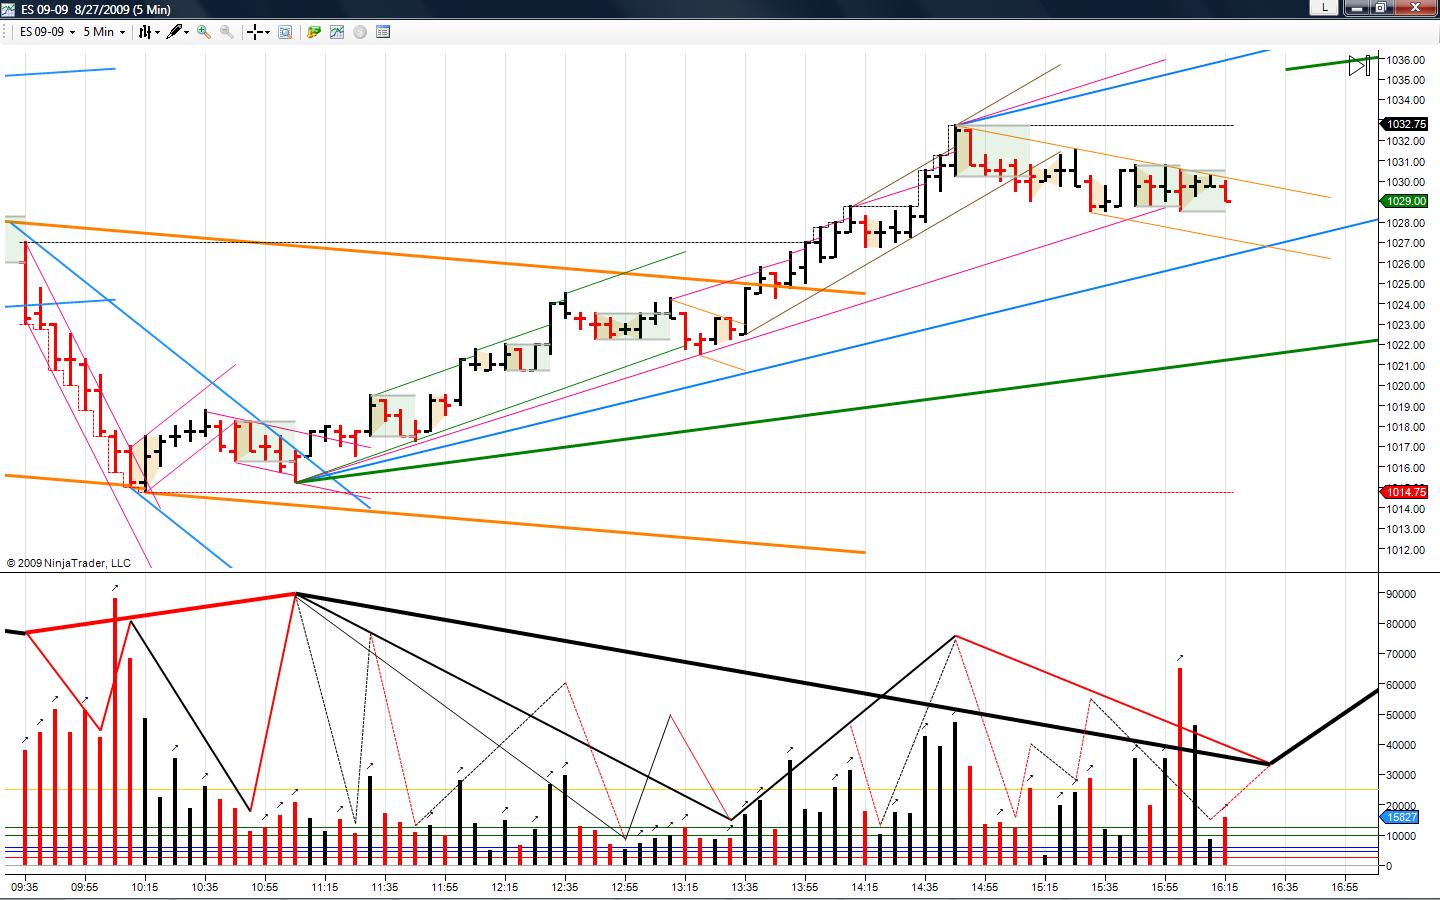
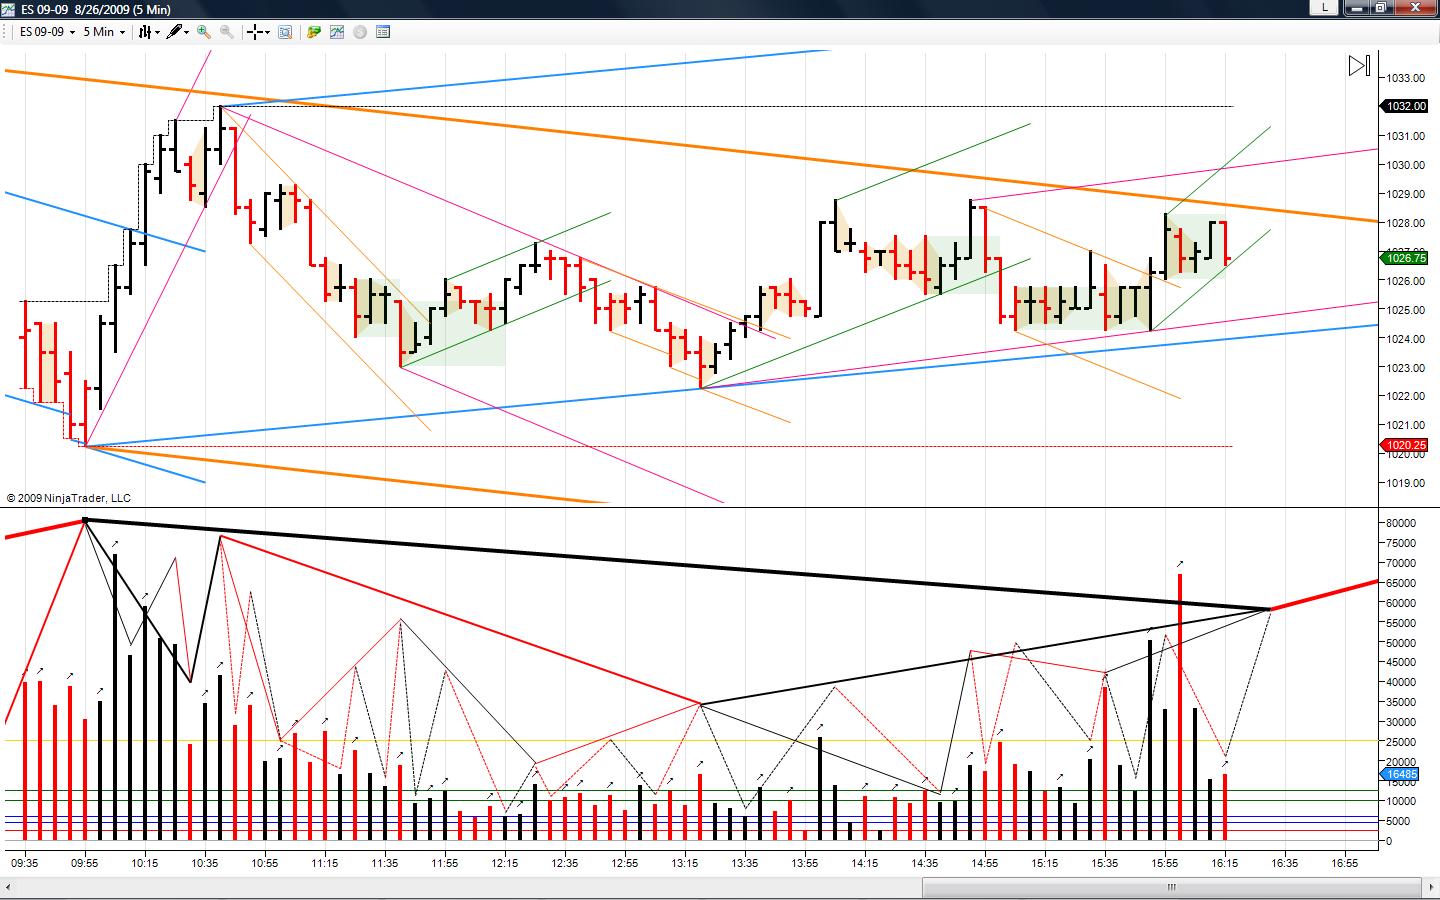
My view of the day...
-
Nice to see folks posting charts - starting to feel like 'old' times.
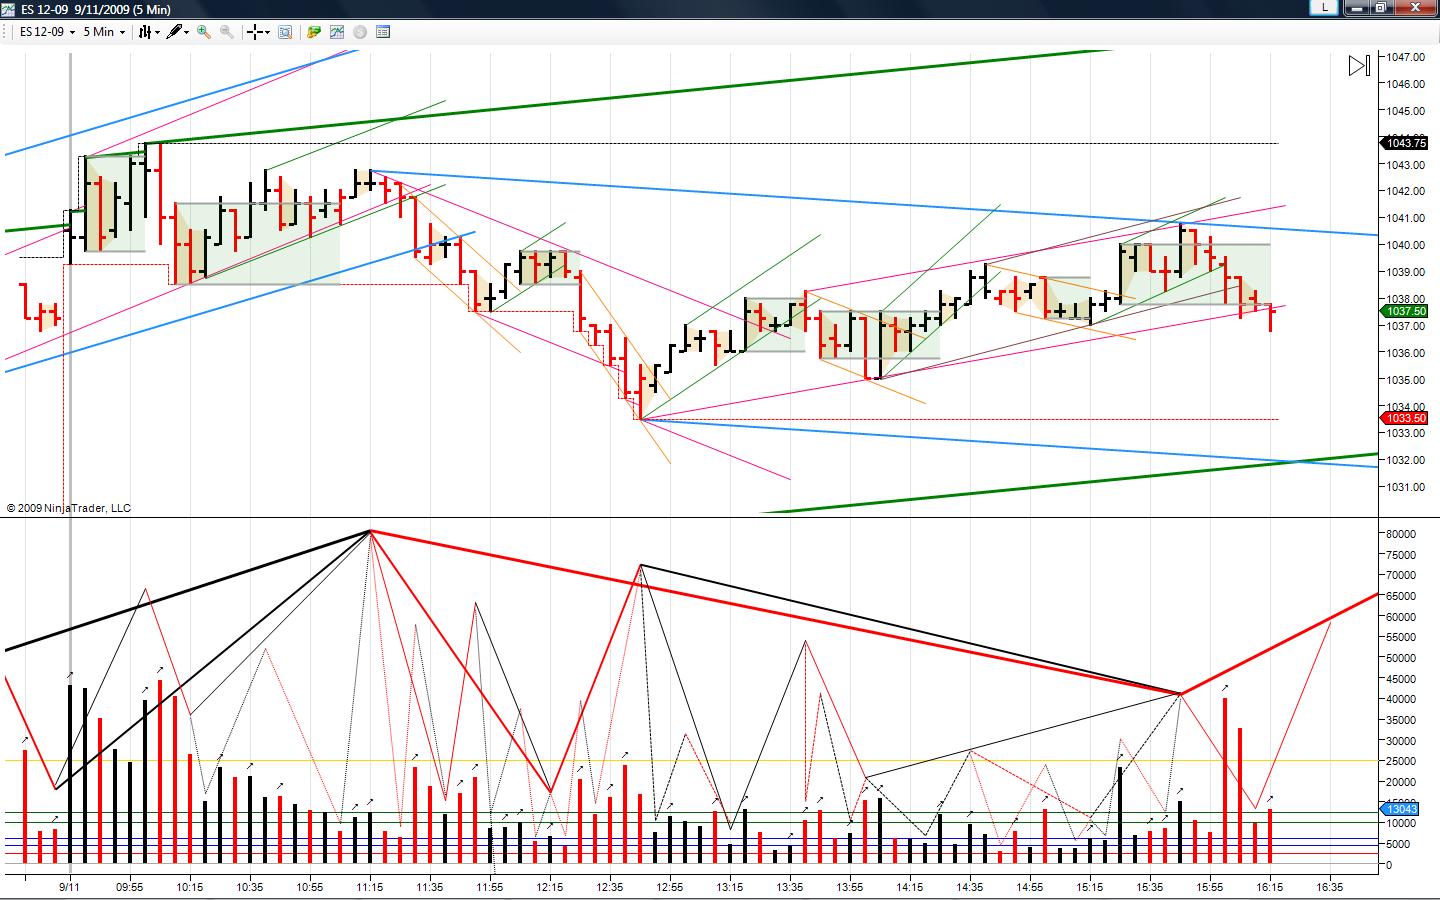
My view of the day...

-
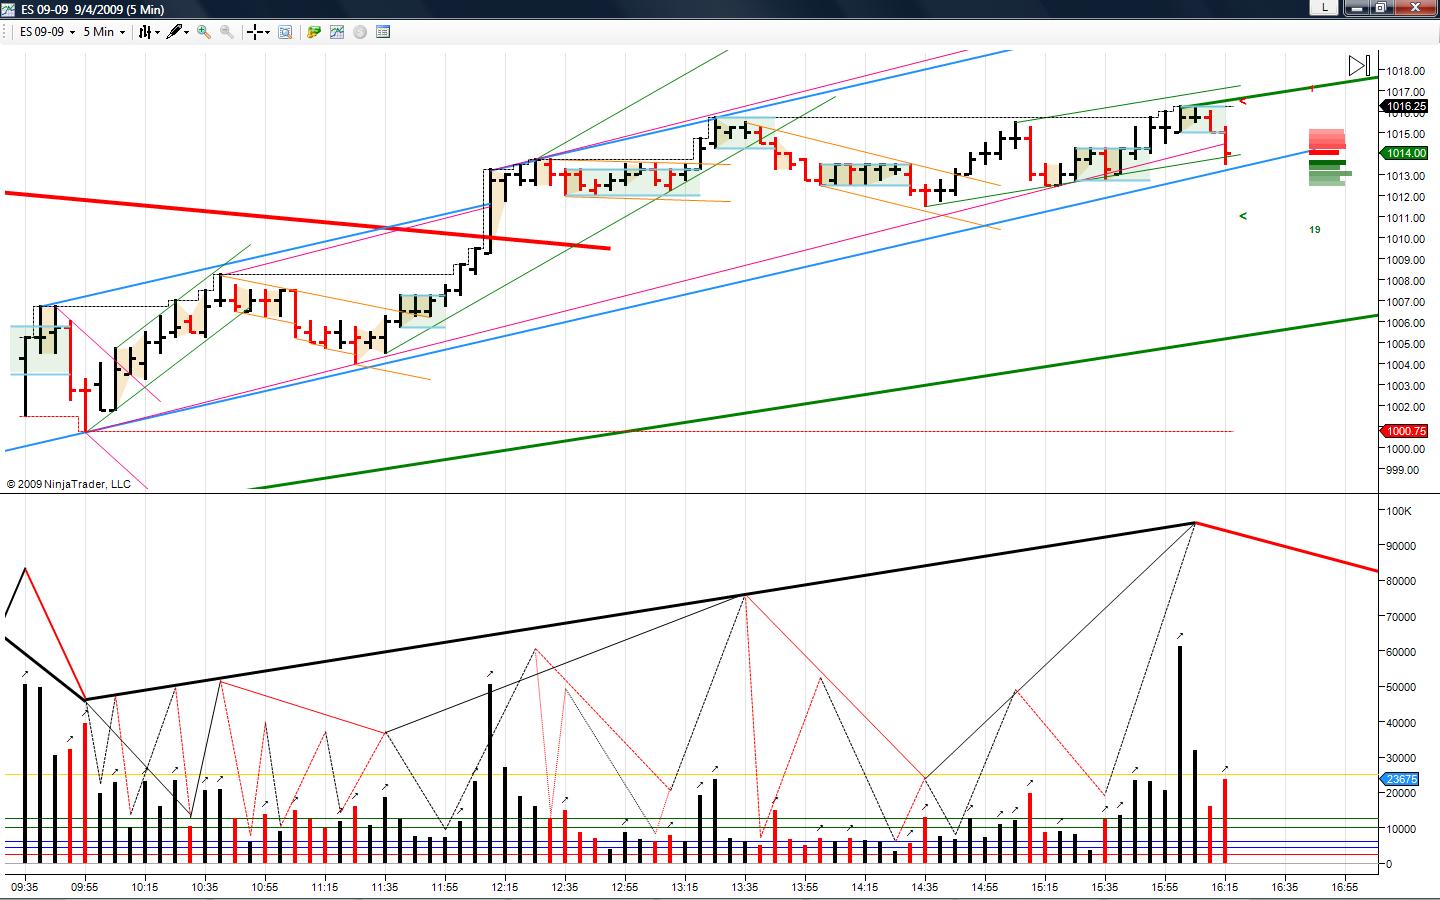
My view of the day...
-
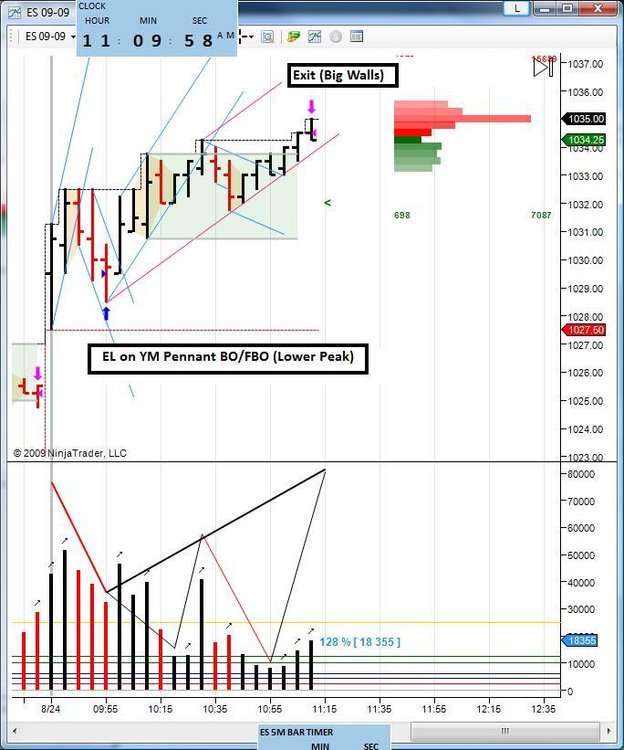
Morning Trade... Doing the MADA - Gathering Data Sets - Continuation or Change...
-
... somehow or rather, 11:50 (8/21) doesn't seem like a Point 2 of the Traverse to me. Perhaps for the same reason, that 12:35 (7/15) wasn't. In fact, I can't seem to put even the skinny gaussians on the volume pane for the last two trading days. Feels a bit freaky.Hey romanus,
Thanks for sharing your thoughts. I can see your view. Perhaps I have annotated sub-fractals. I still find it astonishing that the sequences can be observed within internals.

-
Volume leads Price. Always. And without exception....Succinctly, unless and until the components of one fractal reach completion, the next slower fractal cannot begin. It trading terms, unless and until the Volume Cycle Sequences reach completion, the current Price Trend cannot end...
QFT... Every Fractal contains the exact same components. Learning to observe them manifest is the process of differentiation.
-
-
I'm curious what best bounds a trend:Interesting question. For me, an FTT of something becomes a PTn of something else. So logically (for me) this FTT is the place to drop the TL. Geometry does not always allow one to place a TL where a sequence completes, but IMO it seems more important that one does things consistently to be able to provide him/her the view required to see continuation/change.


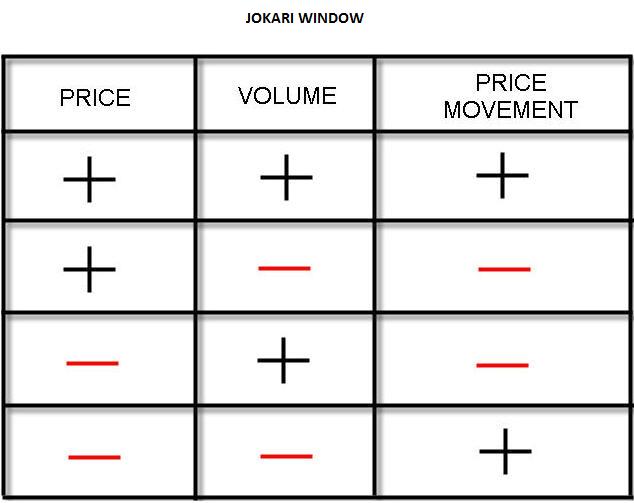
The Price / Volume Relationship
in Technical Analysis
Posted
The curve averages out to about 5 points/day (roughly 30-50% ATR for the last 2 weeks) @ 5 contracts.
We spoke about how he is applying the techniques and, to paraphrase, he says he uses these principles to help him identify the trend (volume). He then looks for an FTT and once he thinks he has spotted one he makes and entry with a small stop and then tries to sit on his hands. He also draws in an anticipated higher fractal TL (one less steep) to help him hold longer which he says eases his emotions as price retraces from PT2 to PT3. Once he is in a developed trend he waits for price to break the TL and exits.