
Welcome to the new Traders Laboratory! Please bear with us as we finish the migration over the next few days. If you find any issues, want to leave feedback, get in touch with us, or offer suggestions please post to the Support forum here.

ehorn
-
Content Count
167 -
Joined
-
Last visited
Posts posted by ehorn
-
-
I can only share my views for your consideration.
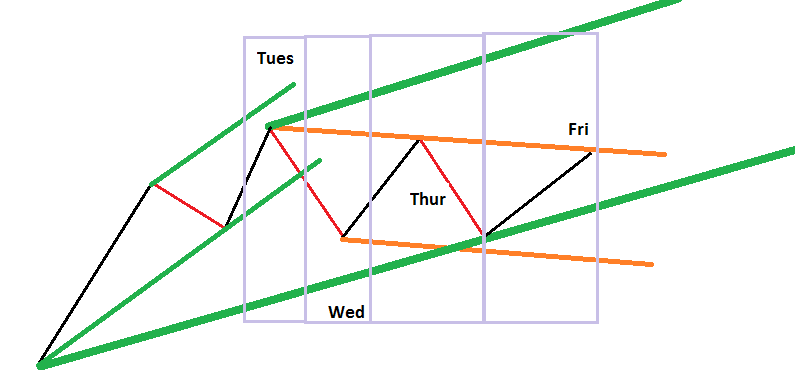
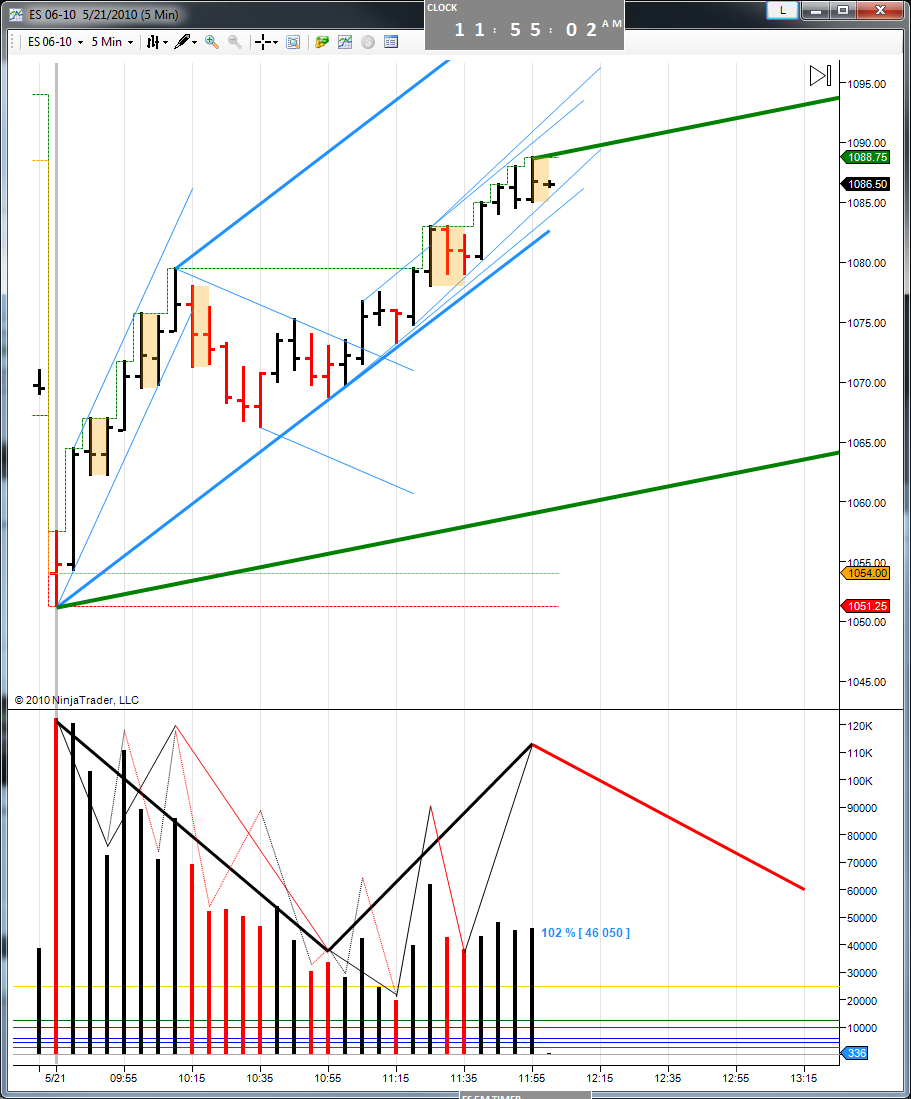
Consider the attached picture. It contains 3 levels:
Tapes (Black/Red)
Traverses (Medium Green/Orange)
Channel (Thick Green)
If you wish, label the PT1,2,3 and FTT and consider how this applies to last weeks market formations.
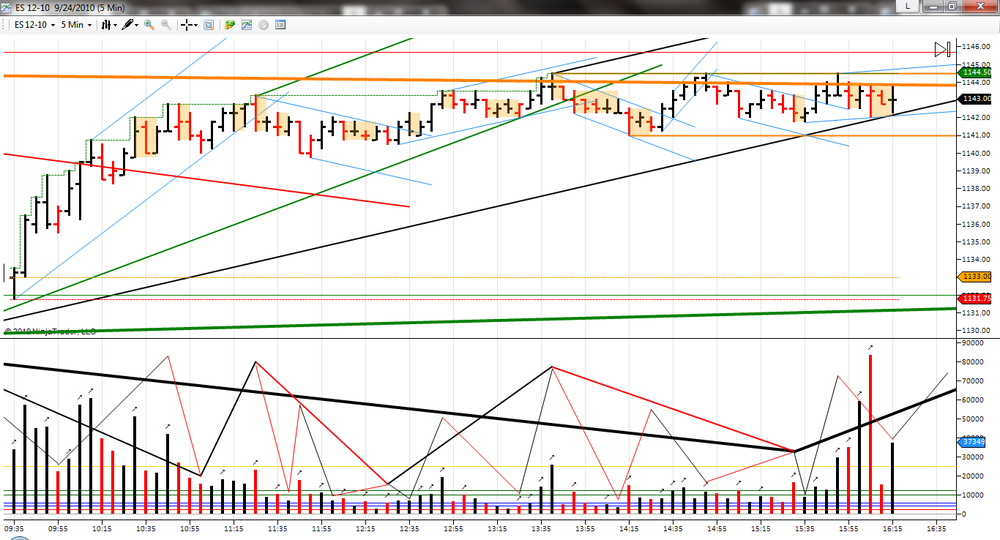
Then ask yourself, do we have a PT2 of the latest up traverse yet... Did Friday give us a PT2 on a 5M fractal?
HTH
-
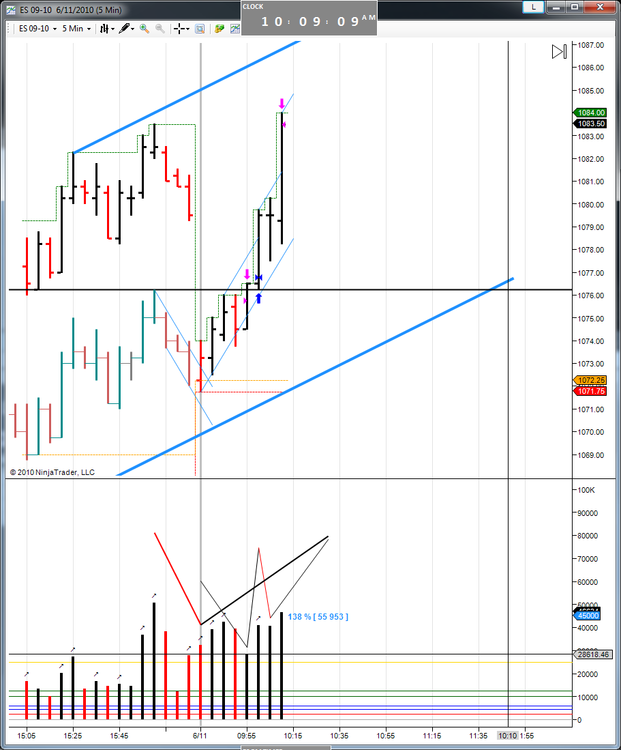
ehorn - really appreciate you putting your charts up.Question - you have a tape level (finest level) B2B opening the day.. ending around 10:45. From the open to 10:45 there are 4 black peaks. Could you detail out the analysis you did as each black peak appeared in real time?
e.g.
peak 1 - not an FTT ... nested volume sequence not complete.
TIA
YVW, I am happy to share my thoughts.
Nice observation and it is true... All peaks are not created equal...

Peaks and troughs are always informing the trader... But some peaks cause one to take notice more carefully than others. In particular, where those peaks occur (both throughout the day and with regards to where one finds themselves within the sequences). These particular peaks are showing us a gradual pace slowing as lunchtime approaches (typical of the standard catenary distribution).
So say a 5 minute fractal trader is examining peaks, and lets say a 5M traverse level trader is performing the routine - He/she knows what is needed first before sequences can possibly complete. We need a PT2 and a PT3 and then a return to dominance before one should look for change? yes?
What do we know about PT2's...? Where do they need to form?
Some days we have nice pace and/or we find the market poised in a location (with regards to TL's) where we can zip right through the nest to get where we are going Pt1, Pt2, PT3 and FTT in little time.
Other days we see how the nest elongates (like an accordian being stretched) as we make our way from PT1 across to the previous TL's seeking our new traverse level PT2.
IMHO, Friday is a nice example of how sub-fractals nest themselves on the way to a PT2 (on 5M traverse level).
IOW, While I have shown multiple fractals annotated for Friday, I think of them as sub's as we make our way to a PT2 of the traverse. So from a 5M perspective, it was one long tape moving towards 5M fractal level traverse Pt2.
HTH,
-
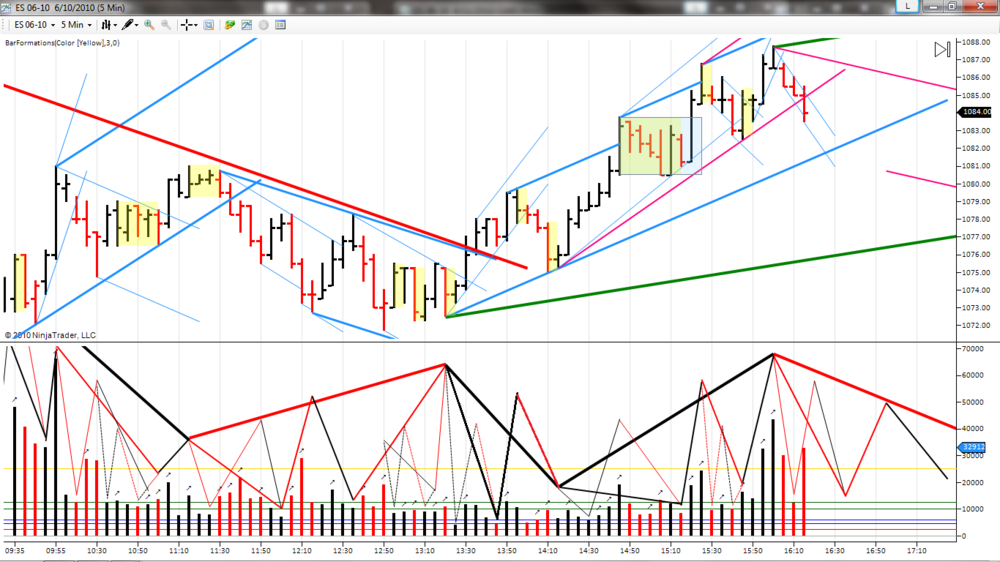
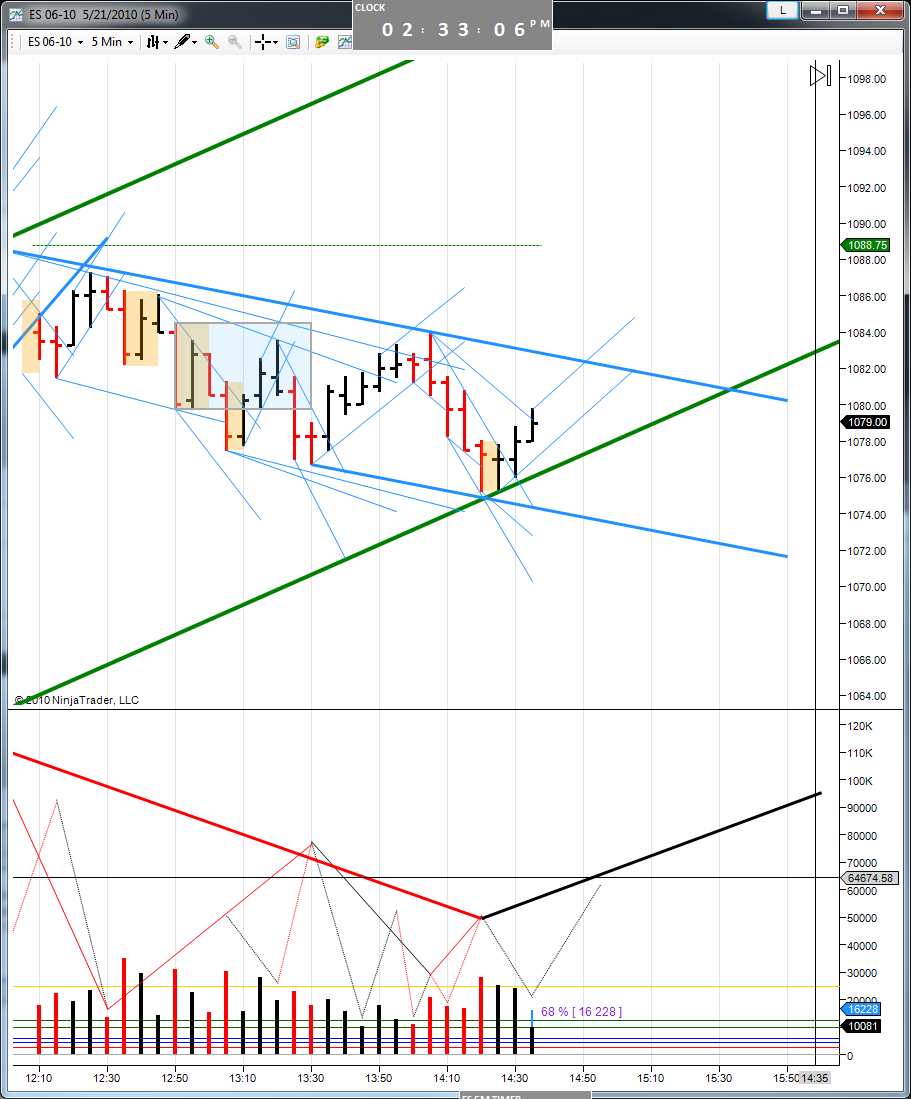
My view of the day...
Have a nice weekend.
-
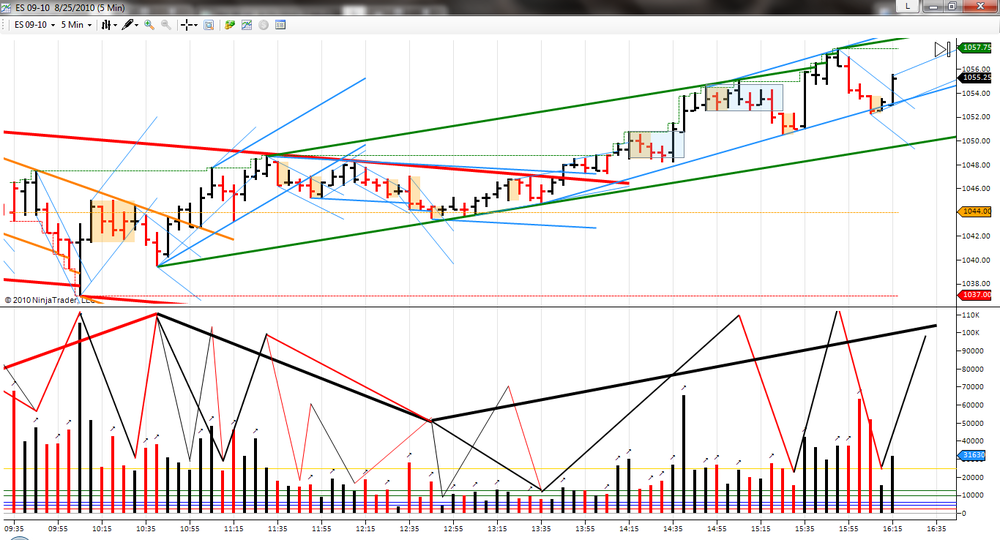
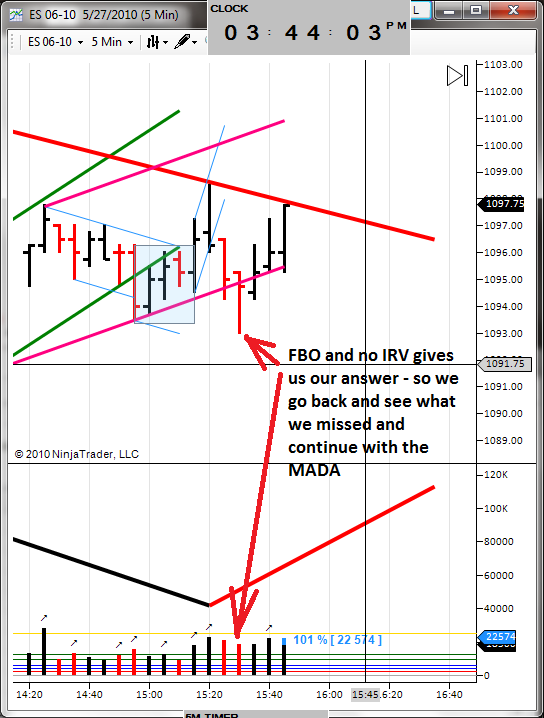
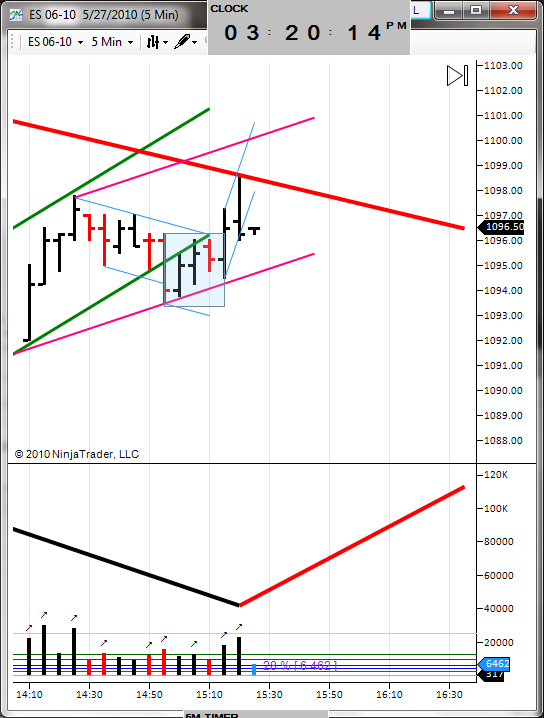
OB at open today said (to me) "you jumped"
Making my Orange Traverse was just a tape and making PT3 of traverse 15:45 ET.
Thoughts; A Pennant BO (1 bar) on IV does not constitute a return to DOM on 5M tape.
So adjust and pick up the routine.
Who can complain at this volatility. Makes the working days a bit shorter.
Have a nice weekend.
-
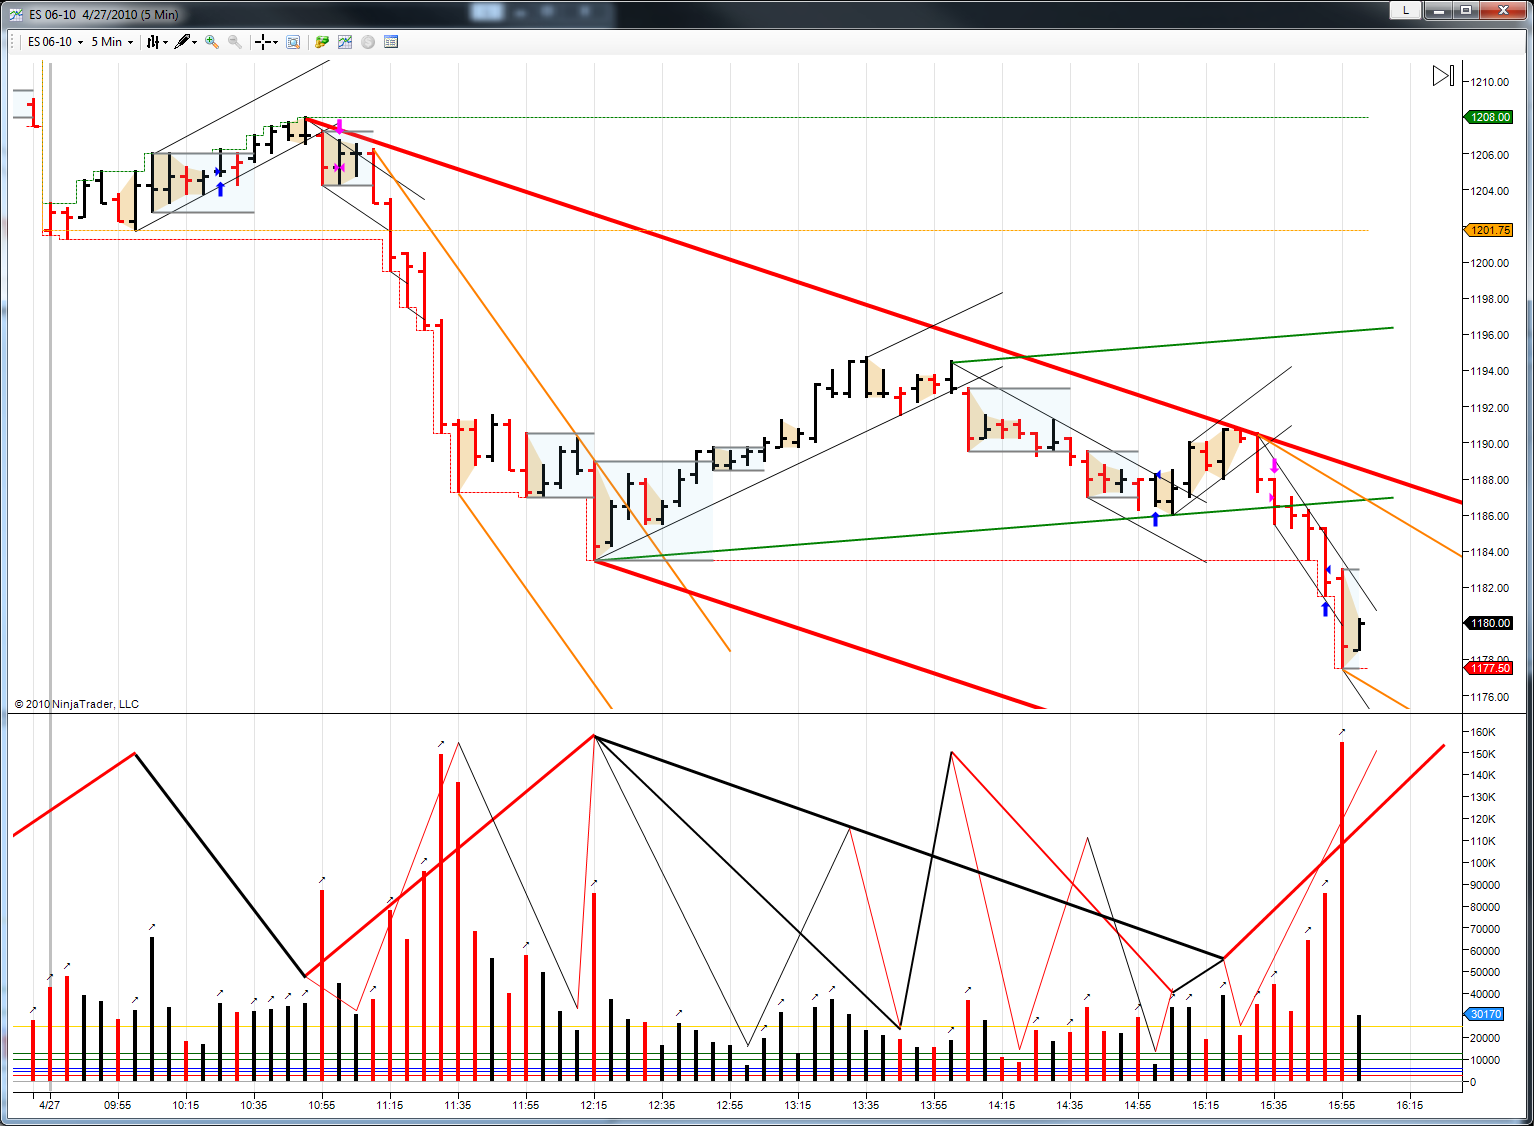
My view of the day...
-
My view of the day...
-
Even birds understand fractals
-
PFC Has PT2 looking for PT3.When WMCN does NOT (according to each persons MADA) then CP4 and get on the right side!
Have a nice weekend.
-
My view of the day... Didn't roll it over.. PFC Has PT2 looking for PT3.
-
Market was kind... gives us signals that WMCN did NOT... lots of time to wash this one and mark it for debrief and review to find what one missed.
-
Sequences completed? WMCN?
-
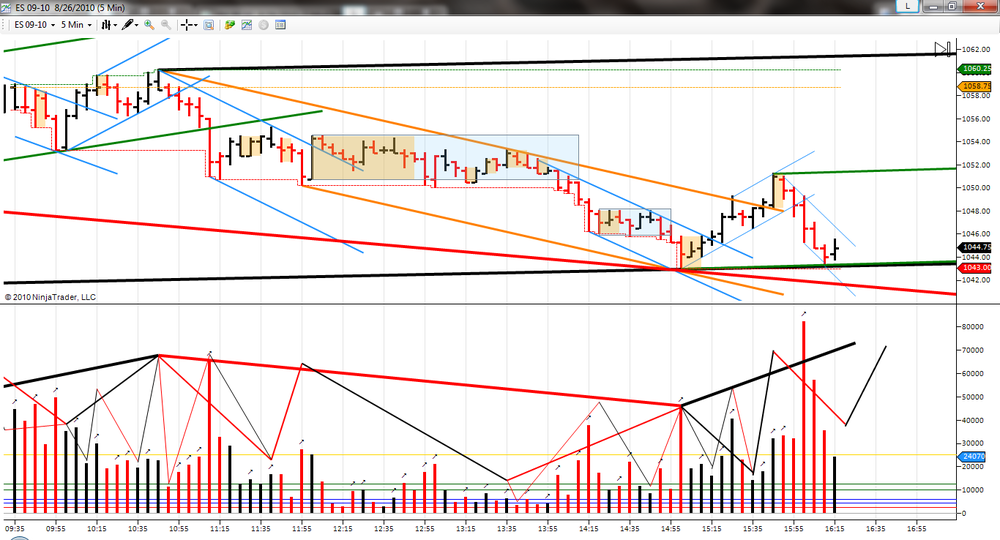
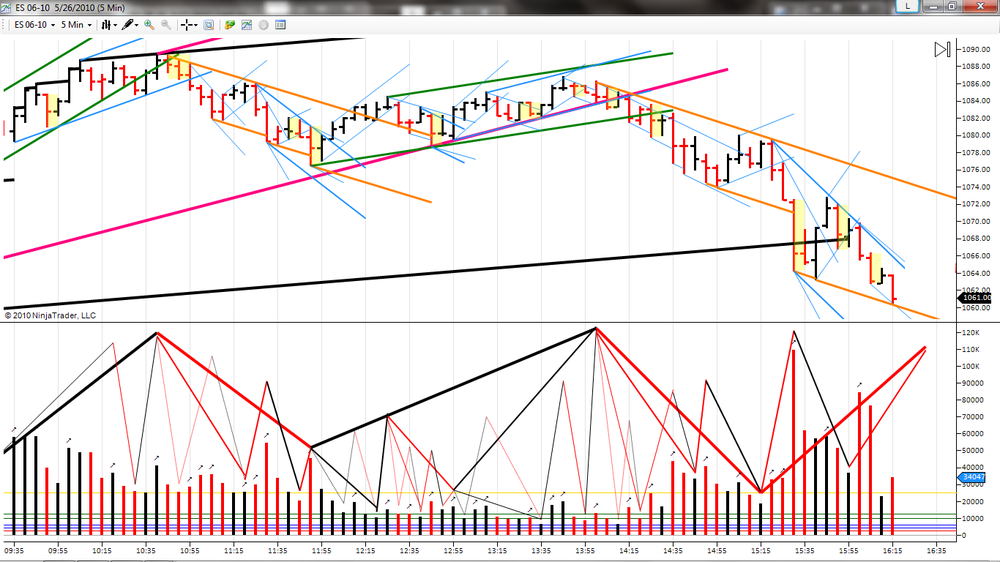
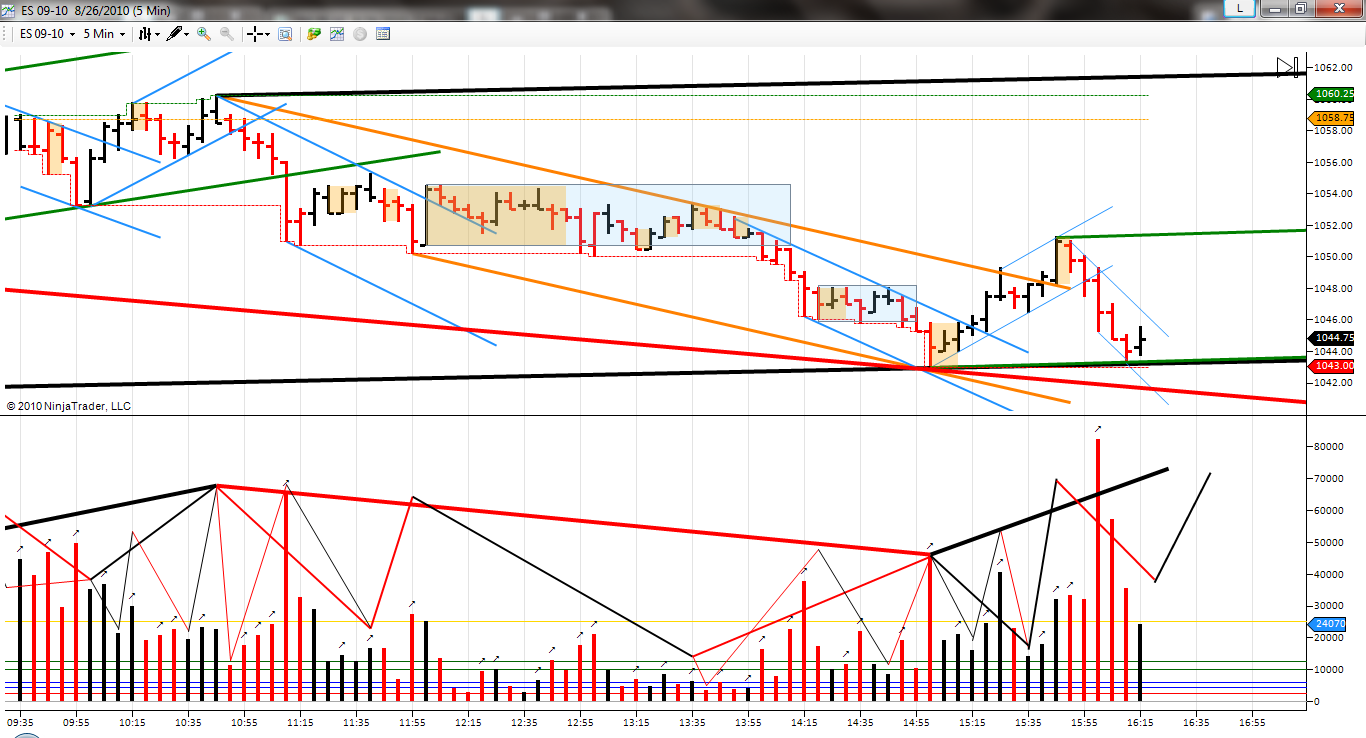
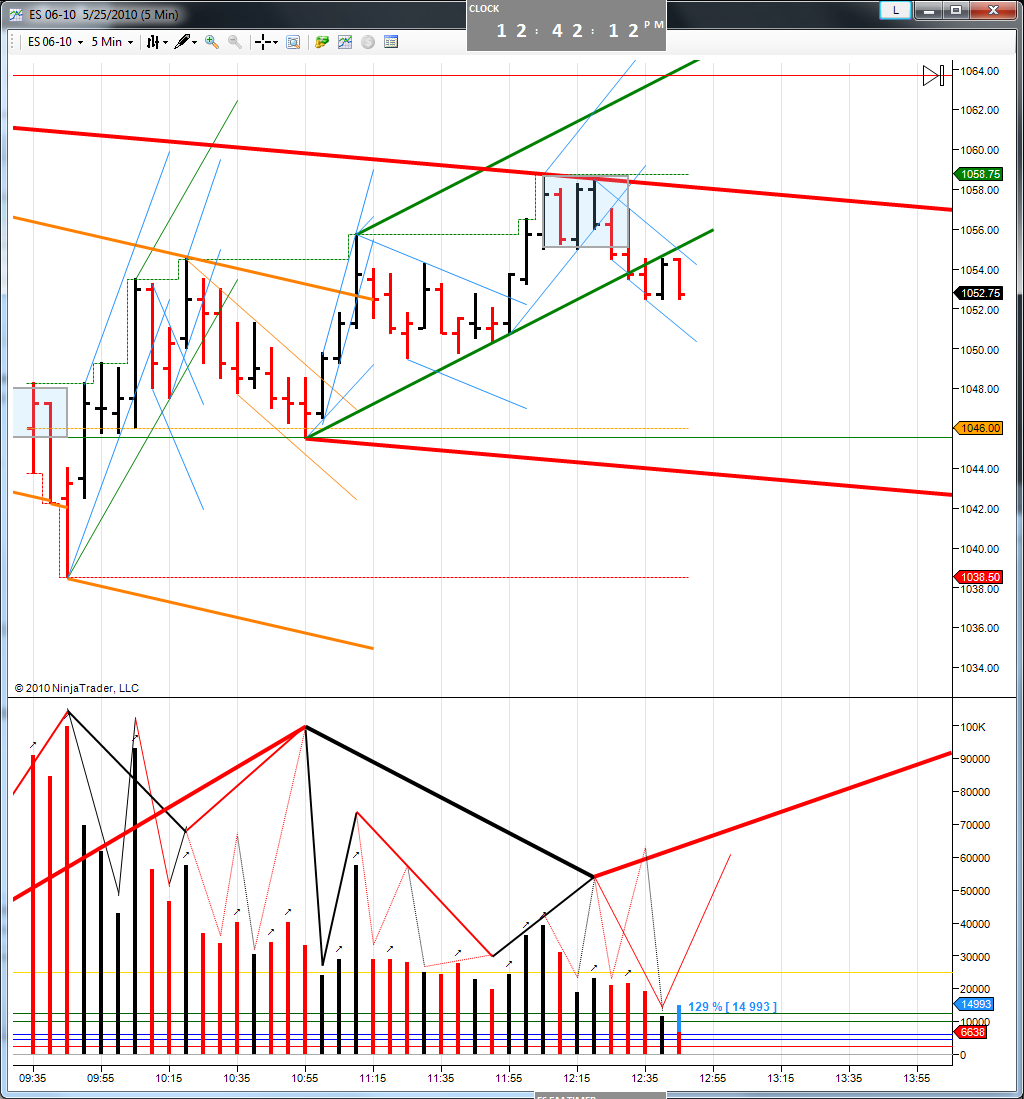
A 5/26 debrief of Volume and Sequences informs me that I jumped off the midday down traverse too early. I see FTT @ 12:55PM ET.
-
My view of the day...
-
My view of the day...
-
I observe that every fractal develops in the same manner (pattern). Some fractals can be hidden or highlighted (depending on pace), but the sequences are always the same. Once all fractals for a given trend have completed, then the trend completes and a new trend begins. HTH
-
My view of the day... PFC has DOM lat looking for PT2 of accelerated traverse

-
Congratulations! Nice trading!Thanks,
Crayola shows the offer (I focus on), what was taken (thick), and what was left (thin). I should have stuck around for that PT3.
The anti-whipsaw would have been the reversal - not a wash. So PFC (as I see it) has DOM lat, looking for FF completion and PT2 of DOM traverse. Have a nice weekend.

-
In this case I don't understand what did you mean with your 1150 am edit "EDIT: 14:40 OB was a wash...". Where did you see the previous two reversal points: the "long", and the "short" before that "wash"? I noticed on your chart that r2r, but you seemed to expect it to be followed by a b2b.3 actions today...
Enter Long (bar 2)
Reverse Short (posted the chart snippet)
Reverse Long --> Exit (wash trade on OB)
In RT, my decision and action (for my trading fractal) was incorrect in this area (14:10 --> ET) - the market confirmed this with the OB - so I washed the long. The edit was a notification of the error made in my routine. HTH
-
Is it a traverse or tape?--
innersky
I annotated it as a traverse with PT2 @ 13:30 and PT3 @ 14:05 (Eastern times).
-
It might be interesting to discuss why at that point the right side of the market was still short, except if you traded ftt to ftt (FFs) and reversed short there again.The market built a R2R (14:05 -14:20 [internal]) which needed to be satisfied.
(All times Eastern [close-of bar])
-
Who can complain about a 12 point traverse... lol!
EDIT: 14:40 OB was a wash... Gonna enjoy a nice day here. Good weekend all!

-
Who doesn't enjoy a 40 point traverse!
-
Tuesday 18 May 2010...I have noticed how your chart annotations are progressing. One interesting observation is how much attention volume is being given and how is is taking up more and more and more of your visible real estate....
I like it!

-
My view of the day...


The Price / Volume Relationship
in Technical Analysis
Posted
It was not annotated properly (gaussians levels with subs and tapes) to match all visible fractals... 9bbts up... so of course the markets gives us 9 bbts down non-dom.