
Welcome to the new Traders Laboratory! Please bear with us as we finish the migration over the next few days. If you find any issues, want to leave feedback, get in touch with us, or offer suggestions please post to the Support forum here.

TIKITRADER
-
Content Count
214 -
Joined
-
Last visited
Posts posted by TIKITRADER
-
-
sure there are several fractals going on here, but that's not the point I'm trying to make.--
innersky
Re-posted to clarify intent of original post to keep on topic.
I keep the sequential volume order of events a priority.
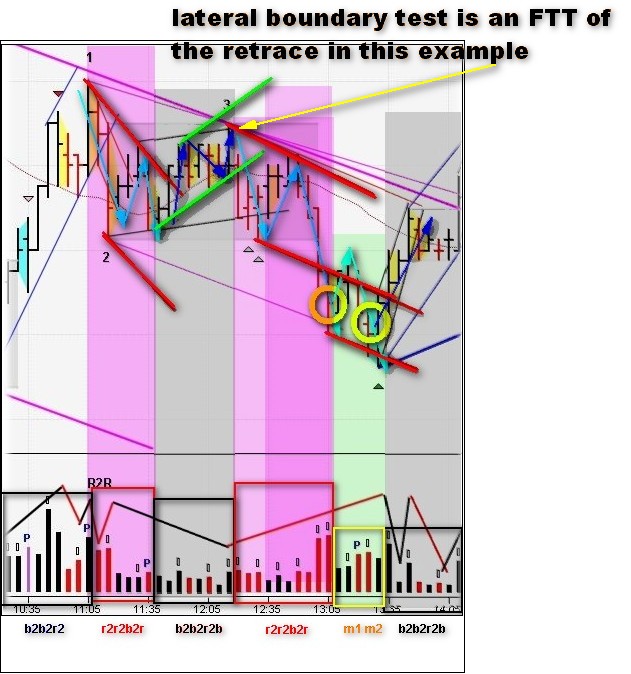
Then the lateral boundaries are placed on top of these events. The composition of the lateral, its entry and future exit have a construction built from volume based on this sequential pattern. From this a lateral boundary test is visible from a sequential view.
-
LAT1I've seen this type of lateral a number of times,
--
innersky
sorry not to take off track then
-
Live platform looks good. You will not get the equities data unless you fund a separate account. Will not be able to trade futures/equities from one account.
Equities will open so you can see the layout minus data until funded.
Demo is a great bargain - futures,forex,equities data all for $25.00 a month. Price esignal for same and see what that would cost !
-
3 decreasing volume bars on open. should be a nice day with the signals from the market
-
The Continental GTC convertible Bentley / 600 hp W12 engine

-
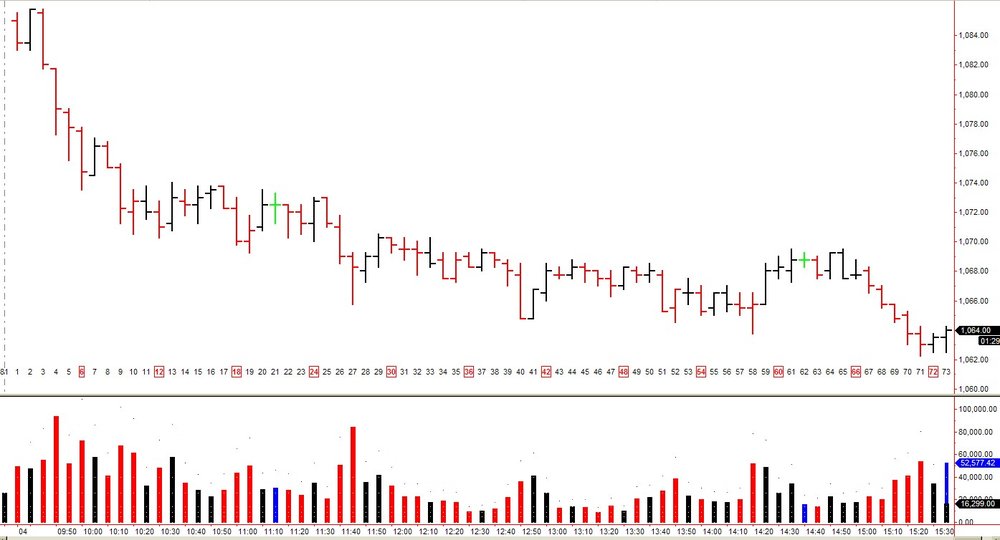
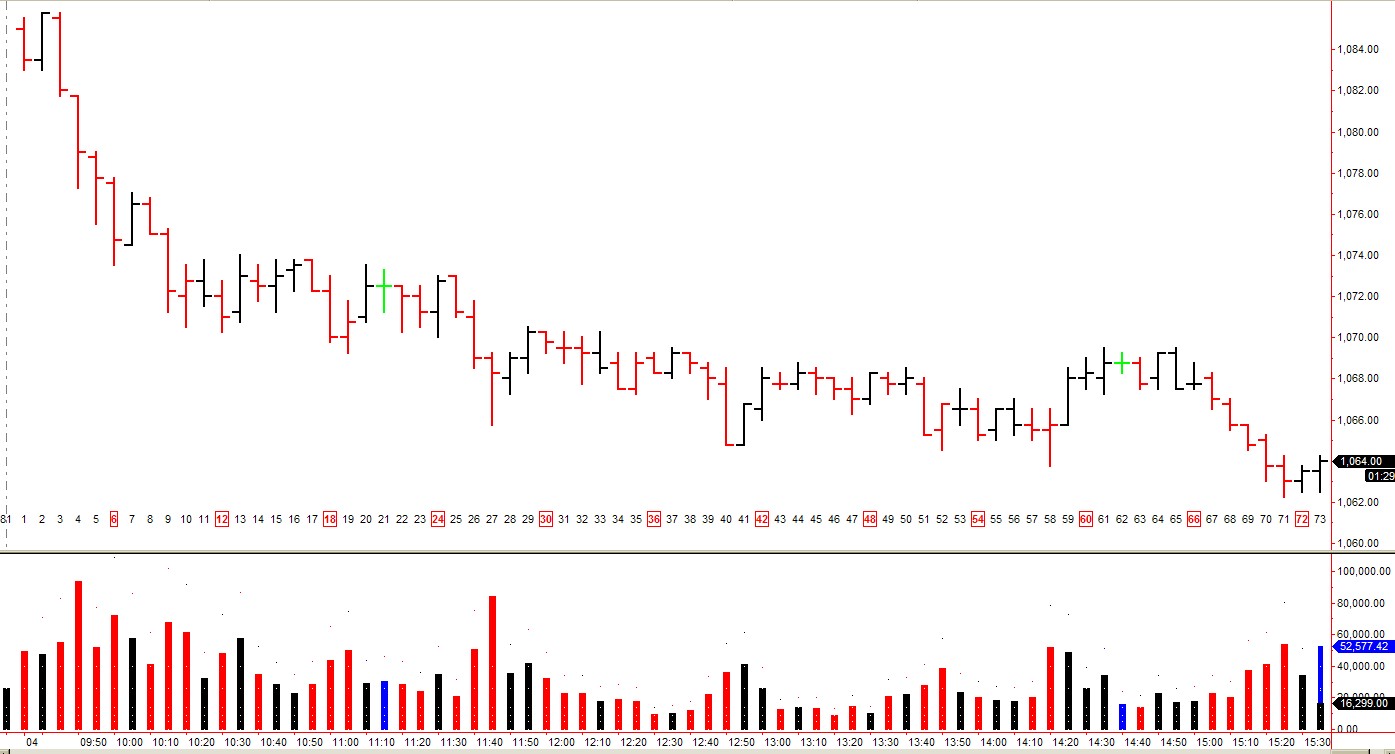
In my view, you have a complete sequence down starting bar 71 prev day (1520, open), followed by a complete sequence up starting bar 78 (1555, open). The up sequence ends with an FTT of the accelerated BBT (or whatever level of container) formed by the bars 3 and 4 of today (0940 and 0945, open), its pt 2 being Mon, and pt3 Tue.Yes , Spyder referenced to this elswhere . . .
"A Volume Sequence which began at 16:00 (previous day) Eastern Time ended at exactly 9:55 AM Eastern Time."
- Spydertrader
-
I picked this up from a thread somewhere else on another site. Give credit to them for posting it originally although I do not remember who actually posted this pdf.. SunTrader and a group were discussing DeMark
-
message double posted, deleted repeat content of second one. no more delete mssg button ?
-
No.Currently, I do not use the YM as part of my M-A-D-A (nor STR-SQU, Tic Charts nor DOM). While in the past, I used the entire arsenal of medium and fine tools, today, I no longer have a desire to work that hard. As such, I now only use the ES.
HTH.
- Spydertrader
I took the DOM, str-sqz- tic chart and YM all off my screen for a year now. Just have ES 5 minute. It has been the best thing for me personally. I do keep a monthly and daily chart to reference the bigger picture occasionally that are on a tab hidden until needed.
-
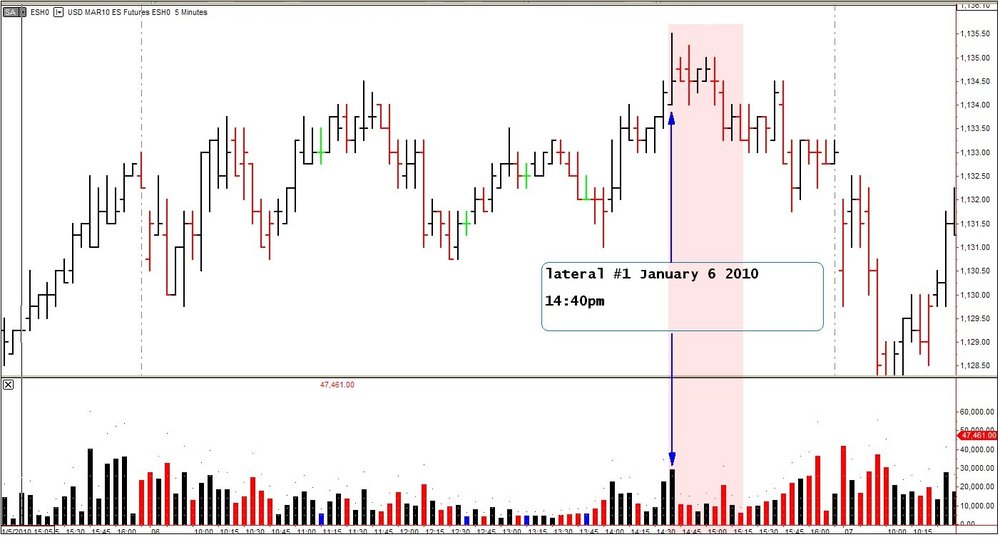
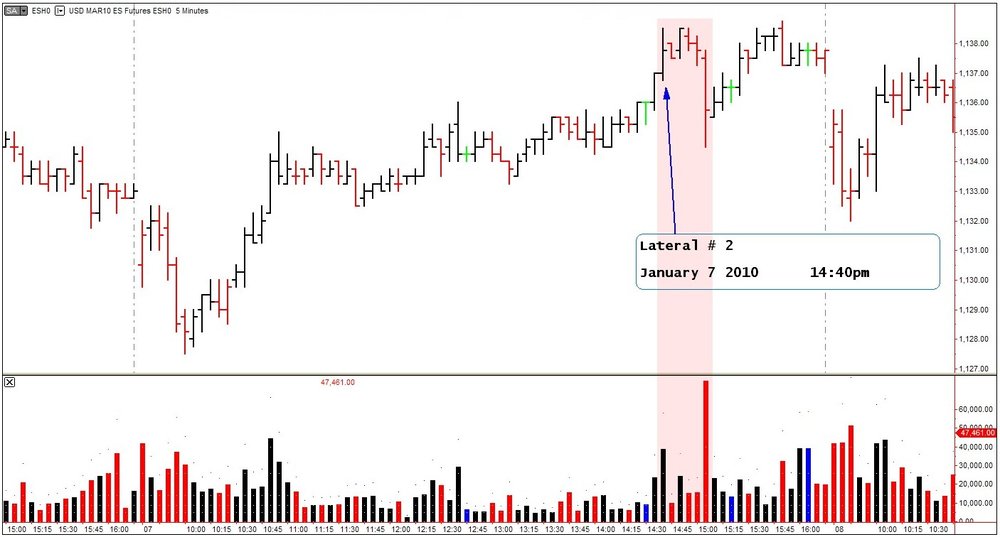
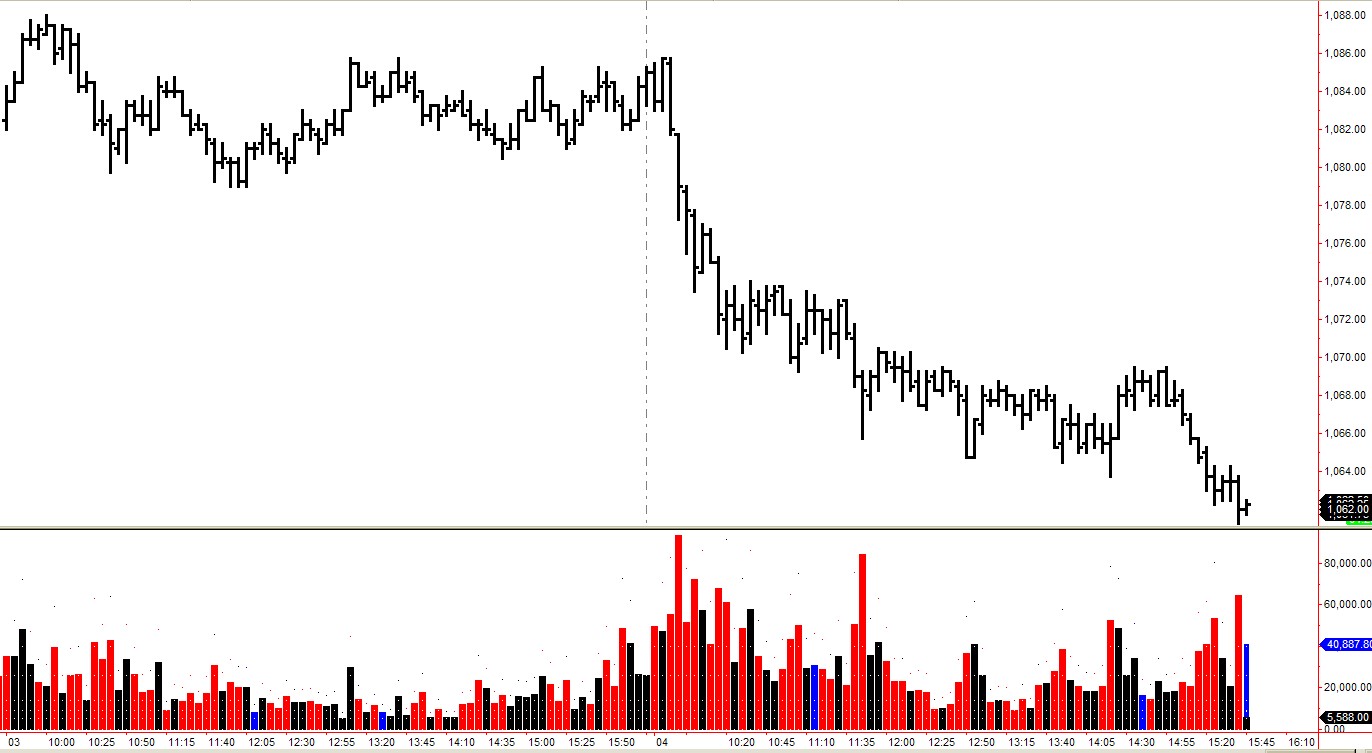
Attached find the complete days to the laterals I posted last weekend.
Maybe a weekend review can take place.
These laterals were selected as they fit the drill Spyder has assembled.
The laterals were neat because each one conformed to the drill, yet the context was very different. The outcome may be surprising.
They took place on . . .
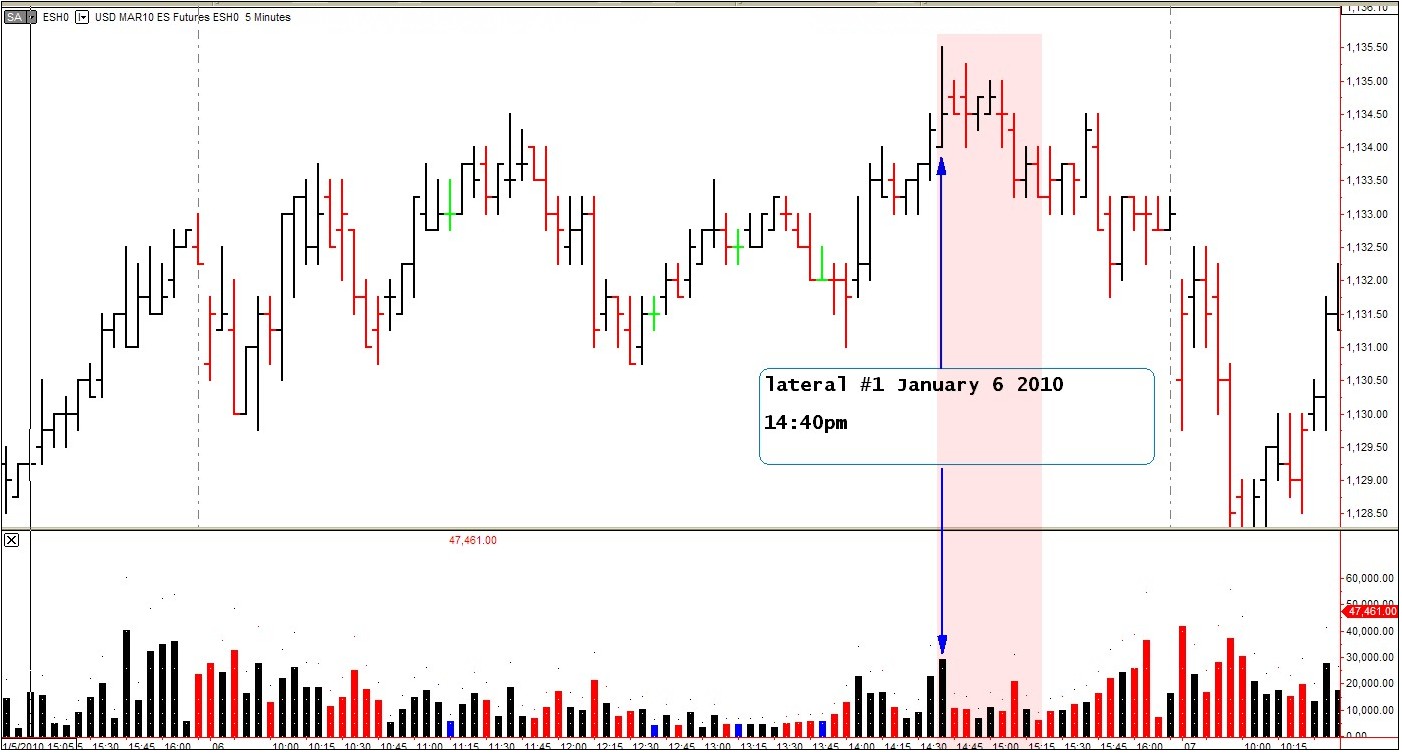
Lateral #1 - January 6 2010 14:40
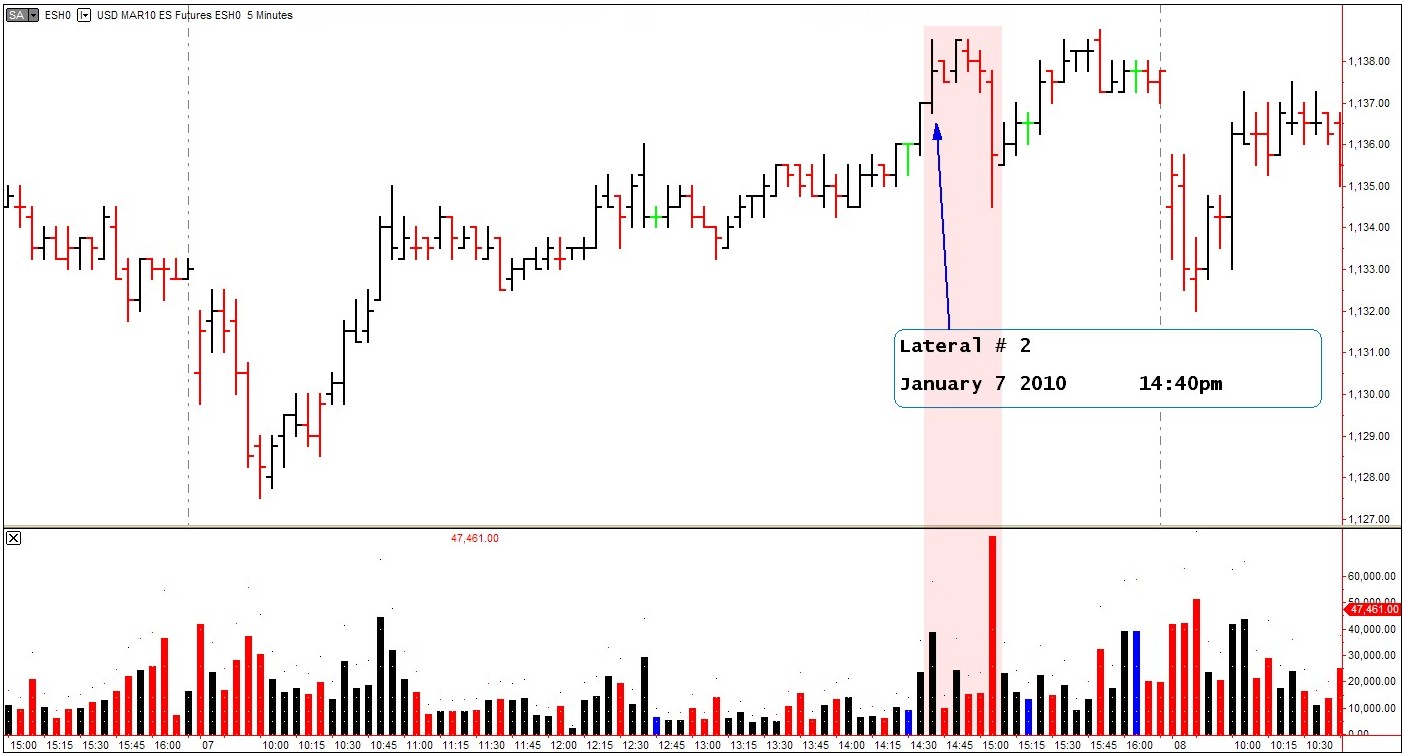
Lateral #2 - January 7 2020 14:40
They happen to form on the exact time on 2 dates in a row. Each lateral itself in context looking different from the other.
Have fun and post what you were thinking on the charts.
Thanks to Spyder for the drills that have brought about some good discussion.
I have also attached a chart with my annotations for the first lateral.

-
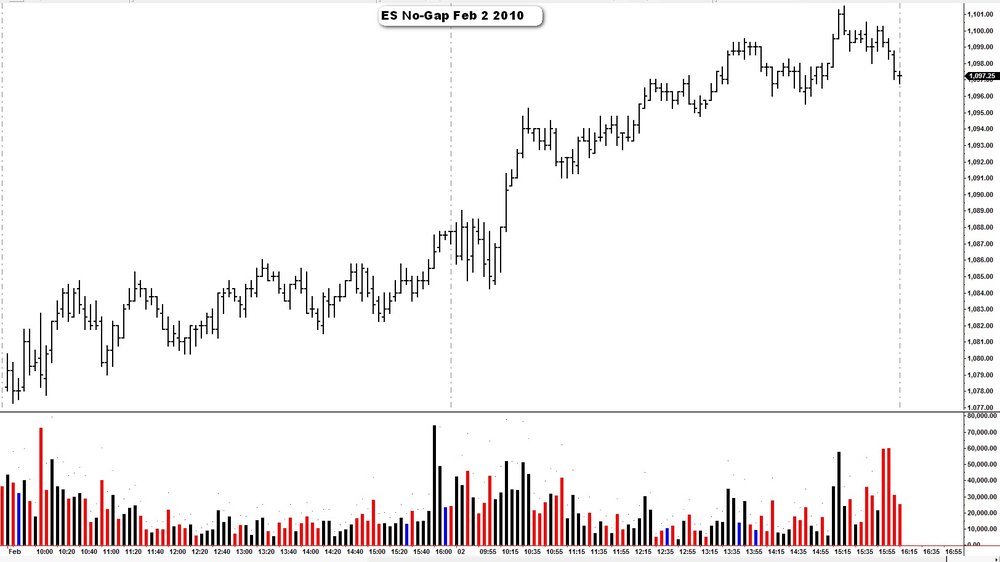
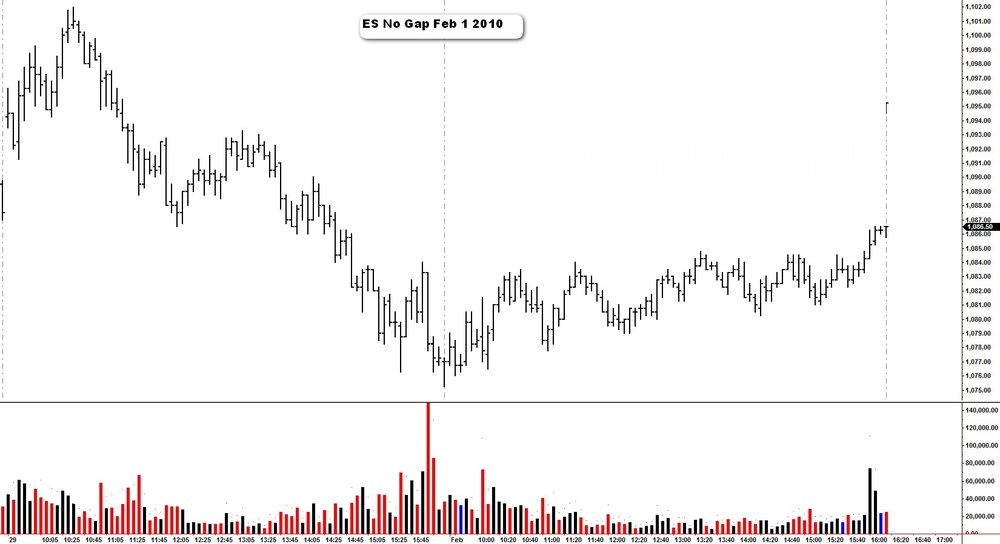
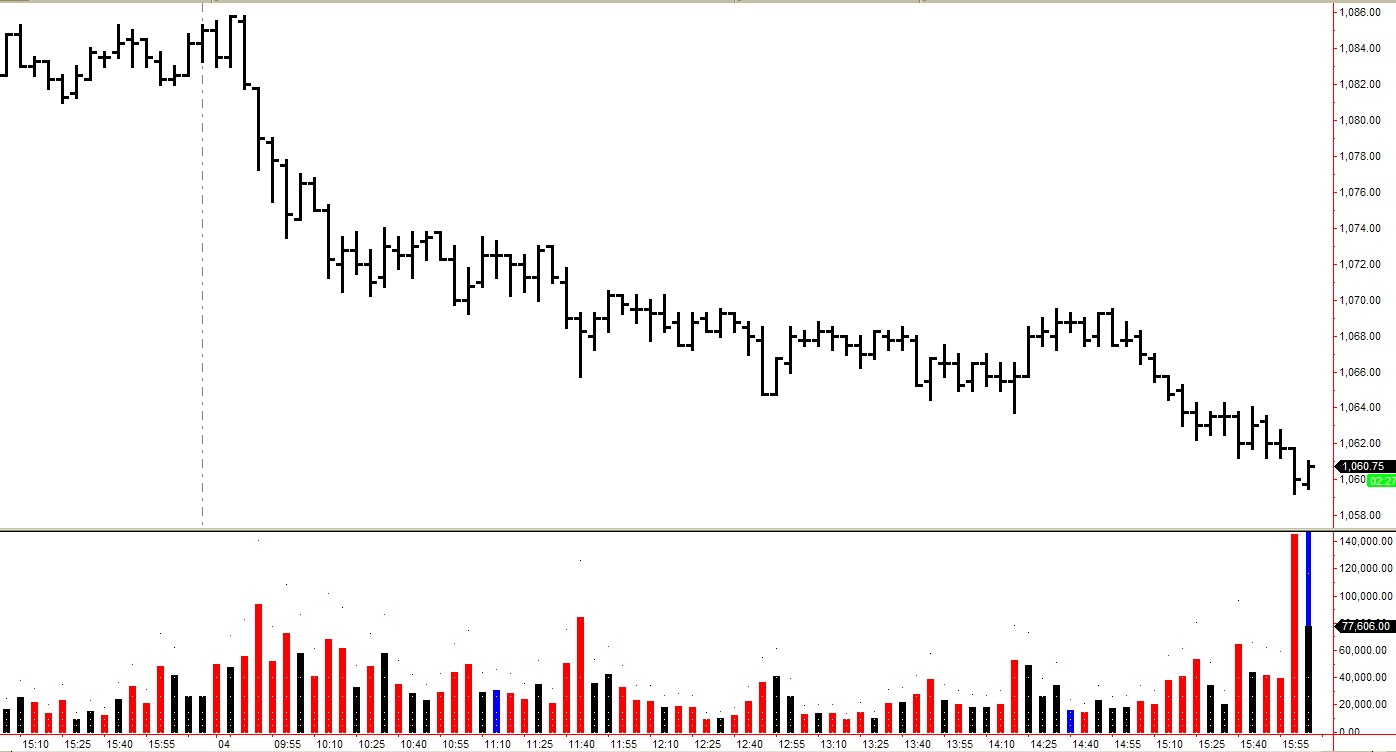
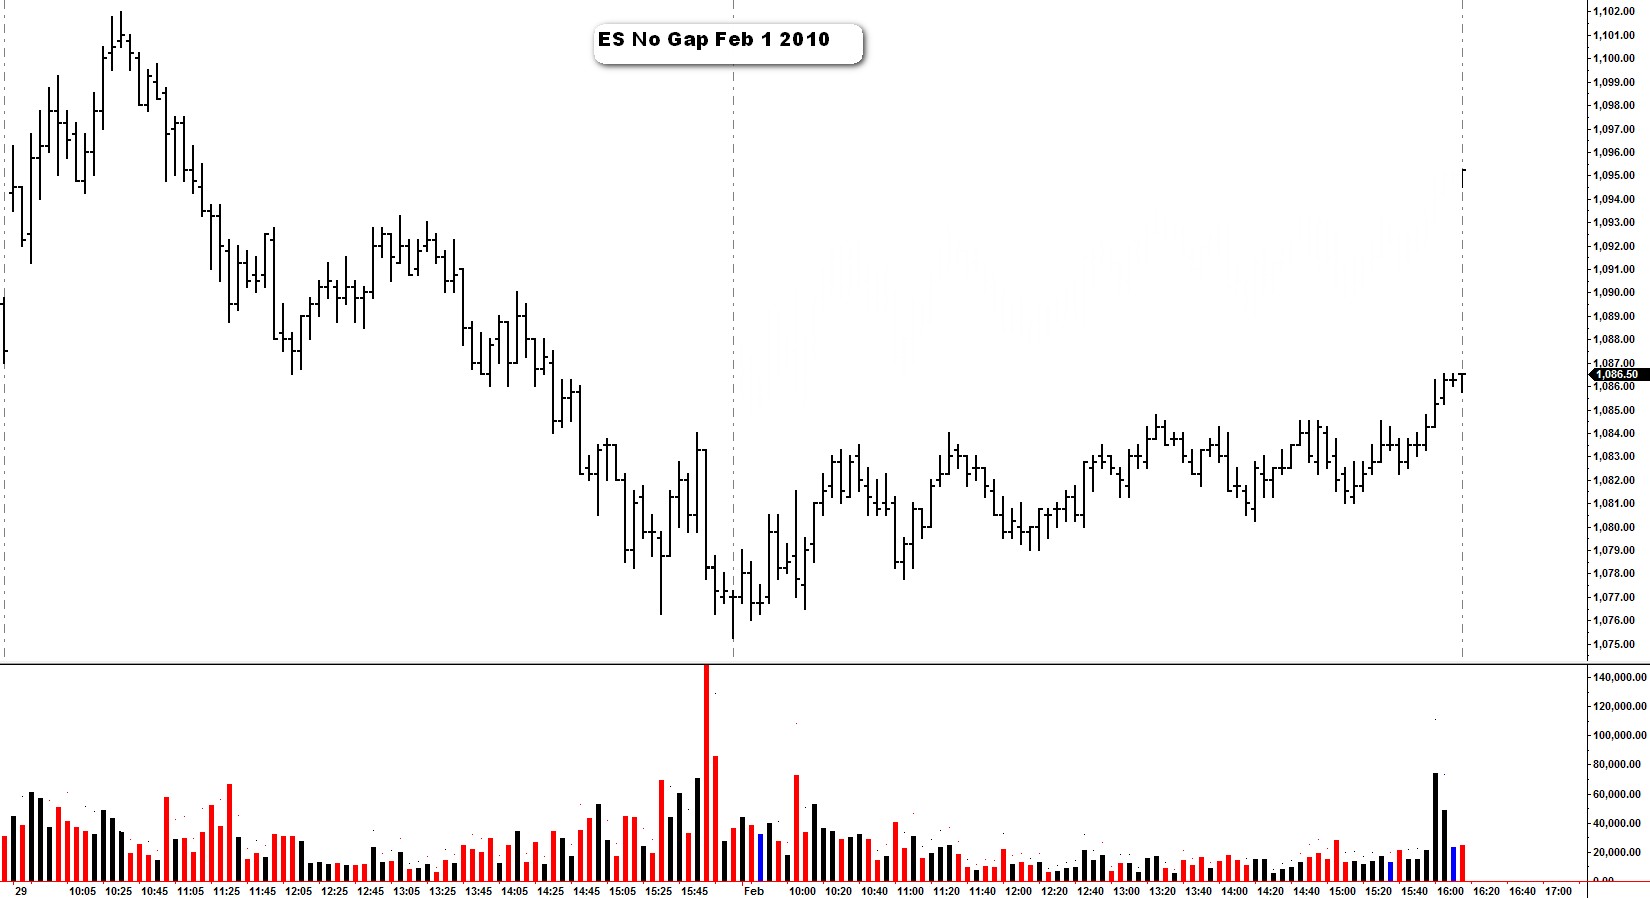
If somebody could post blank chart for today that doesn't come from zen-fire data feed, I would greatly appreciate it. Thank you.here is a blank chart and { edit:} I am also attaching a no gap chart that is blank
added another no gap expanded today data more


-
... and 13:25 inside of the one that you pointed out.
endless supply of them for the spyder's drill lol. . . :thumbs up:
-
Another lateral at 11:10AM today.another that fits the drill at 13:10.
-
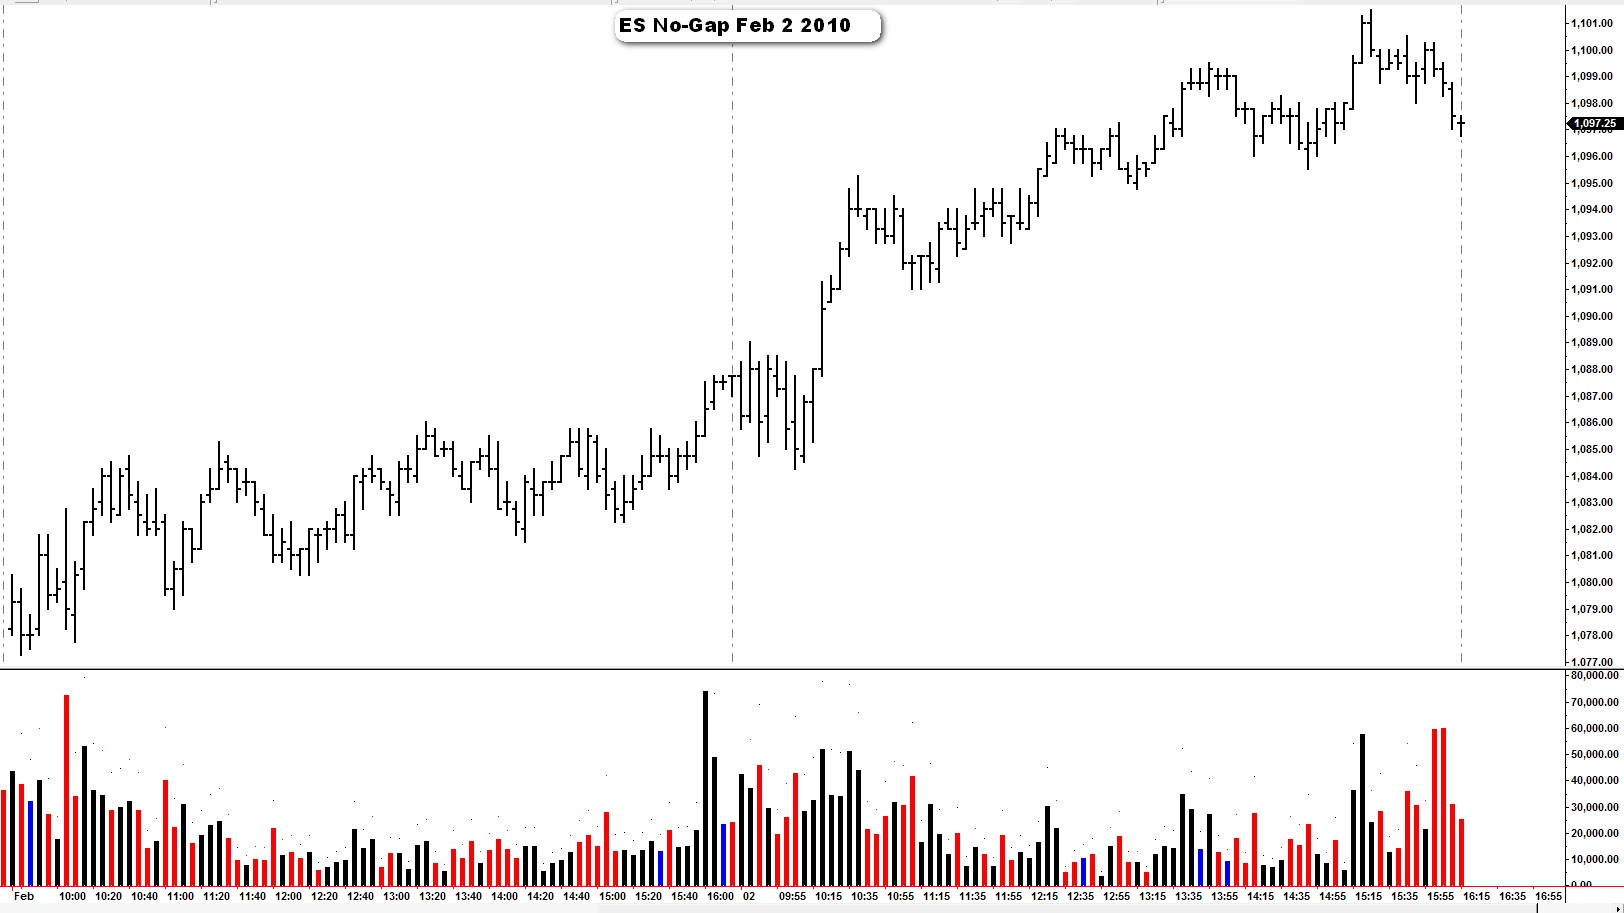
ES blank chart no-gap.
Not much of a difference here but if it helps anyone.
-
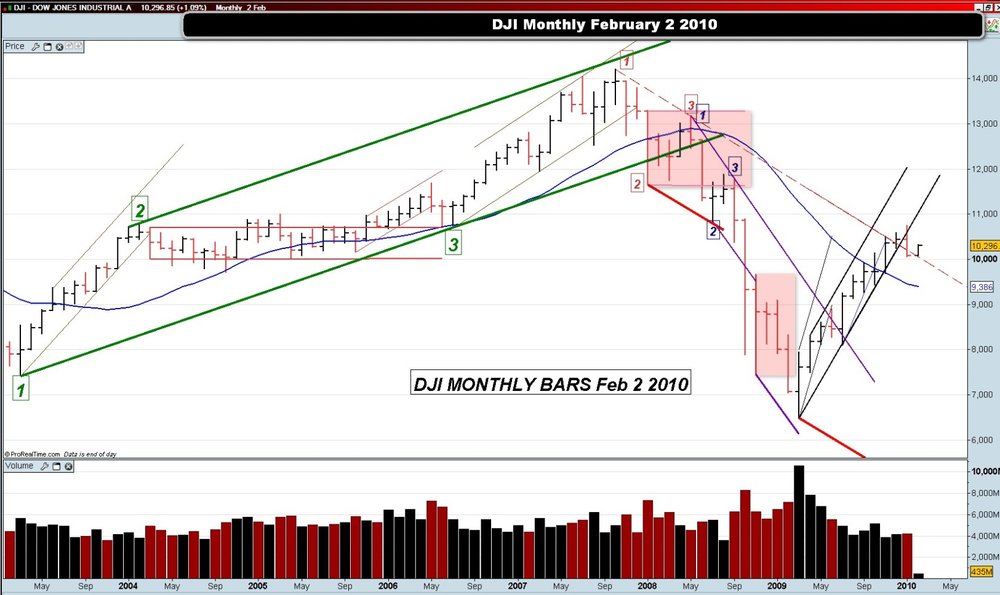
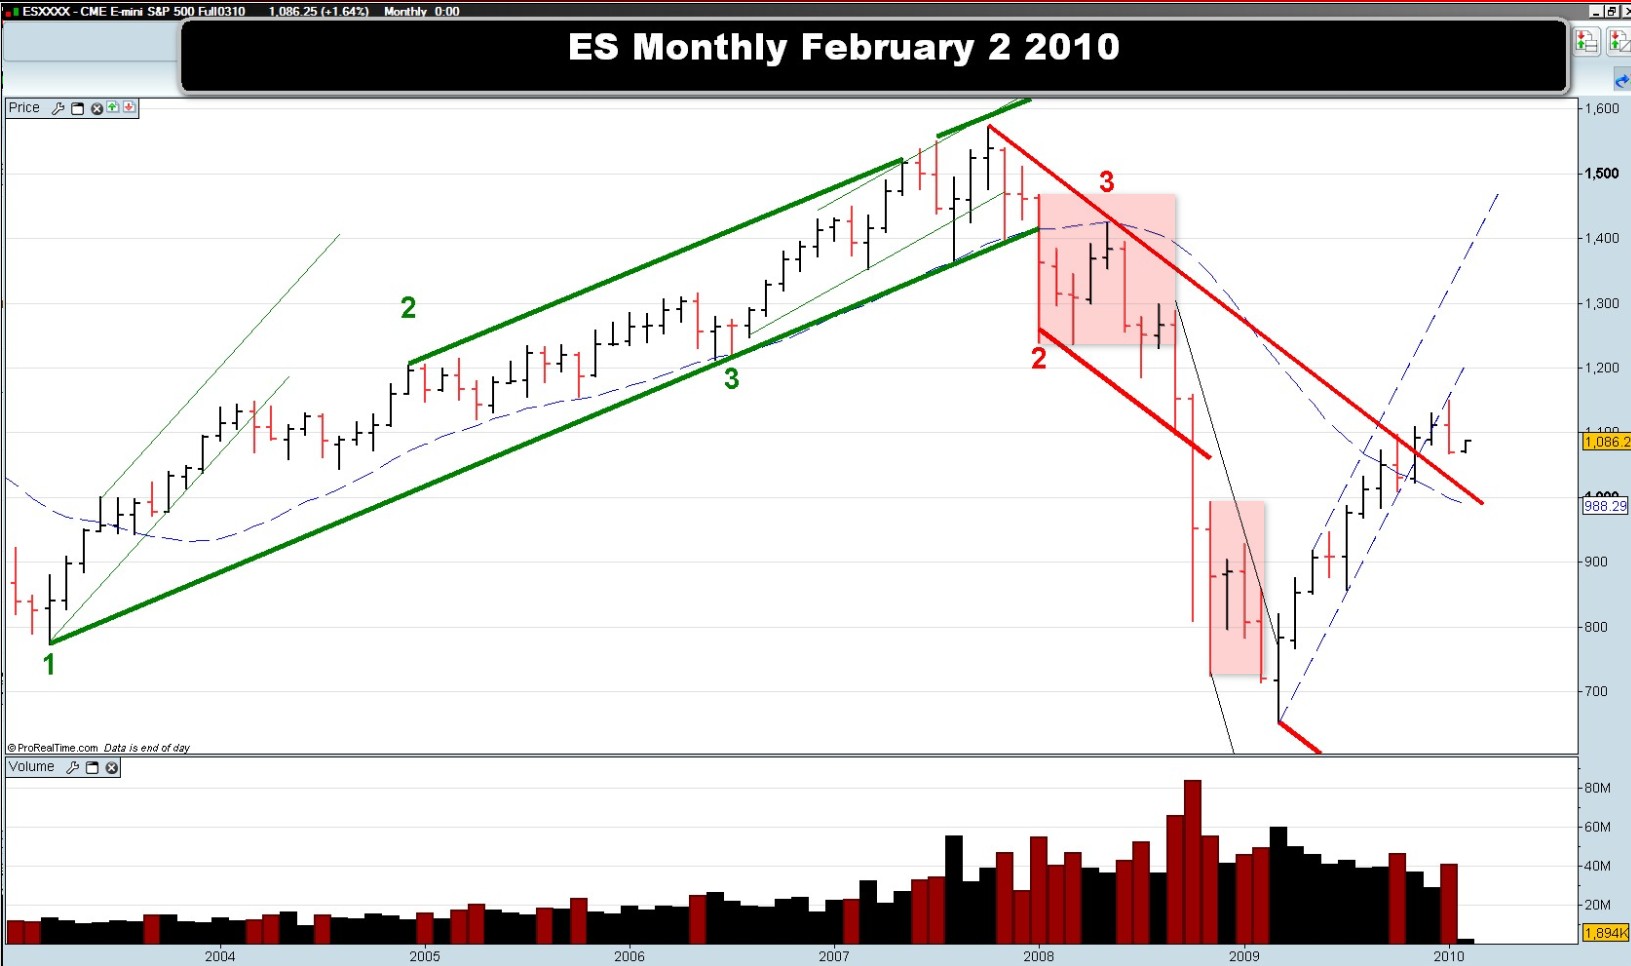
Monthly DJI and ES with a close for the month of January.

-
I use this model.
It is an internal hot swappable hard drive enclosure.
You can have as many hard drives as you want. One dedicated just for trading, one for general use.
Install two of these, and you can have one for swapping OS and one for swapping data drives.
Keep the trading drive clean.

-
This will get the wild girls to jump right in and take a ride
Nice cruise on a sunny hot weekend.


-
If anyone can use it blank ES 5 minute chart with No Gap for today
I have just replaced the chart that was originally attached here in the past half hour.. This chart attached is fine. Apologize for inconvenience.
-
you should leave it open until people have more time to think about it, and express opinions.Sounds good. I will leave it all week and when everyone is ready the complete charts will be posted
-
Later today I will post the complete days the two laterals were chosen from.
-
Of course you looked for increasing Volume to confirm your Point Three, but what you failed to note was that the context was different here. Price found itself inside a Lateral. In such a case, the failure of the market to provide that which you anticipate is in fact, the signal for change.I believe Jack used to call it, "What wasn't that?"
Again, the whole point of the exercise is for a trader to learn how to know which direction Price must head as it exits the Lateral.
HTH.
- Spydertrader
(all spyders comments in blue are highlighted to point out importance of his post )
In this example the lateral was properly differentiated, but the error was in the context.
So as we analyze each step to determine the direction of the lateral exit, the difficulty increases.
This is a work to know what a sufficient data set is to determine what kind of lateral has developed, and which direction it must exit the lateral.
Differntiation- easy enough, compare the developing lateral to known lateral builds.
Context - a little more complex with careful analysis- analyze the lateral and all the data it is forming in.
Order of events- Highest complexity requiring very careful analysis of the sequential order.
This is where the greatest potential for error can be. Critical to properly know where in the sequential order the lateral is forming and what must come next.
-
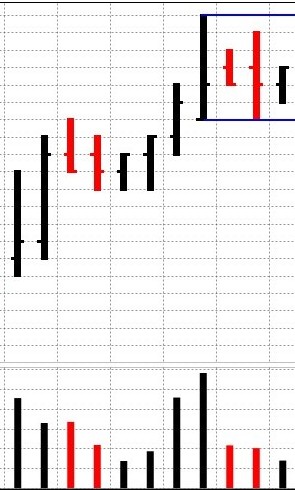
This is the second lateral I posted that conforms to Spyder's drill.
Enough info to identify the lateral ?
Remember these are not trick questions. This is only to review just how little information is enough to identify the lateral.
-
Using snippets this short, much of the context and order of events is missing. It is really only useful for differentiating the object.I agree, although is it possible to use a small amount of data to determine? This is to see what amount of information is needed to identify a lateral and understand a laterals direction. Understandably, the greater amount of information available, the better one can identify . . . but just how little the info available can still be enough to properly identify.
This is the first lateral I posted that conforms to Spyder's drill with a small addition of information.
With this additional info, do we have enough for
1) Differentiation
2) Context
3) Order of events
Anyone is welcome to comment.
-
Can you please clarify what "PFC", "m1" and "m2" mean?Thanks.
I can help you there. Pre Flight Check, and Move1 and Move2


The Price / Volume Relationship
in Technical Analysis
Posted
Applying the method to CL