
Welcome to the new Traders Laboratory! Please bear with us as we finish the migration over the next few days. If you find any issues, want to leave feedback, get in touch with us, or offer suggestions please post to the Support forum here.

TIKITRADER
-
Content Count
214 -
Joined
-
Last visited
Posts posted by TIKITRADER
-
-
Oh......and congratulations on the new family member.Same here, Congratulations James. Enjoy the new family.
Best to the new team at TL this is a nice place.
-
In the end we are interested in making money and not in making beautiful charts.yep agree there. here is a very simple trade I took yesterday. live trade.
times can be matched to chart to see entry and exit of a faster fractal trade.
was out all day when I came home this was sitting there.simple 1 contract trade ES. left home after this trade missed rest of day.

-
One of the best sections of all the threads regarding the method can be found starting September 1 2007
Spydertrader's Jack Hershey Futures Trading Journal
Flaws and Internal Formations
beginning about page 884
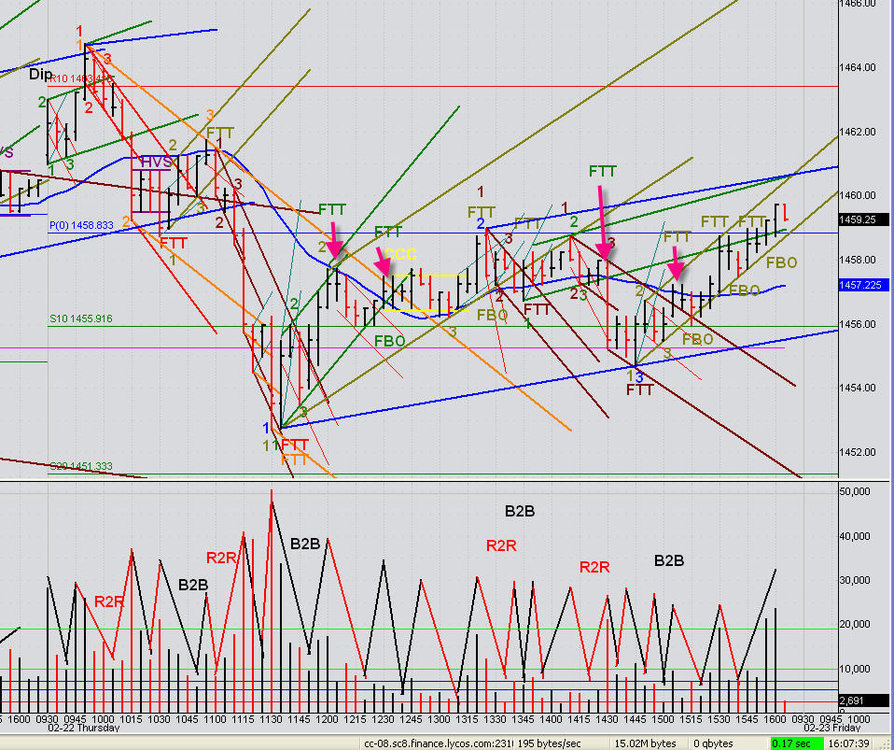
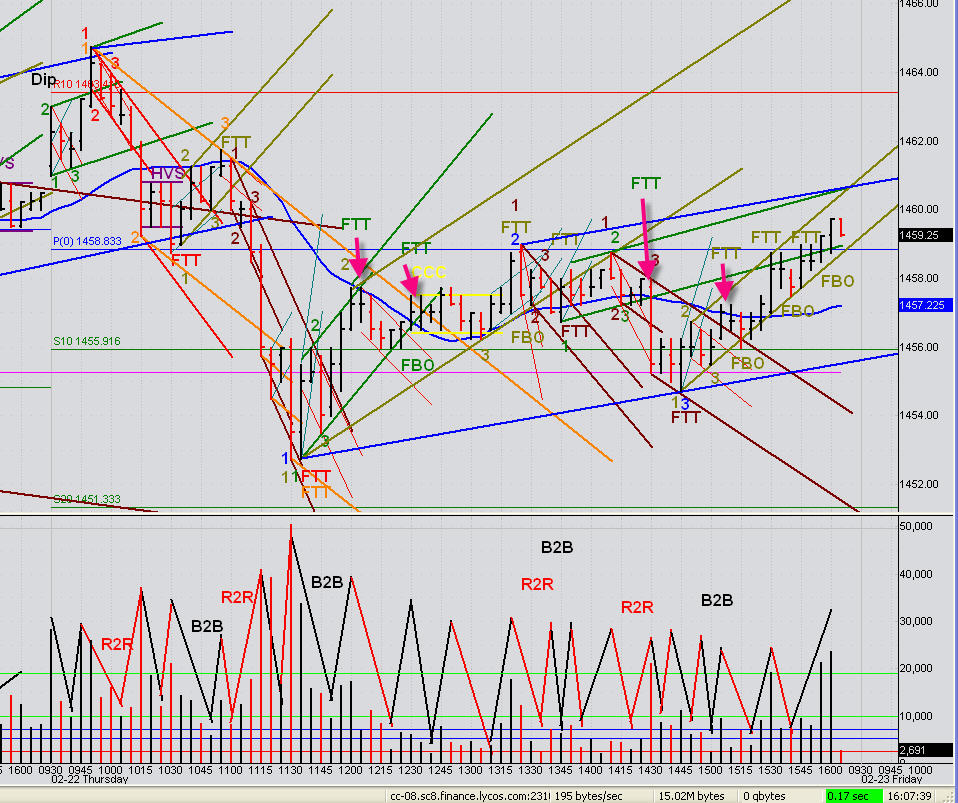
Edit: Attached an old chart from Spydertrader that has an HVS market around 10 to 10:30 am. Reminder . . .Chart is from past with annotations that relate to the discussions taking place at that time.
-
HVS = High Volatility Stall JH - Method
quote from Spydertrader
A. Hitch
As dominant traverses proceed the price change there is, at first, an almost continuous
advance. Therefore, from bar to bar, the offsets and the bar length repeat one after
another. Progress can soften after a period of time and it shows up as a momentary one
or two bar repeat. Repeat means that consecutive nearly identical bars show up. The
bars often do not have the volatility of the prior advancing bars. Volume will flag
somewhat preceding this phenomena. Then the price resumes its prior advance. The
market has momentarily caught its breath, so to speak.
B. Dip
Dips are like hitches only they are more pronounced, meaning that a small noticeable
retrace for one bar may occur. The corresponding volume flagging is more pronounced.
C. Stall
Stalls are longer hitches and the volatility may not be less than prior bars. Picture it as a
definite pause and dwell period that occurs not too close to the left fractal channel line.
Volume will oscillate somewhat by flagging and then refreshing and flagging again.
D. High Volatility Stall
This formation usually occurs near the limits of the market’s range and early in the day
when volume is brisk and the market opens somewhat near the prior day’s range. A
high volatility stall can be traded at the rate of one cycle per two bars and it can be
traded in both directions with a neutral bias. The tick length of the bars gives a
comfortable value of profit and leaves room for market fills that may not be at the limits
of the lateral values of the range of volatility in a bar.
-
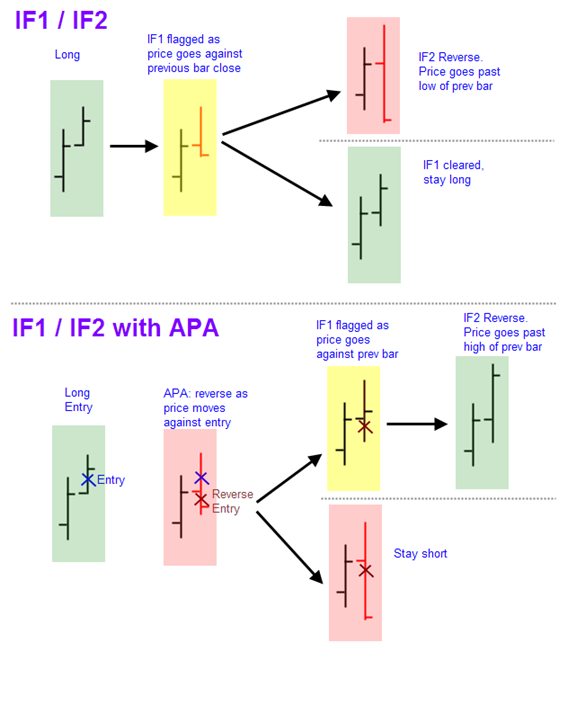
ahhhh ! here is one of them
edit: this drawing of IF1 IF2 APA was created by Bi9foot. this is not the strategy report. This is a great drawing and explains well.
now I remember Ezzy searched extensively for these docs and they did not turn up.
-
What does " IF1 IF2 and APA (including HVS trading)" mean please?There is an if1 if 2 apa strategy report floating around someplace.
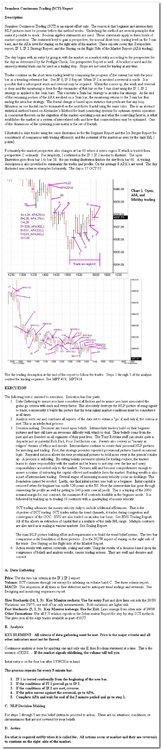
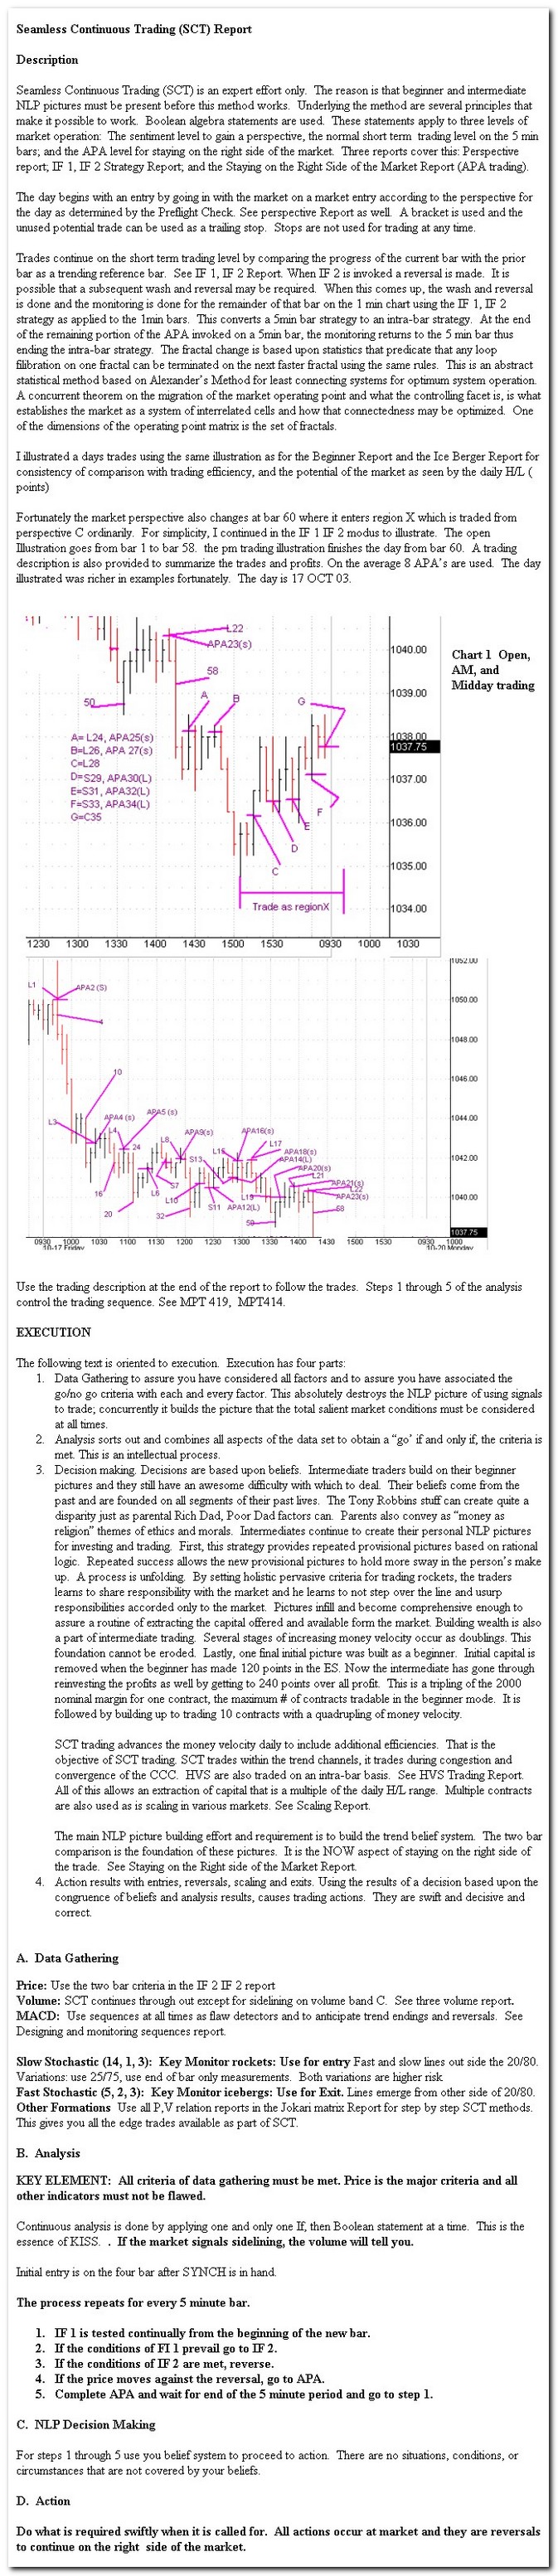
Here is SCT Report that picks up some of this. I will keep looking and get back here when I find it
-
When I first bought MC I had no idea myself. The MC- EL guru Tams helped me

-
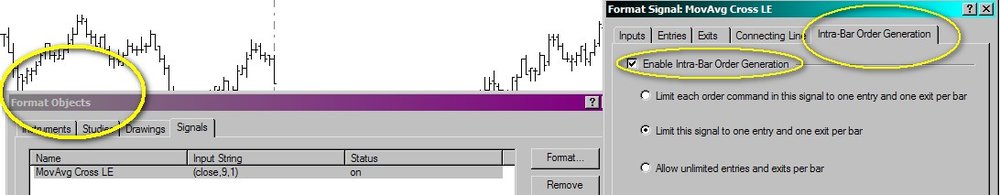
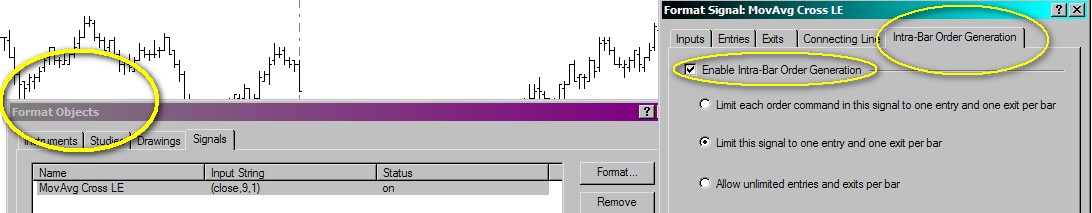
Another question... Where is the enable intra-bar order execution setting? I can't find it.
thanks
if this is what you are talking about then
apply a signal to the chart, then go to format studies ( format obects- signals ) , select the IOG tab
-
http://www.techsmith.com/codecs.asp
video does accompany sound on prev post. apologize for any problems.
for anyone who needs codec for camtasia
-
here is a chance to have that dream car for a day . . .
it will cost a nice penny though
Ferrari F430 Spider - Vital Stats
Price: $279,000
Engine: 490hp mid-mounted V8
Transmission: F1-style 6-speed semi-auto
0-60: 4.0 seconds
Top Speed: 196 mph
Passengers: 2
Exterior: Rosso Corsa (Red)
Interior: Natural leather
Rental Pricing
Miami / South Florida
Weekday rates (M - Thu)
1st day (24 hours) $1,450
2nd day (24 hours) $1,450
Each add'l day (24 hours) $995
Weekend rates (F - Sun)
2 days $3,450
3.5 days (3 + free 1/2 day) $4,445
Weekly $7,875
-
The feed (knock on wood) has been good in recent memory..
The live platform, live data completely froze this week on one instance for about a half hour . . .for me as well as another user of OEC. You did not have an issue ?
-
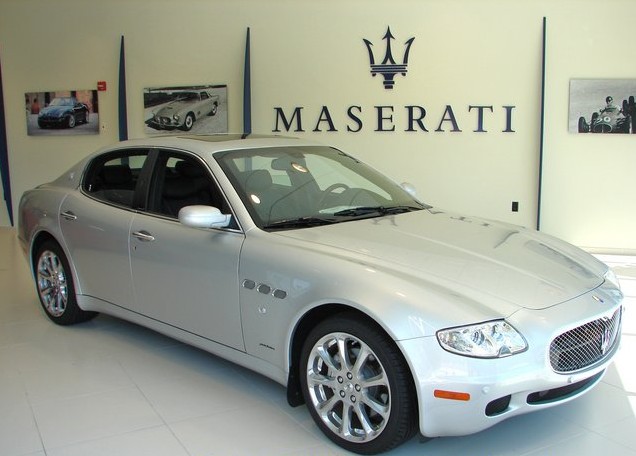
2008 MASERATI QUATTROPORTE EXECUTIVE GT 4.2L V8 6-SPD AUTO
This is a nice one
-
Love the oldies sports cars
The 1970 Ford Mustang

-
Have fun . . .
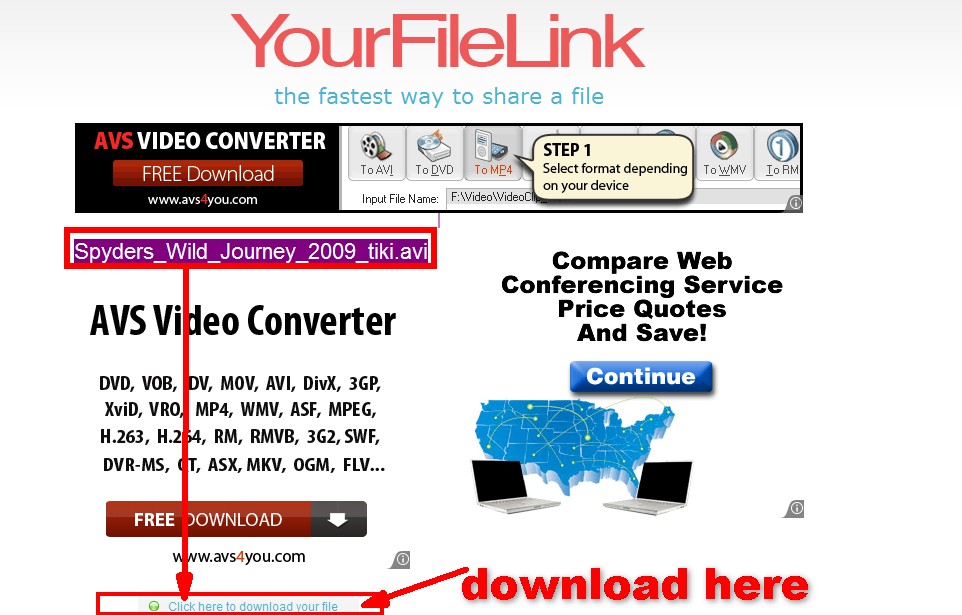
CLICK THIS LINK . . . WAIT FOR DOWNLOAD COUNTDOWN ( very small numbers ) AND FOLLOW INSTRUCTION
http://www.yourfilelink.com/get.php?fid=541170
OR TRY THESE ALL SAME NOT SURE WHICH ONE IS WORKING
http://www.yourfilelink.com/get.php?fid=541170&dv=1
tiki- spyder's wild journey video- YourFileLink.com
and see the title
Spyders_Wild_Journey_2009_tiki.avi
then look for the link to download file
once video is downloaded turn up speakers and have fun !
file is safe- I created a fun simple video for the method and file size was too large for direct attachment
no problem playing in windows media player
image explanation attached
-
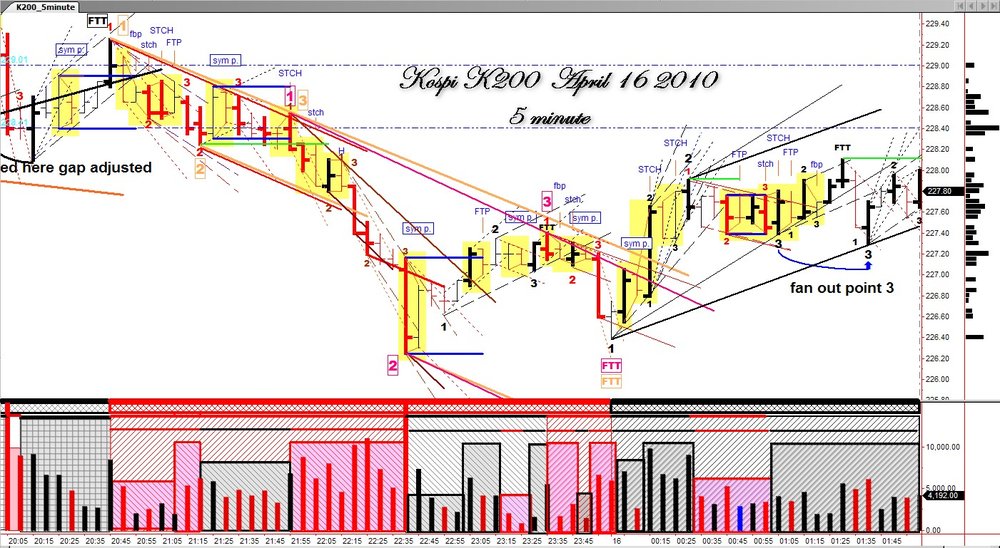
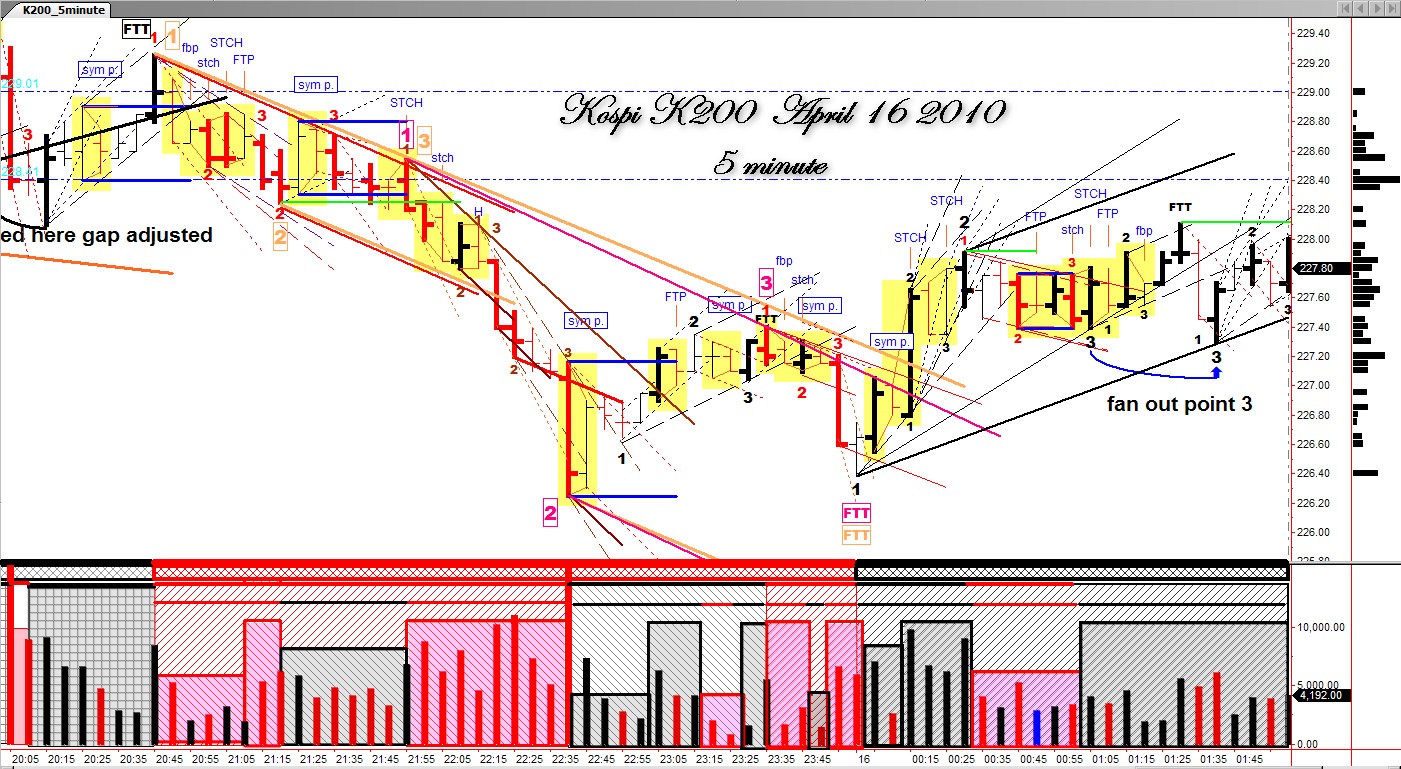
K200 Kospi _Friday April 16 - 5 minute chart
-
Dude, your avatar is scaring me.
lol . .
.

-
I have to store all the oil I took delivery on in my pool.
LOL that would be a 50 x 55 foot pool for 1 contract. You must have awesome parties. :rofl:
. . . JK !
-
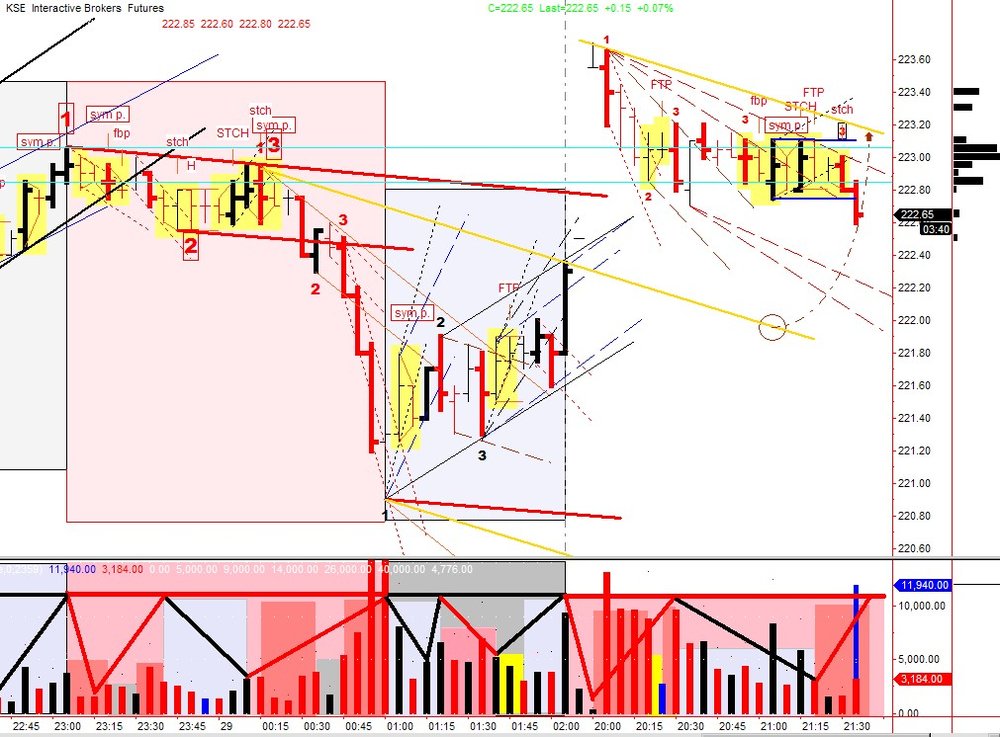
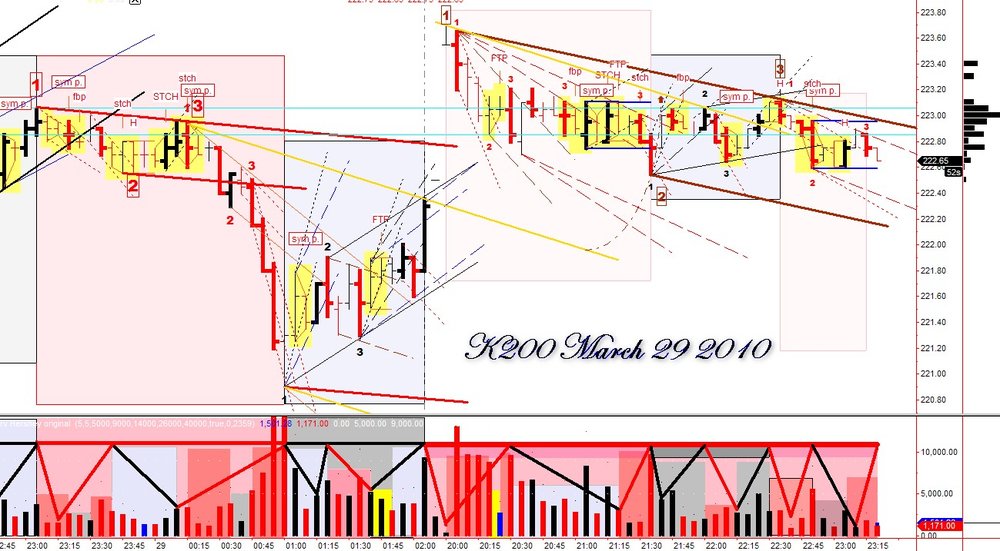
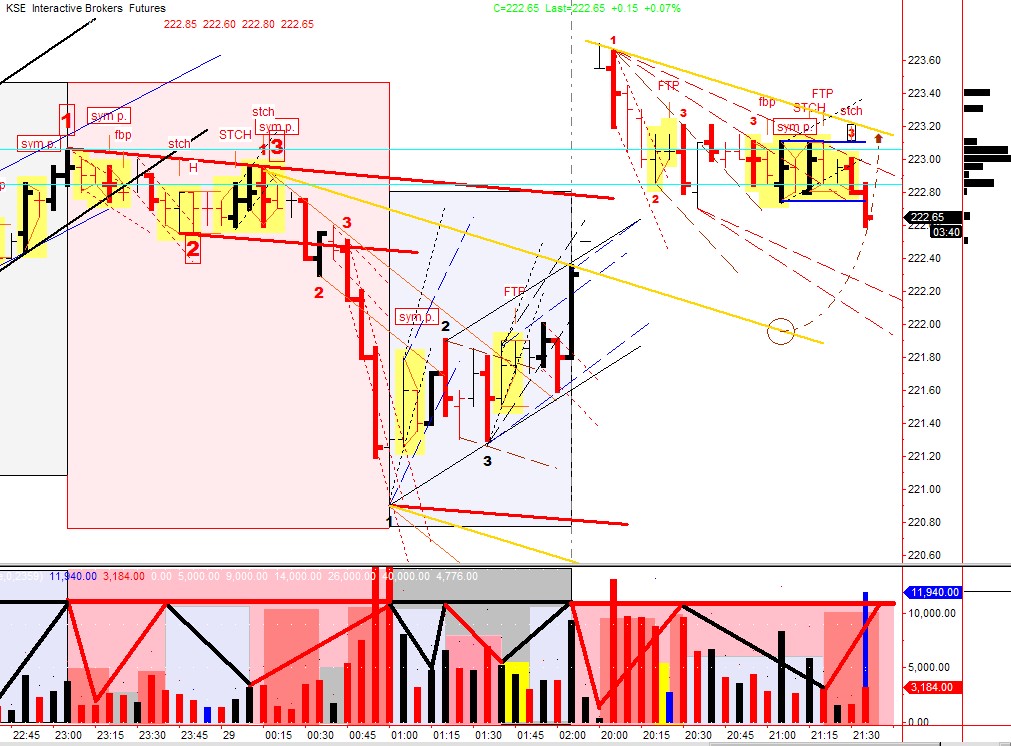
K200 Kospi - kse March 29-30 5 minute EST
I made an error in previous post regarding the trade hours for the K200.
The correct hours in EST are 8pm to 2 am.
attached charts are from last evening.
News link for kse provided by redduke thread
calender for kse holidays
Korea Stock Exch. 2010 Bank Holidays
* chart ends earlier than close as of image time taken
-
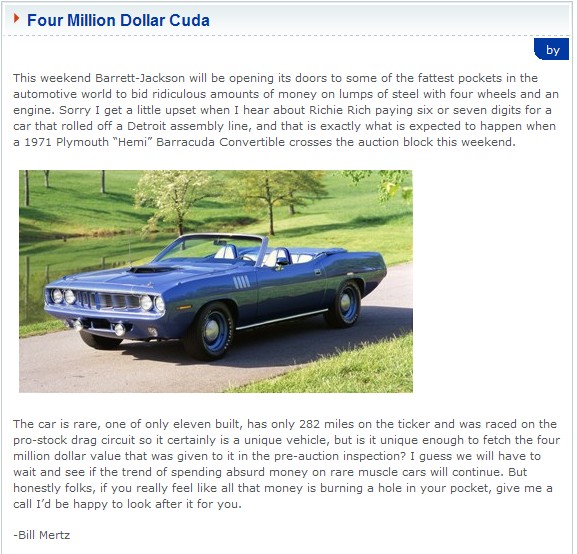
Ok heres a Q for you guys, i know its a slight diversion of the thread but.....What cars are going to appreciate going forwards and are desirable, I should say excluding already stupid priced exotics such as Ferrari 250 GTO and so on.
I have a few ideas of my own but interested as to others thoughts.
First car I posted on page one. 1970 to 1974 Cuda.
There is no end in the appreciation of these cars now. They originally sold for $5,000.00
Now they are going for as much as $3M to $5,000,000.00
Yes that's right up to 5 million !!
This car in image auctioned in past few years for 4 million
-
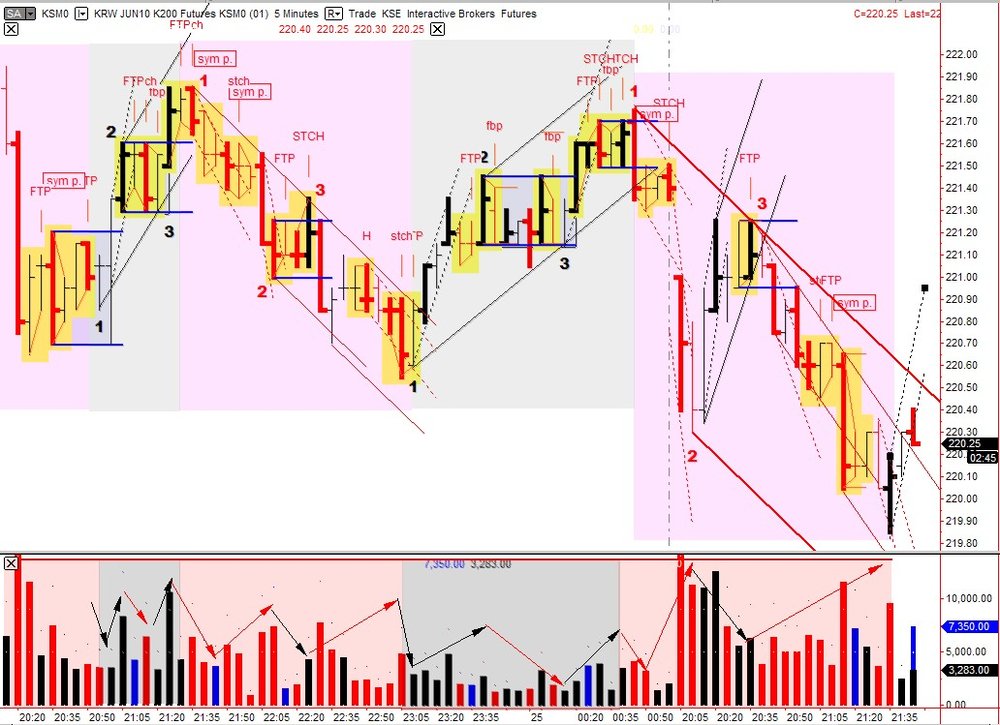
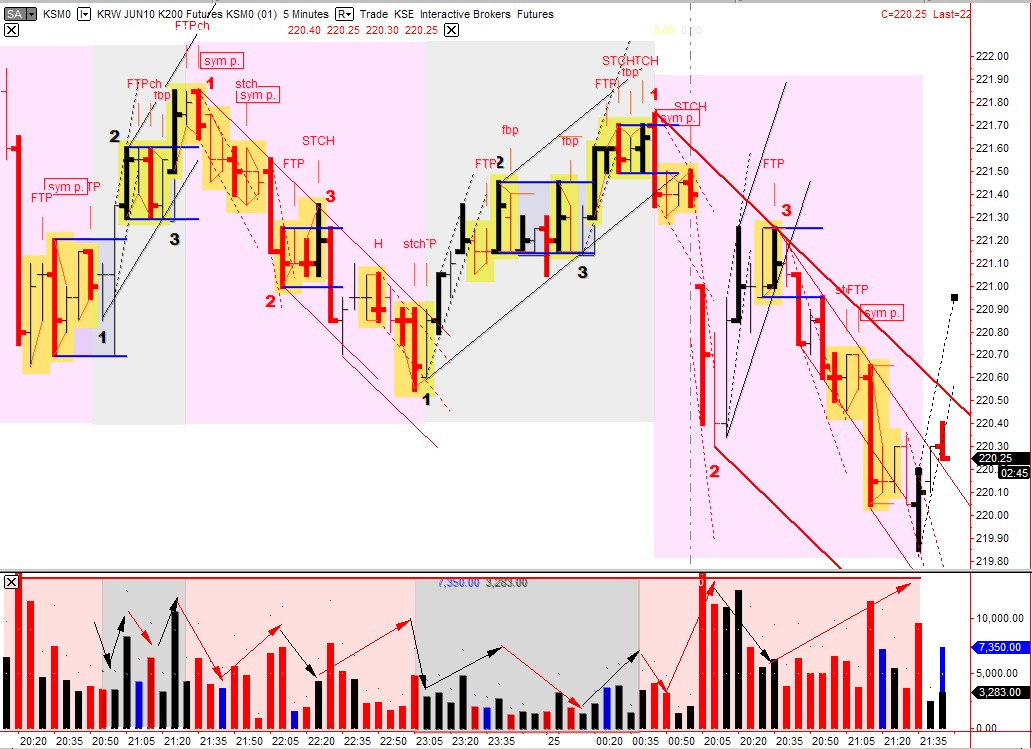
This is a fun one. I am new to it so I still have to get used to it. ( may not be setup perfect, working on it )
Kospi K200- kse
This is live this evening. The Kospi opens around 7pm est and closes about 1pm est. This is a great way to keep practicing or trade live during evenings.
method looks perfect applied to this market. this chart is a quick throw together but I will get some more posted in near future.
thanx tams for some great codes posted on tl
-
-
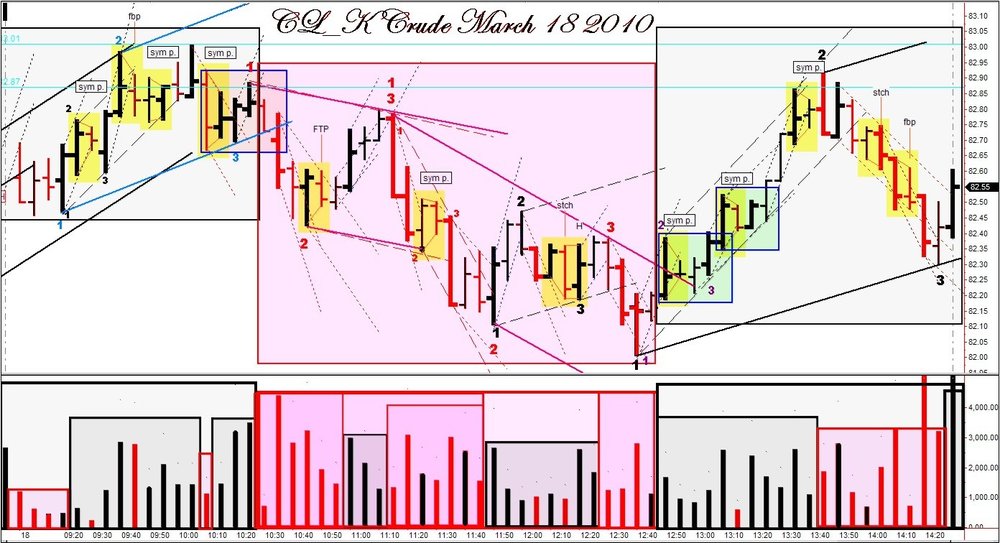
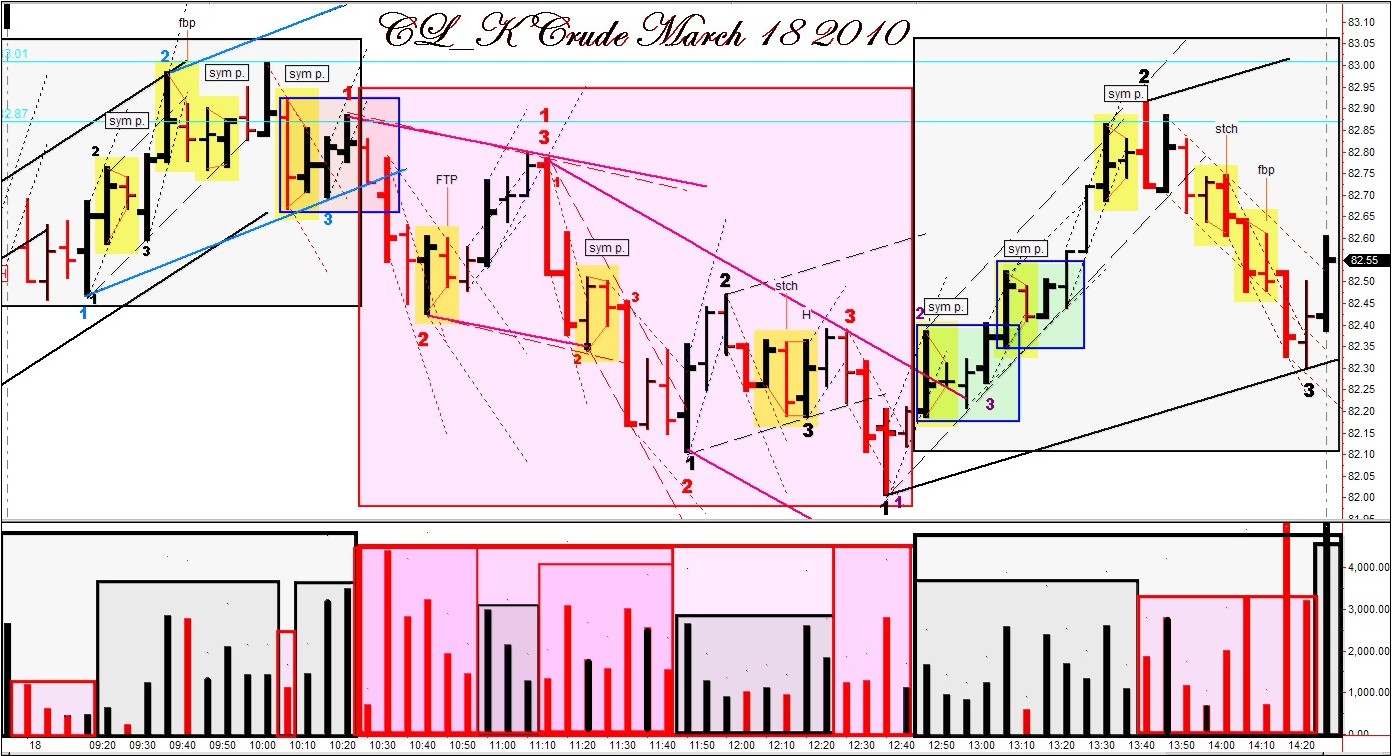
cl_k crude march 18 2010
-
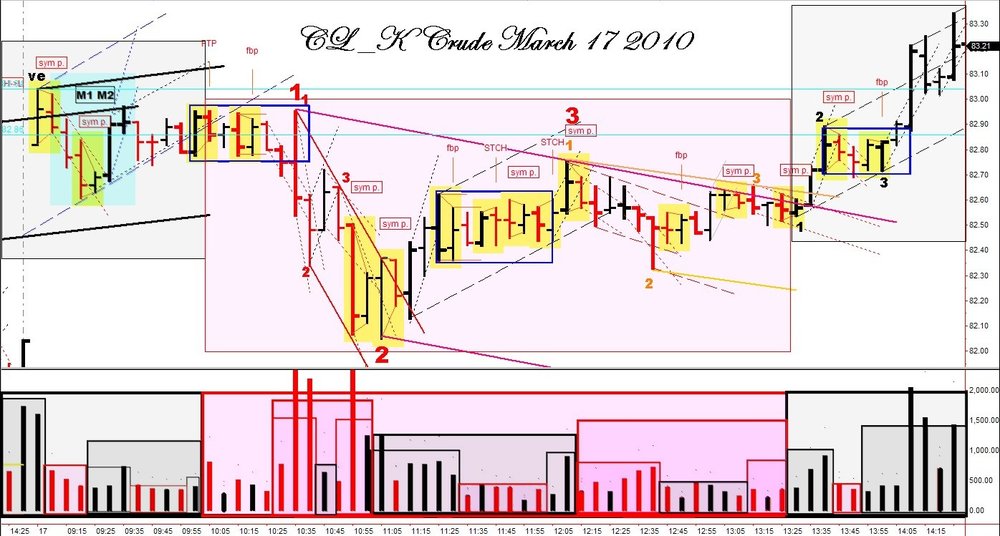
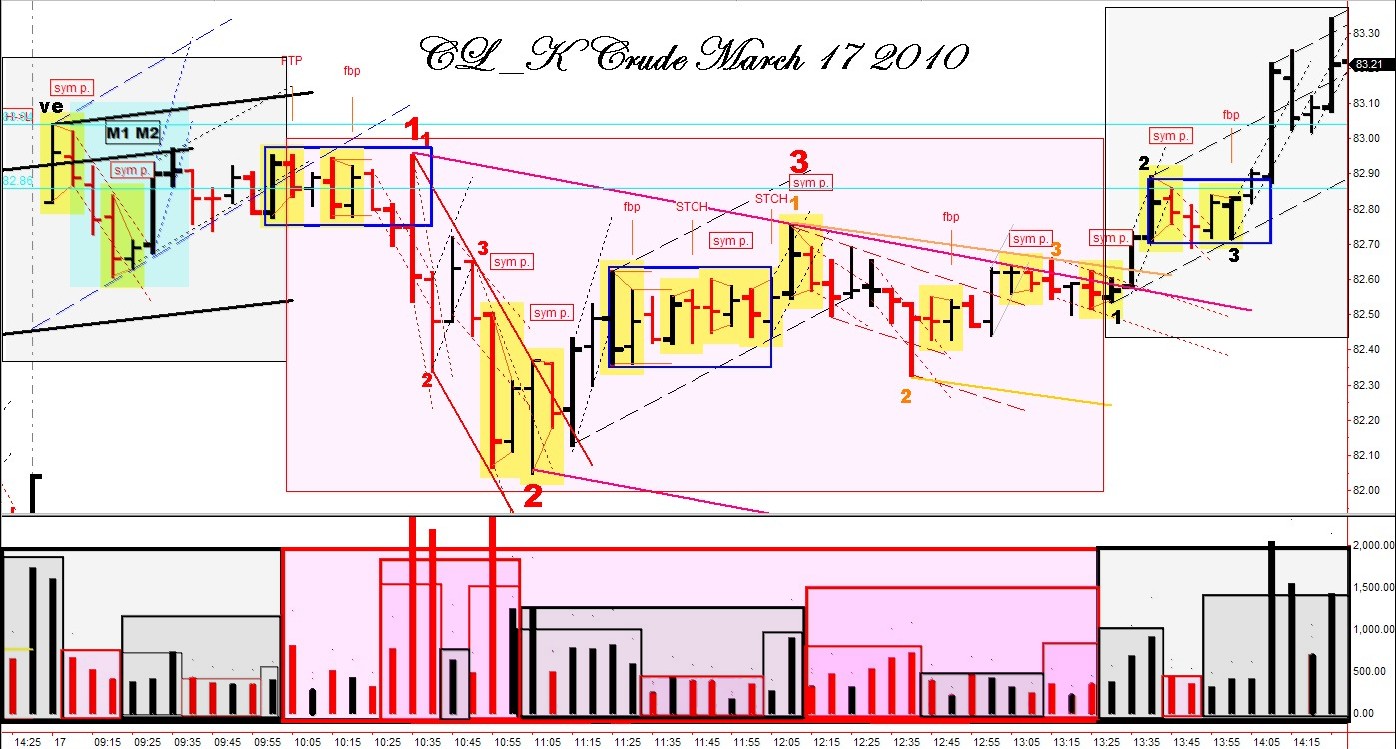
cl_k- crude march 17 2010
-
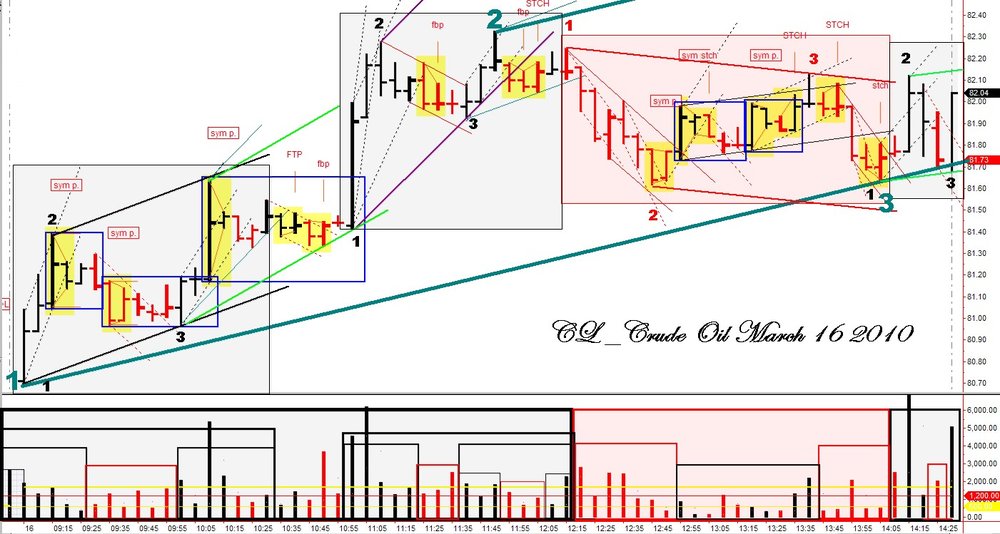
CL_ March 16 2010 ( crude )


Emini S&P 500 Day Trading Journal
in Futures
Posted