
Welcome to the new Traders Laboratory! Please bear with us as we finish the migration over the next few days. If you find any issues, want to leave feedback, get in touch with us, or offer suggestions please post to the Support forum here.

Soultrader
-
Content Count
3710 -
Joined
-
Last visited
-
Days Won
1
Posts posted by Soultrader
-
-
Welcome aboard trading4life. Please feel free to post any questions or comments. Also make sure to check out our multimedia section. As a registered member you will be able to watch trading video clips. I usually update them on a daily basis.
-
Brief video on how to use the TICK as a market internal tool. In this clip I go over a few simple tricks of the trade. Further explanation of the TICK can be found in this thread.
-
What exactly is a TICK hook? Also, do you trade soley of the TICK chart? Or do you have certain setups you use with it?Posted a chart up for you. A TICK hook is hard to explain in text format. So I posted a video for you also.

-
What timeframe TICK chart do you use? Also I noticed in your charts you use mostly a line on close TICK chart. Why is that?I use a line on close TICK chart primarily for visual purposes. A line on close TICK chart will show me TICK hooks which a candlestick chart will not. However, one disadvantage of using a line on close TICK chart is that you will not see the actual highs and lows produced by candlestick wicks.
I will also use a candlestick TICK chart and will place audio alerts at +1000, +1200, -1000, and -1200 readings. Other than that I do not focus on it as much.
-
It is always important to look for clues that cause a shift in market sentiment. One method I use is by bracketing a TICK chart. Whenever TICKS breakout of a 2 hour range, this is usually a strong signal of a shift in market sentiment.
For example: In a downtrend, if TICK's make a new 2 hour high I will look for a long setup. In an uptrend, if TICK's make a new 2 hour low I will look for a short setup.
This method also works when the TICK is stuck in a channel. Anytime the TICK breaks out of a channel, expect to see price move in that direction.
-
Just graduated from college and looking to start trading the FOREX markets. Ive been looking into brokers and seems like FOREX brokers offer huge leverage. They also guarantee my stops so I can only lose what I put in. Any advice on a sufficient capital for trading?Just made a post regarding capitalization. Remember, money management is everything. Take a look here.
http://www.traderslaboratory.com/forums/options/94-can-some-one-please-help.html
-
This is what happened at the overnight session. I am sure alot of new traders who went short at the closing assuming market weakness got burned.

By understanding market concept, you could of placed yourself on the long side at the close.
-
This is an interesting chart from 8/14/06. This is a typical mistake that new traders will make. The markets decline from the lunch hour doldrums into the close for roughly 100 points. They will look at this decline and assume a weak market. I am sure some new traders went short at the close.
Looks are deceiving. Lets take a look at the bigger picture. If we visualize a market profile chart from the candlestick chart below, notice that we are actually trading at a higher value. This concept is crucial for market understanding. Price were not accepted within or below value indicating market strength. Although the 60 point gap was filled we have established higher value.

-
I do not trade options so I can not provide you an exact answer. But when trading emini futures contracts I recommend $10,000 per contract. One thing you want to avoid is taking more risk than your trading capital. Most traders lose because they are undercapitalized.
Also, the amount of starting capital depends on your trading skill. A professional trader can make money of a $10,000 account. However, a new trader will need enough capital to survive the steep learning curve. I usually tell new traders to have approx $30,000 - $40,000 risk capital available. First I will recommend new traders to study the market they are trying to trade. If it is the emini, I believe it is alot easier to trade in quarter lots than single-lots. Why? Trading 4 contracts allows you to scale out to minimize risk while you can not trading 1-lot.
Let me explain: In the index futures, there are many times where the contract moves 10 dow points in your favor just to reverse and stop you out for a -10 point trade. When trading 4-lots, by scaling out half at +10 points you have eliminated risk for the other half position. Your only loss is a commission loss.
I hope this helps and good luck with your journey.
-
Value area is a level where both buyers and sellers perceive price to be fair. When there is greater confidence from either the other time frame buyer or seller, this will cause market imbalance of supply and demand and price will break out of value. When trading with market profile, you must always ask yourself questions such as: What is the market trying to do? In which direction is it trying to go? And is it doing a good job in going towards that direction?
Once prices break out of value and is accepted, a new value area will form. Thus, there is market acceptance at these new levels. Market acceptance vs market rejection. These are two important concepts to understand.
The only tools I use to anticipate breakouts are market internal tools. These include the TICK, TRIN, put/call ratio, and the PREM. Whenever the TRIN is uptrending I will anticipate a breakout to the downside. For example, if the TRIN is in a stready uptrend and prices have reached the value low pivot I will anticipate a breakout to the downside. Another useful tool is the TICK. If the TICK has spent the majority of the morning session above the zero line, I will anticipate a breakout to the upside in the afternoon session. The PREM I use to see the number of buy programs vs sell programs. The put/call ratio I use to judge how many market participants are short and long. If the put/call ratio reaches a high extreme number, this means that alot of traders are short. Therefore I will try to be contrary and look for long setups and vice versa. Hope this helps.
-
Stats for the YM; mini-sized Dow ($5)
Here are some stats based on the TRIN at the market close. One strategy is to buy the dow at the close on a high TRIN reading. The idea behind is that the markets are oversold and expect the market to gap up the next morning.
Stats are based on the last 2 years from 2004 May to 2006 May.
When the TRIN closes above 2.0, there is a 64.7% chance that the markets will open higher. This has happened 17 times over the past 2 years.
When the TRIN closes above 1.9, there is 71.4% chance that the markets will open higher. This has happened 21 times over the past 2 years.
When the TRIN closes above 1.8, there is a 69.6% chance that the markets will open higher. This has happened 23 times over the past 2 years.
When the TRIN closes above 1.7, there is a 76.7% chance that the markets will open higher. This has happened 30 times over the past 2 years.
When the TRIN closes above 1.6, there is a 73.2% chance that the markets will open higher. This has happened 41 times over the past 2 years.
When the TRIN closes above 1.5, there is a 70.9% chance that the markets will open higher. This has happened 55 times over the past 2 years.
Do not take this information and blindly buy the Dow Futures contracts at the close. This does not take into account the overnight action. Prices can drop overnight to stop you out then take off to the upside. Therefore, adjust your strategy accordingly. A trader I know will wait until after hours to buy. This allows a better fill at times. Remember, this setup requires a wider stop and depending on your risk tolerance this strategy may not be for you. I usually minimize my position to a quarter size and use a 40 point stop on the dow mini's. Due to the high percentage of the setup, I am able to risk 40 points on a quarter size.
-
The link below is a complete list of market indices. Compatible with Tradestation platform. Symbols may vary depending on your data vendor.
File is ia PDF format. Right click the link => Save file as => Select a location to download file
-
Heres a simple method that you can use to anticipate the trading range based on the previous days range. We use only Fibonacci numbers of 1.27 and 1.618.
First we identify the previous days range. In this example lets take the S&P 500 emini:
High: 1294
Low: 1281.50
Range: 12.5
Second, we take the
(Range x 1.27) + Previous Day Low
(12.5 x 1.27) + 1281.50 = 1297.375
This is our first estimated high.
To get the low:
High - (Range x 1.27)
1294 - (12.5 x 1.27) = 1278.125
This is our first estimated low.
Third: We use the same exact formula but replace 1.27 with 1.618.
High:
(Range x 1.618) + Previous Day Low
(12.5 x 1.618) + 1281.50 = 1301.725
This is our second estimated high.
Low:
High - (Range x 1.618)
1294 - (12.5 x 1.618) = 1273.775
This is our second estimated low.
Now we get two estimated ranges: 1297.375 - 1278.125 & 1301.725 - 1273.775.
Hope you find this useful.

-
This information is only available in Tony Crabel's, "Day Trading With Short Term Price Patterns and Opening Range Breakout". This is a mathematical formula used to play the opening range breakout. If you are unfamiliar with this method it may sound complicated but bear with me.
First Step: you get the (High - Open) and the (Open - Low)
For example: Let's take the S&P 500 emini contract
High: 1294
Low: 1281.5
Open: 1290.50
(High - Open) = 3.5
(Open - Low) = 9
2nd Step: You take the minimum of the two numbers. In this example the minimum would be 3.5.
3rd Step: Add the minimum for the last 10 trading days and divide it by 10. So you would add 3.5 to the minimum of the previous 9 days. In total you will have 10 numbers. Divide that by 10 to get the average.
4th Step: For example, let's say you get a 10 day average of 2.5. You simply play the breakout of the opening range. If prices open up at 1293, you would buy a breakout above 1295.5 and short a breakdown below 1290.50.
Simple and easy. I have not tested this to work but I know this was a famous opening break method amongst the professionals for many years. Alot of traders still use this method. Some may chose to take the 10 day average minimum and multiply it by 1.1 or 1.2 to make slight adjustments to the markets they are trading. Hope it helps.
-
Tape reading is perhaps the hardest but most effective skill in trading. When I first started learning the tape, I would stare at it for 8 hours a day for approx 10 months before it started making any sense to me. After hundreds of hours of practice you start to see visual clues on the tape that will help you time your entries and warn you of short-term price reversals.
In this picture I want to go over just one method on tape reading. Although this does not happen all the time, this pattern is one of the most highly effective methods to capture a short term price reversal. The concept is simple, however, the timing is hard. This can happen in a matter of 1-2 seconds so if you miss it you pretty much have to pass on it.
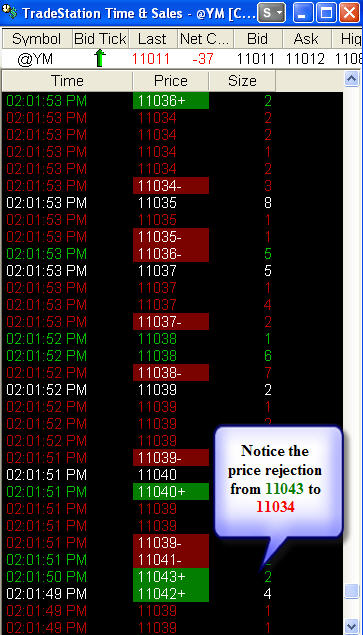
Here's the method: As price approach a key level, watch the tape carefully. What you are looking for is a quick price rejection on the tape. Preferably 1-3 prints of a certain price and then a quick rejection back down/up. For example, if my key price level is 12100 on the dow mini's, I want to see 1-3 prints of 12101 then a quick rejection back to 12099, 12098, 12097. etc...
A picture is worth a thousand words. (see attachment)
In this example, we saw a beautiful single print at 11043 then a quick rejection of price. There was simply no buyers willing to bid at the 11043 level. We then saw prices fall on its own weight from lack of demand back to 11034.
-
Terms are taken from Tony Crabel's famous book, "Day Trading with Short Term Price Patterns & Opening Range Breakout".
This book is extremely rare and close to impossible to find. I have seen copies being sold on ebay for close to $1000.
NR; Narrow Range - Today's trading range was narrower than the previous days range.
NR7; Narrow Range 7 - Similar to the NR. The range was the narrowest compared to the last 7 trading days.
WS; Wide Spread - Exact opposite of the NR. Today's trading range was wider than the previous days range.
WS7; Wide Spread 7 - Similar to the WS. The range was the widest compared to the last 7 trading days.
Inside Day - Price bar in which the high is lower than the previous days high AND the low is higher than the previous days low.
Outside Day - Price bar in which the high is higher than the previous days high AND the low is lower than the previous days low.
IDnr4 - An inside day with the narrowest trading range in the last 4 trading session's.
Bear Hook - NR with Open < Previous Low and Close > Previous Close.
Bull Hook - NR with Open > Previous High and Close < Previous Close.
Stretch - The 10 period SMA of the absolute difference between the open and either the high or low, whichever difference is smaller.
-
Pivot point setup trade. Here's how I play pivots. I place a buy order 2 ticks above the actual pivot at S1. I do this to make sure I get filled. I use a 10 point stop and scale out half at +10. I move my stop to breakeven so I have half a position left with no risk.
Then I will scale out a quarter at +20. I will leave my stop at breakeven for my last quarter position.
In this chart, my entry is at 11074 (plus 2 ticks above S1). I let go of my first half at 11084 and a quarter at 11094. 11094 is also a great place to exit because it is directly at the monthly pivot. Also notice the value low pivot at 11006.
The last quarter I will try to hold on by using smart stops and will let the markets stop me out. In this case, I was able to hold on until the close.

-
NYSE TICK: The TICK is the numbers of upticks on the NYSE versus the number of downticks on the NYSE. For example, if 1000 stocks are ticking up and 400 stocks are ticking down you will get a TICK reading of +600. The TICK is a tool for understanding market internals.
One of the best ways to use the TICK is to fade the extremes. A TICK reading of -1000 or -1200 is fairly rare but when they do happen, it is usually a good fading opportunity. The markets will usually bounce after such extreme negative readings. The TICK can also help you from chasing the markets. Instead buying when the TICK is reaching +1000, buy the pullback of the TICK. Wait for a retracement of the TICK back to the zero line and buy the moment the TICK hooks back up at the zero line.
The TICK is sort of like the engine and price the car. If the TICKS are heading upwards but price can not lift, this is a clue of market weakness. Ideally you want both TICK and price to follow each other. If TICK makes a new high, you would prefer to see price making a new high. If price can not, you will have a TICK and price divergence and a good fading opportunity.
I will also bracket the TICK extremes. I plot a horizontal line across the low and high TICK readings. If I am long a position and the TICKS reach the upper extreme for the day, I will look to close out at least 3/4 of my position.
I hope this gives you a brief idea on the NYSE TICK. Feel free to post any questions regarding the TICK and trading setups using the TICK. Thanks
-
This is a great book for any new traders/investors entering the financial markets. This should be a required reading for all economics classes in universities. Very in depth workbook on the stock market that can help new market participants to drastically reduce their learning curve. If you plan on trading stocks without market knowledge, this is a must read. Alot of useful information and resources. I personally recommend this book and "The Intelligent Investor" by Benjamin Graham to any new trader/investor I meet. They always love it.
This book can be considered as a financial reference book/textbook. Although the trading strategies mentioned in this book are basic, this is a great pickup for any new trader entering the market.
-
The best kept secret. In my opinion this is a book well known to professionals and not to amateurs. Most people lose money in the markets.
Originally published in 1931, this is a classic book focusing on tape reading and price and volume analysis. Why is this book so important? Tape reading and volume are pure information. Being able to read both gives you a tremendous edge over other traders. In my opinion it is as good as "Reminiscence of a Stock Operator". I have gained tremendous market wisdom by studying Neill's book over and over. Neill takes a true contrary approach as noted in one of his advices to investors: "beware of the crowd. When everyone thinks alike, watch out. They're probably wrong."
This is ranked 3rd next to Reminiscence of a Stock Operator and Mind OVer Markets in my all-time favorite trading book.
-
Intuition takes years to develop and is one of the key personal elements to trading success. Intuition is different from emotional trading. To get to this level of trading, it can take years of market experience and thousands of actual trades. This books includes:
* Interviews with preeminent psychologists and psychiatrists about developing intuition
* Extensive exercises that show the reader how to use intuition to enhance trading performance
* Words of wisdom from successful traders and investors, including Tony Saliba, Linda Raschke, Paul Tudor Jones, Jimmy Rodgers, and George Soros
I highly recommend this book for anyone interested in reading further about trading psychology. A valuable book to add to your collection.
-
Possibly one of the most underrated trading books of all time. This book is packed with statistical data of every type of technical chart pattern in both bear and bull markets. Bulkowski explains how to trade these patterns with precise measuring rules for exit points. If you are a technical trader this book is a must read. Bulkowski includes a section called "Focus on Failures" for each pattern. From pure technical information, Bulkowski explains how to anticipate such pattern failures. He also points out several patterns that will help traders identify a pattern failure in place.
If you are a technical trader based on price patterns this is a true gem to your trading library. This is a great reference book for traders of all levels.
-
Trading is 30% mechanical, 170% pyschological. The true holy grail is mastery of self. Understand your psychological elements and trade accordingly. Without self-knowledge, traders are destined to fail. Of course, mastery takes a lifetime. The market is your teacher. Learn from her everyday.
-
Are you addicted to trading?
in General Discussion
Posted
Yea.. thats hilarious. I think I've seen that one before. Imagine being in a position, you could be stuck in there for hours