
Welcome to the new Traders Laboratory! Please bear with us as we finish the migration over the next few days. If you find any issues, want to leave feedback, get in touch with us, or offer suggestions please post to the Support forum here.


HAL9000
-
Content Count
241 -
Joined
-
Last visited
Posts posted by HAL9000
-
-
After not trading on sim for a while, mainly because the lack of time during last week, and because I am in the process of sorting things (out), I have just done two little scalps today (the major move down had already stalled/paused).
Emergency stop would have been 12 ticks, but I have tightened it.
Two clean and easy trades in my view.
When I started to try trading futures, I decided that 50 bucks on one contract every day would be nice. Maybe I have become greedy in the meantime.
But today ... this should be it. (Daily target)
Brown - BTW. Step 3 on my thread will show your approach on my chart(s).
I will write it tomorrow (I hope).

-
Step 2:
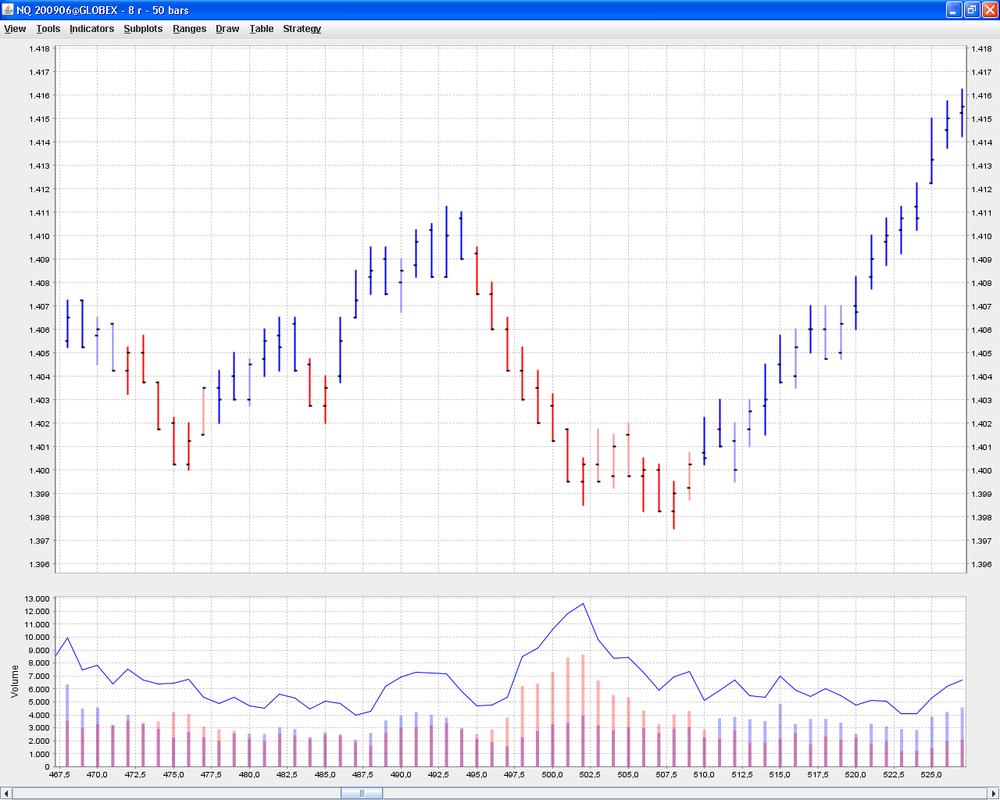
In an earlier post, I said that I will write more about Heiken Ashi, but this would be somehow misleading. So instead, I will write about about my color coded bars. I use these kind of bars already for quite some time, but I have modified the algorithm often, maybe trying to find the perfect picture. But there is none.
I think that this is easy to understand, because basically the color of the bars just depends on price versus a weighted, fast moving average. Well, and light colors appear, whenever the comparison with a 5 linear regression line, tells a different story (this often highlights the beginning of a pullback).
Now, looking at the chart below, it might be tradeable, if you just enter pullbacks into the direction of the dominant trend, but using these bars without a further context on quick charts, often tricked me into stupid counter-trend trades (because I hoped for more than a pullback). These trades then quickly ended up stopped. And, oh well, sometimes I have even allowed these trades a wider stop.
BTW.: I think this was my major mistake, combined with realistic (tight, sometimes too tight) stops and unrealistic targets (runner against the trend).
But what might be a good context for for these colored bars. Well, in step 1, I mentioned trend lines and s/r lines. Again I haven't drawn any lines, but where do the important color changes start?
They start when trendlines have been broken!
So if the context is given by these lines, the question comes up, if finally these colored bars are needed? For now I will keep them on my charts, but maybe at some point in time, I will not need
them anymore.
Its much more about patterns like HH, HL, LL, LH, as I see it now, but as I am used to use these colored bars, they can help me now to visualize these patterns (and their strength).
-
I found this post on "Re: Why ADX > 20 Is a Lie + Easy Trading Method" interesting and have nominated it accordingly for "Topic Of The Month June, 2009"
-
Step 1:
Lets define the point where we start.
And as I see it today, this might be all one needs,
so later on, we always have to come back to this simple view
and ask ourselves, does this new tool/indicator helps us,
or adds it just more decision points, which then might lead into
confusion.
But what is my starting point?
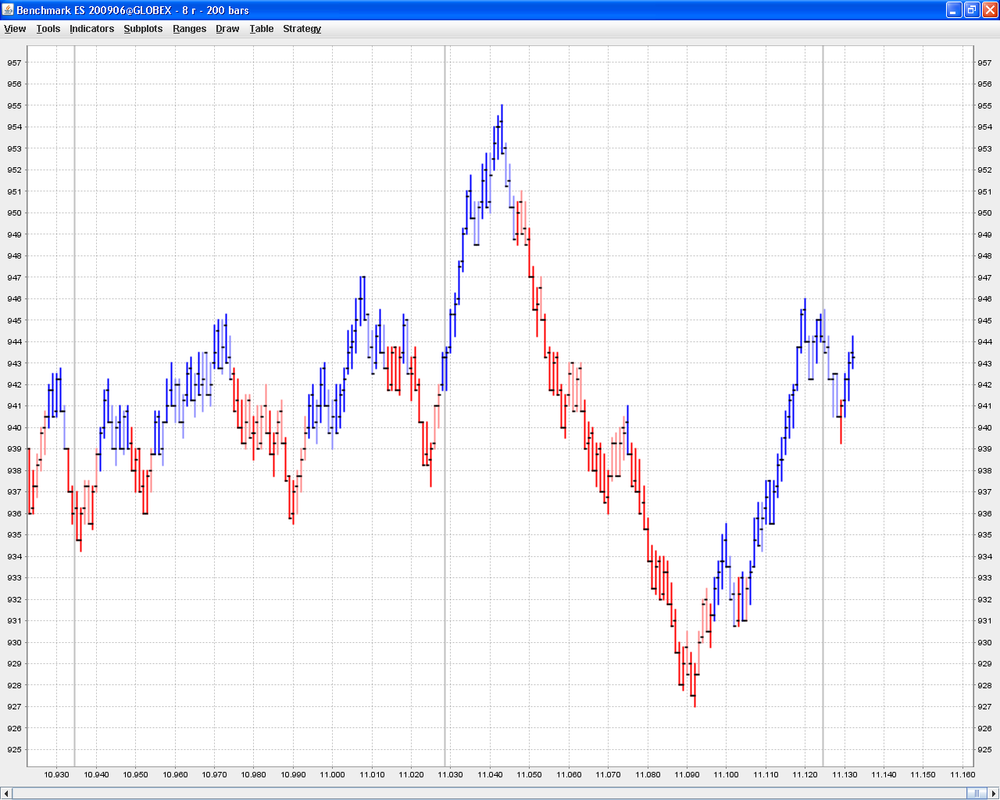
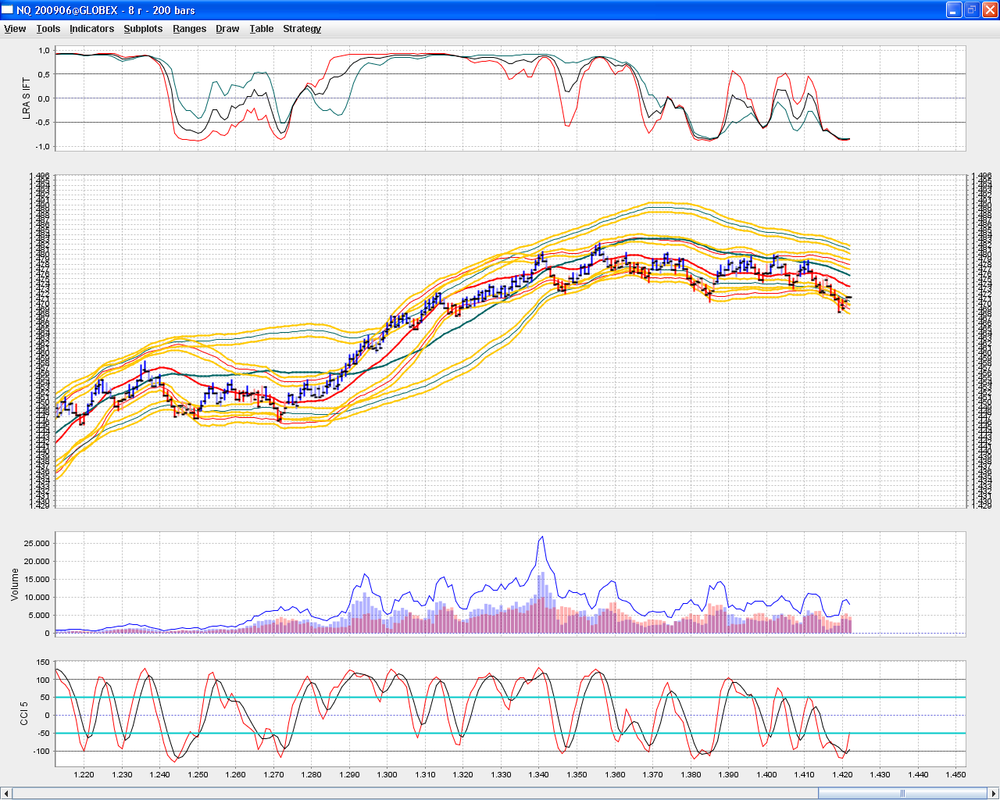
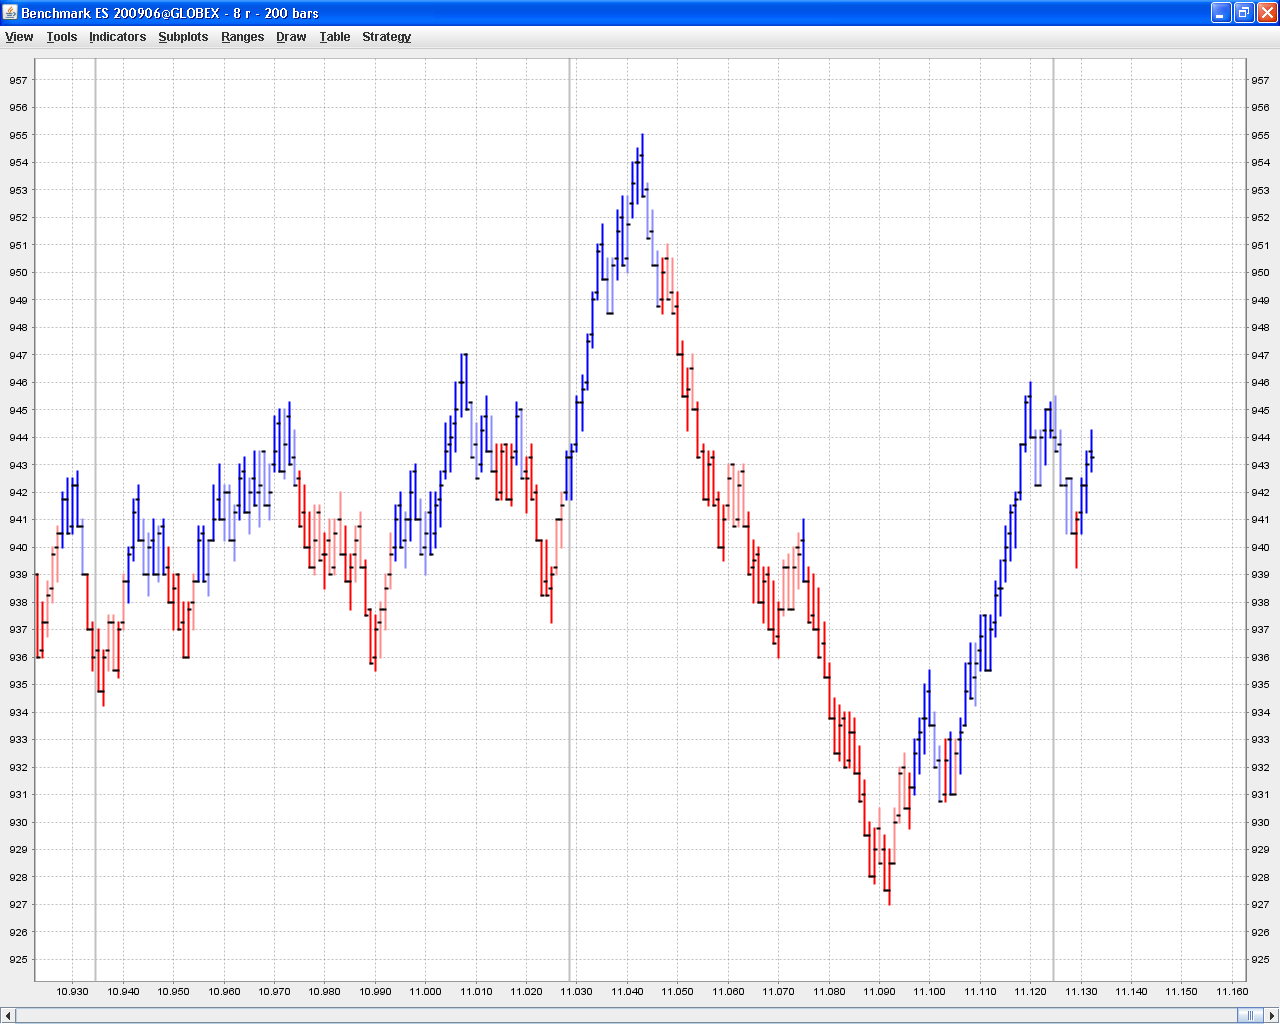
Its a 8 tick range bar chart, which includes the night sessions.
(Sometimes a bar has more then 8 ticks, that is because I use 5 s bars as feed.)
I also look at 4,12,16 tick range bar charts, but I like the 8, because it has a high resolution,
but is not too noisy at the same time.
Furthermore in my view, range bars have a big advantage, if you use 24 h data.
They just show the price movement, while time or volume is filtered out.
So many indicators, don't have to readjust themselves, when the RTH starts.
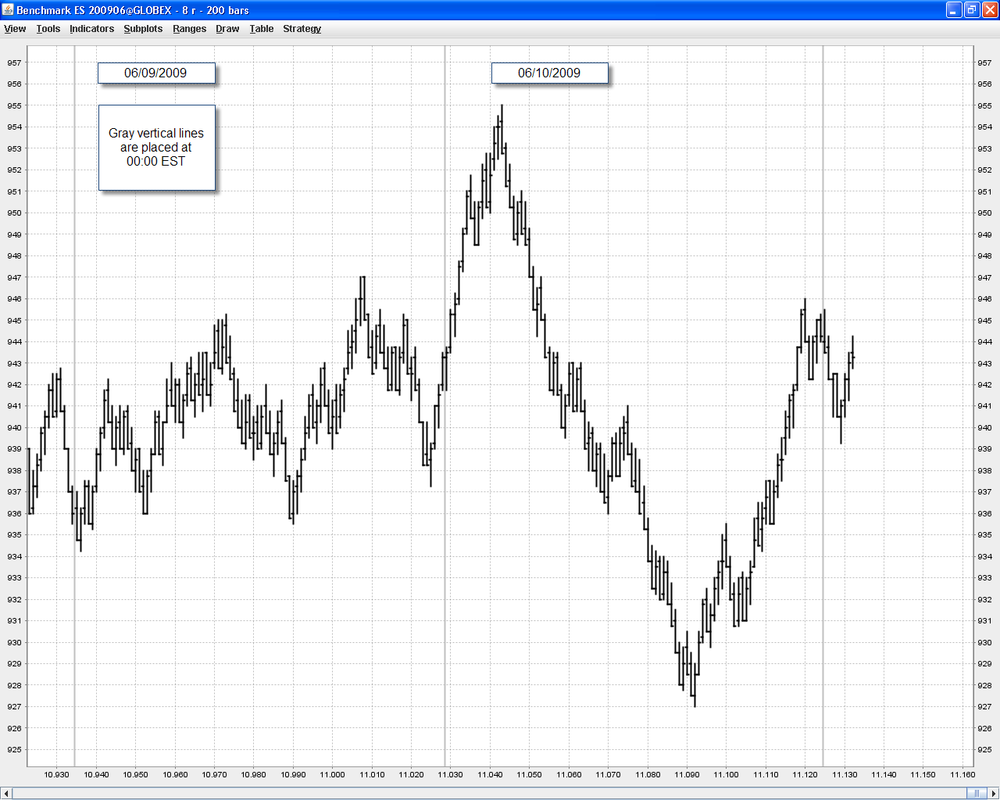
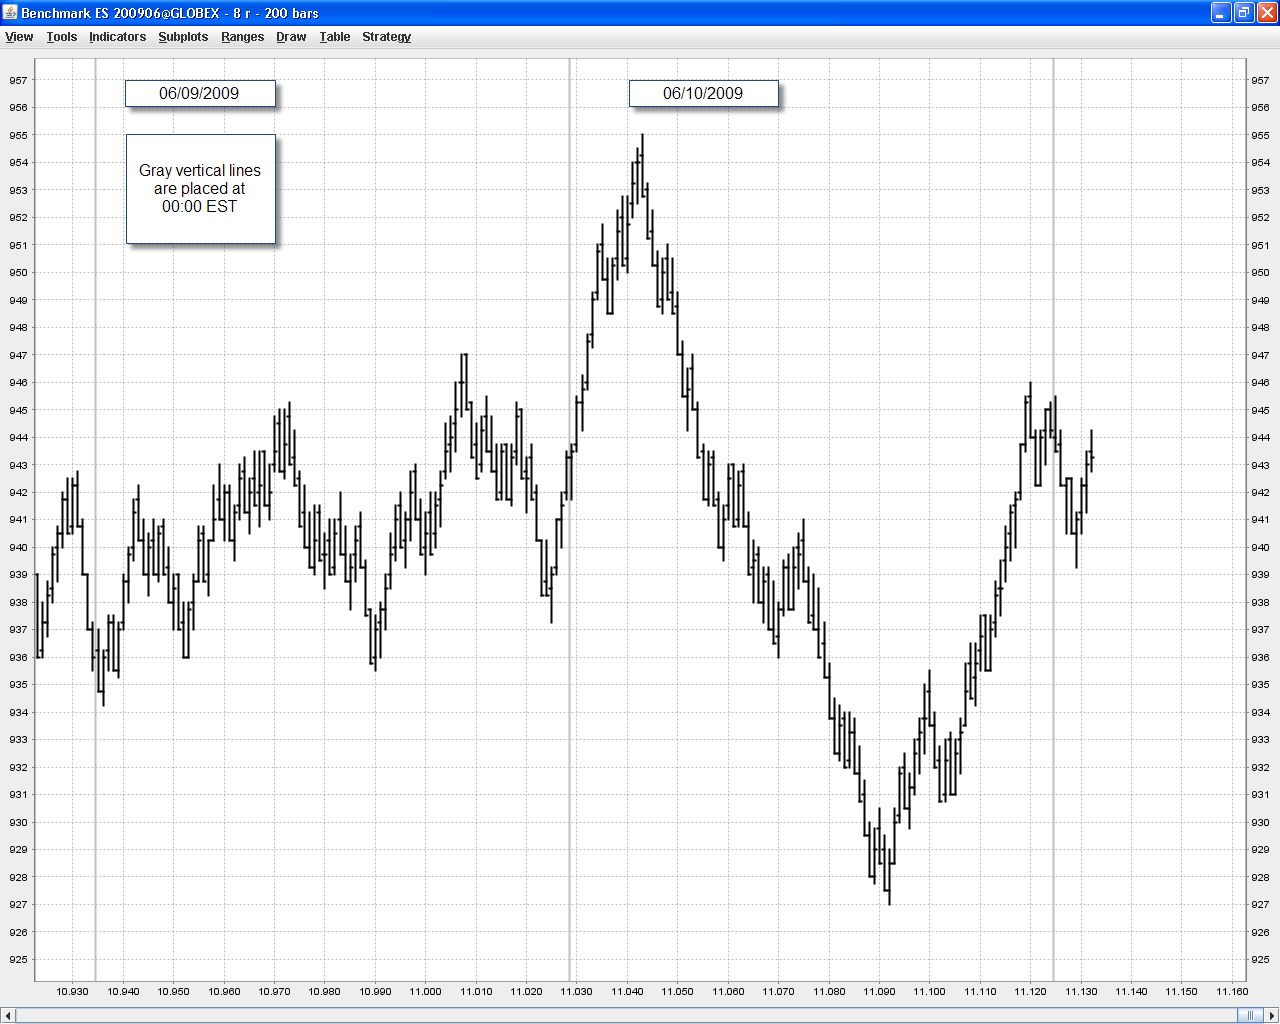
The chart below shows the last two days.
And within the next steps, I will use this chart again, so that there will be variations
of the same picture again and again.
Looking at this chart, I think its obvious to think about trendlines and s/r lines.
I haven't drawn them in, but maybe the first rule should be, respect these lines.
-
- BlowFish, Daedalus:
Thank you both for your comments.
Yes, I will try to be accountable here.
In case I do this seriously, this should help me to clarify some things for myself.
Regarding Heiken Ashi. I know about the TTM Rotation concept, and I will
show it here too, combined with Brownsfans approach.
One of my mistakes in the past was, to mix things up, and trying this and that at nearly the same time.
This experimenting might be good for learning, but its not good for real trading. So its now about to sort things out.
Keep what works, throw away the rest.
And now its time to write my first real post.
-
Hal - please consider starting w/ something that we discussed here. I would like to see how you develop w/ something so simple. It may not end up there, but worth a shot.Hi Brown,
yes, I will not forget what you have posted, I think that this (your comments on my post) is a way to consistent gains!
I will give you my thoughts now, upfront on what will follow.
I have seen how you trade, you trade at the beginning of the RTH,
in other words, during the morning. And that is the key, why it works.
Without any back testing, I just see it. Lets call it common sense.
You know I have tried tons of methods and failed.
So your method used on my charts or naked charts is one thing I will try to discuss here.
There is also a plan B.
I search for something, that is me. If you like to see it this way, its my ego trip. I will discuss that too, I think that I see something, or again, in other words, that I have discovered one of my major mistakes.
And maybe this will add some value here.
Just saying it very carefully.
Regards,
Hal

-
How should I start?
This is my first thread, and my intention is, that this will be my only thread.
But what have I to tell you?
First of all, I am not consistently profitable yet.
Or in other words: I would loose money, if I would trade real!
Keep that in mind, if you read my thread, because you might die trying following my approach!!!
(Thought about this as an alternative, strange thread title.)
Won't get fooled again, why such a strange title?
Well I fooled myself often in the past, too often.
Now about this thread:
I will try to build up a strategy that works for me.
I will nearly start from scratch, and go step by step.
Everyone is invited to post comments or questions.
I don't know, if this thread will just end up in another failed ego trip,
or if it will produce something of value.
Just give me some time, I think that I see something that is worth to be shown and/or discussed here.
BTW.: From time to time I will post some music videos too,
I hope that these will stay available and are viewable in your country.
And while you give me some time, until it might disappear, enjoy this one:
[ame=http://www.youtube.com/watch?v=aQUAxN9Sxdo]Won't get fooled again![/ame]
P.S.: If you try to watch the video, and it tells you, that you should try later, instead:
try to click on the text above the video picture ("Won't get fooled again").
This should redirect you to youtube, and at least, it works for me.
-
Hi , as I see it you add values that are 0 or 1.
But in a downtrend, you would have to count it -1
so what about if ... else if ... < ... then -1.
If the values are initialized with 0 as it seems, you don't have to care about the equal case.
Its just my thought, cause I don't code in EL,
but I hope it might help you.
Hal
-
Hi again, Elovemer.
Like others I am just a lurker, but it is as it is, some people are more interested in some technique,
some people focus on other techniques, so if I would post my technique of
choice here, it would not been related to Taylor. But I like to learn Taylor's technique.
But why I post here?
Initially I saw an escalation coming. But my message was peace.
OK, but there is another point.
You always ask for our methods (Taylor methods).
So, I have to admit, that I have no Taylor method yet.
But what I can't understand is, why you don't say,
that you post your interpretation of Taylor,
and I guess, others their interpretation.
And finally the often unknown reader (like me) takes the good thoughts and forgets about
the bad thoughts. (And what is good or bad might be depending from the view of the reader.)
I have no problem to say that I am still not consistently profitable.
If you are consistently profitable, why you just don't say, I post my variation of Taylors
method (i.e. not TRUE Taylor).
Regards,
Hal
P.S.: Once more PEACE. And please don't ask me to contact you via PM.
Because, what I can't write here for all eyes visible, I will not write secretly within a PM.
-
Thales, Brown -
Thank you both for your comments about my charts,
sometimes I think that a clean chart is much better tradeable than one with many indicators. On the clean chart you can see the trendlines and s/r lines, even if you are not drawing them.
Brown, your approach has merit, I think that it should have produced winners today,
but I haven't checked it yet.
I currently read Law of Charts, and then I will read about the TTE.
After that I will try to sort things out. And then I will start a thread.
I think then it will make sense.
Hal
-
So you are saying that the noise, by your standard is 5pts and the stop needs to be placed outside of that - sounds logical. And, that your targets are less than 5pts, so effectively within the noise?
Hi MidKnight,
I promised to explain a little bit more, so here it is for you and all other reading it, and I hope it will make sense.
Some thoughts, some explanations.
First of all, the absolute value of what you consider to call noise is somehow dependent from the (time) frame you trade, I guess we all know that.
I like to think about signal to noise, and yes, it plays a role within some sciences,
but lets keep it simple and forget about signal to noise for a moment.
So the question stays, how do I come to the view, that it is clever to use a
5 point stop trading the NQ, while I often just take 1 point profit.
This should be against risk/reward and therefore this should just lead into ruin.
So now, how should I start, I had and have a problem: Early entries.
So last week I looked on a chart like the one below.
Just on price movement, and counted 3 points up, 2 points down, 6 points up, 4 points down ...
So within a trend there a pullbacks, some may measure them as 61.8% retrace, some might call them ambush trades (50 % retrace).
I often found these 3/2s and 6/4 while larger pullbacks might be viewed as new trend, even if just temporary.
So I thought, assuming that I don't take the worst entries,
that a 5 point stop should keep me out of most of the trouble,
and also saves me, if there might start a trend change.
Now if you add other indicators like the linear regression bands you often see double bottoms or tops at the bands,
and these indicators look different on different (time) frames.
So that can be just a help to anticipate what will happen.
Now the 5 point stop gives you some room to stay in the trade or to cut it at BE if the band was violated in a way you don't like.
And well, sometimes you just simply will be stopped out.
Now to the 2 point noise:
The charts below show 2 point range bars (based on 5 s bars, so some are larger and the open of the next bar might be the close of the last 5 s bar, i.e. they are not really range bars).
One idea of me is:
Lets assume that 6 points moves are quite often, but they also stall then.
If you entered missing the first 3 points, why not just exit when 6 points are
reached (with 2 or 3 points profit).
Then wait for a pullback of 2 or 4 points for reentering into the same direction as before.
That would be really playing noise.
Anyway, the idea is somehow in my head, but if you look at my trades,
I haven't traded it yet. So its just an idea.
And now have a look at my charts, and if you like,
start to count the points.

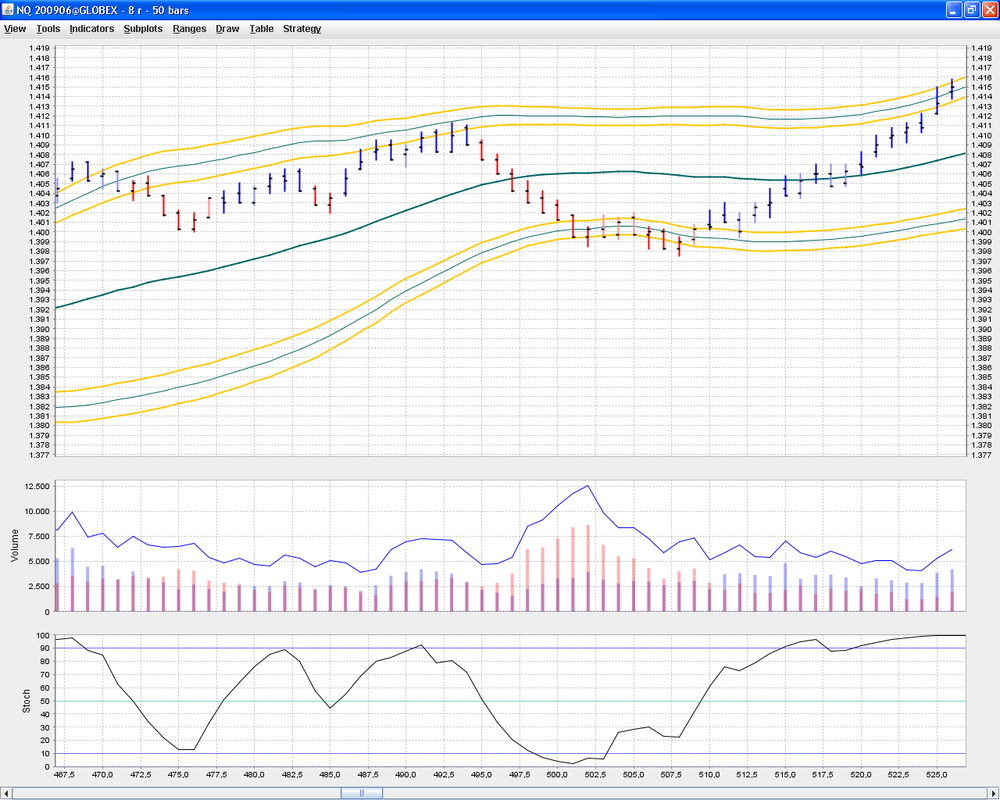
Same view with some more indicators:
-
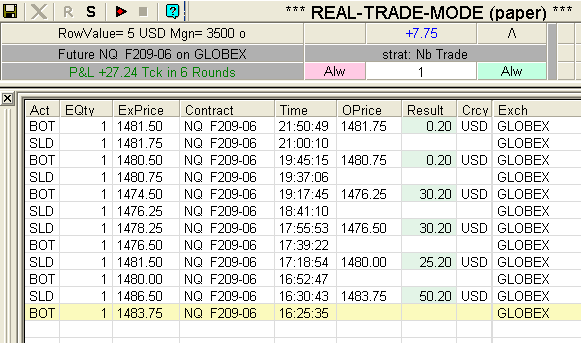
Today I lost focus somehow,
but survived again.
While the first five trades were OK, but maybe not a clever choice,
the last one, was the one I fooled myself with today.
I chased the entry shorting at the wrong point, survived with my stop,
but haven't closed it in green whenever I could,
and after some waves I did it finally for a scratch.
Well and then immediately after that; market went down ... lol
-
I wonder if this is the case for anyone else?
Its the same for me.
I think its because these pictures are not attached to the posts in the usual way via using Attach Files.
Instead the links redirect to an external server somewhere.
Just look at the links regarding to the pictures.
Hal
-
So you are saying that the noise, by your standard is 5pts and the stop needs to be placed outside of that - sounds logical. And, that your targets are less than 5pts, so effectively within the noise?Hi MidKnight,
to keep it simple, based on my entries, and allowing me small mistakes trading the NQ I need a 5 point stop, or 100$. I tried 2 and 3 point stops, but one simple mistake, and you are out. So I think your understanding is right.
I will explain more tomorrow, with a better chart. But on the one I posted the bars are not real range bars, but they are 8 ticks (2 points) or sometimes more. The simple result is early entries would stop you most often, well and late entries with a little pull back too.
Regards,
Hal
-
But the very basic idea is, if the regression line is rising; buy the lower band,
otherwise the upper band, and sometimes in chop, you can use both bands.
Sorry its late, and I can't edit it anymore, but it should read:
otherwise sell the upper band (in case the line is falling).
BTW. also interesting are crossings of the 50/100 centers. Often, but not always, that is the beginning of a rollover.
The 50 leads by definition, so the 100 tends to follow.
-
I am wondering though if you had stayed in many of those trades today would you have been stopped out?The shorts surely would have been losers, and the longs maybe too.
The problem with the longs would have been the exit targets.
But it totally depends, lets say you enter late, so lets take my last trade long at 1476.75.
Now you hope for 1499 or just a new high, because it was up all day.
Hope: You sit in a trap. Stopped.
On the other hand, some longs would have been good for more, but ...
you have to make a decision. And for now + is +. And the next wave will come. Maybe with a not so nice result, maybe with an even better one.
Anyway, what killed me too often in the past, were too small stops or setting a trade to BE too fast. So first many small stops, and as result I capitulated and used larger stops and adjusted them to even larger stops (win back syndrome). Or in other words, finally I managed a loser, like I should manage a winner, just into the wrong direction.
Result: A very large loss!
:helloooo:
-
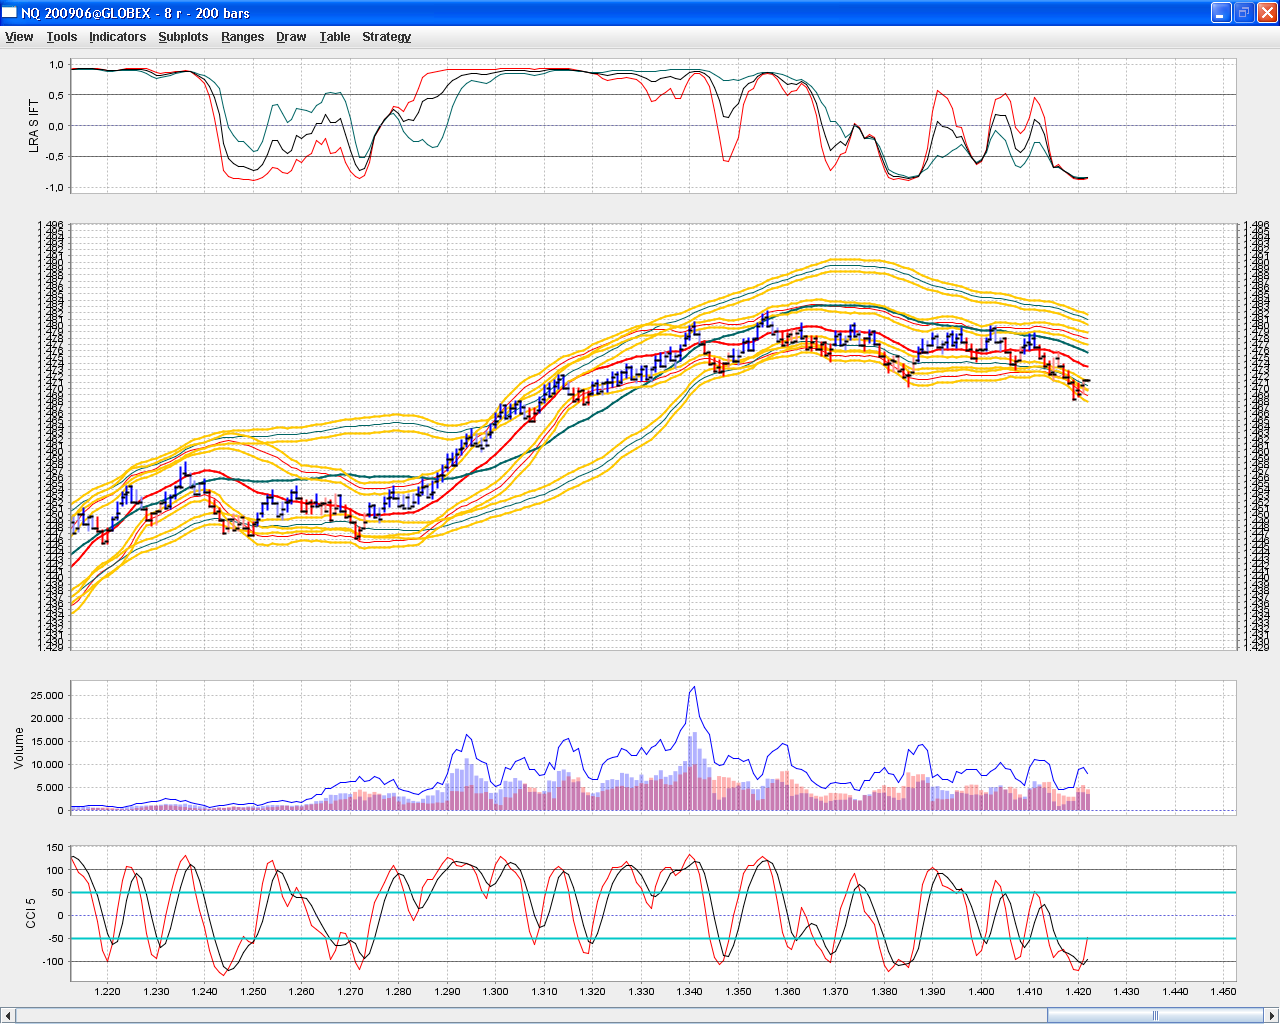
Hal9000, looks like you were similar to me looking for shorts all day.Hi Robert,
My problem today was, that I have missed the first nice long setup around bar 1270 on the attached chart. The low 50 regression band (red) 2 SD's from the center was just touched and then: up we go. But that's hindsight and I was just out of the room, and maybe I would not have acted.
My bias basically was long, but yes the first 3 trades were shorts, but dangerous (I knew it before).
Then it was somehow difficult to enter trades, because I make a break after I close a trade, and sometimes I just miss a good trade this way,
while (or because) the last one was badly executed from me.
But what seems to work for me is the use of a 50 (red) and 100 (green) linear regression with 2 SD bands. For timing a smoothed very quick CCI or stochastic.
I try to avoid counter trend trades now, but sometimes I dare it.
And sometimes my impatience kicks in ...
But the very basic idea is, if the regression line is rising; buy the lower band,
otherwise the upper band, and sometimes in chop, you can use both bands.
With just with one contract exit at the center. With more contracts, you have more options. But well, it sounds so easy, but sometimes I just don't follow my rules, and rollovers are difficult ...
My interpretation now is that a trend often leads to a price area that is then accepted for a period of time (chop). And then it might or might not go further up or fall down ...
Anyway, I still have to play with my pictures a little more. But as a side note, I think its good to just focus on the play, the execution, not on things like money.
P.S.: Doesn't this chart look horrible?

-
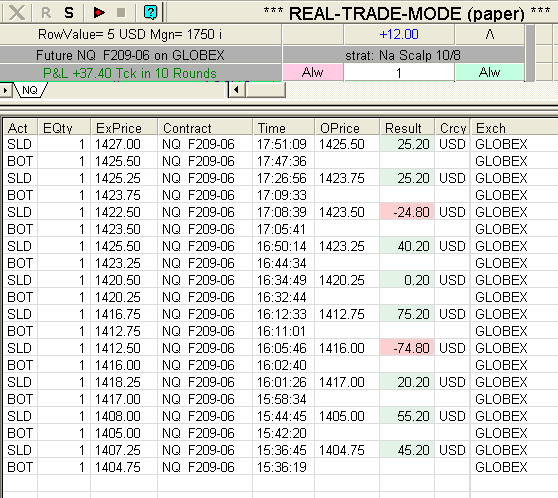
It still seems to me, that I am making progress.
After a long period of time learning the theory, looking for indicators and setups,
I wasn't (and maybe still am not) able to trade them.
But what has changed recently?
I have modified my charts again, and I guess they look horrible,
for anyone else in here, but they tell me a story now.
While in hindsight I am able to find nice runners on them; but runners are not for me.
At least not now. The value in them for me is their short term meaning.
I see the noise inside a half wave.
Only that the emergency stop has to be placed out of it, so my emergency stop would have been 5 NQ points today. Yes at some point in time it will be hit, but it wasn't today.
I don't executed very well today, still my impatience, but when I entered, my focus was on avoiding losses, so I took them home, whenever there was no reason to hold them longer or my entry was too early.
So unlike taking many small (and big) stops in hope for runner (did that too often in the past moving my stop),
I took many small winners ...
So here is my paper trading day:

-
I don't know EL (so its pseudo code) but what about:
if (x <> y) and (y <= 3) then
y = y + 1;
???
-
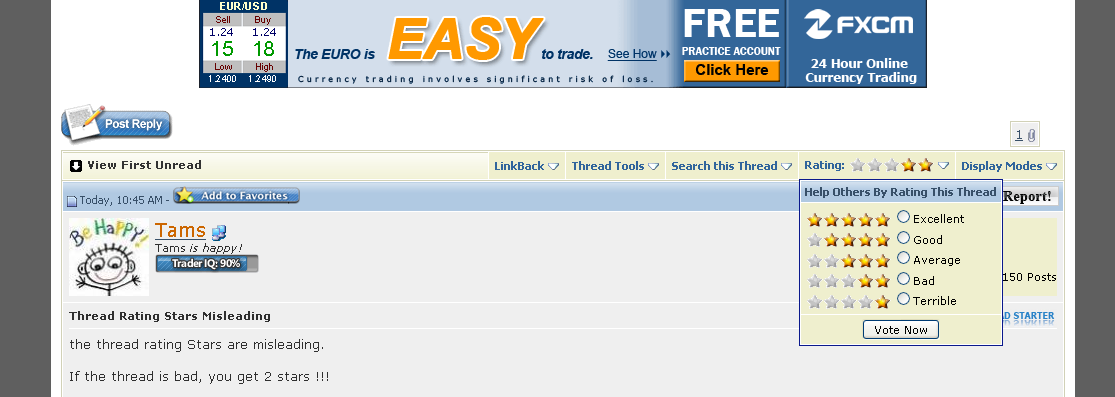
Hi Zdo,
Here is a picture ...
Just click on the arrow relating to "Rating".
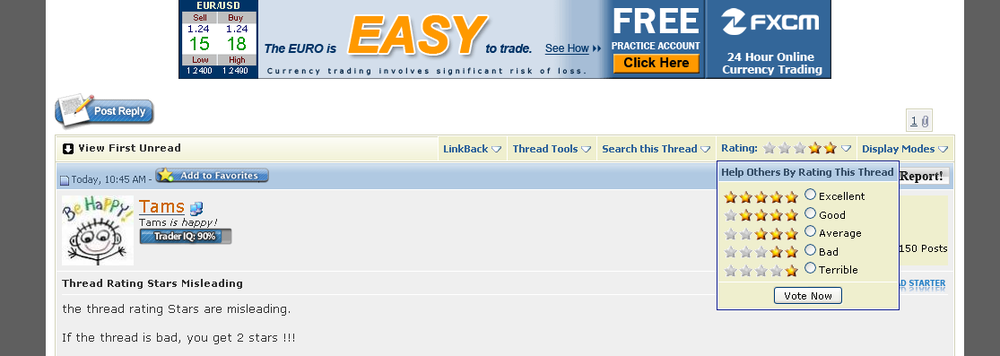
-
During the past weeks I have mainly implemented some things,
and I will go on with it.
During this time I also paper traded.
It was frustrating. Loss after loss, while searching my major mistakes.
Well, maybe I have made a step forward.
One big mistake is my impatience, and I think I have found a
way to solve this problem.
I also switched back to the NQ and don't try to get runners anymore.
Not with one contract.
OK, today I took 10 longs, result 37.40 ticks.
And yes, I have made mistakes today too, more homework ...
-
... the phrase "fractal like" and usually with heavily/extremely influenced. ...Hi HLM,
nice to see you again (last time on CG
 ).
).Now my question: Influenced by drift (trend)?
In that case I have found my syntheses.
Fractals, drift, noise ... everything in a nice co-existence.
Some might add s/r as well.
-
However what is noise.
I once studied Browneen motion in a different context,
but its still in my mind.
So here is my problem.
If I assume that markets are fractal, and this should imply that I am able to use
one setup on every time frame (context), I think that there should be no drift (trend).
Or somehow something (the indicators) have to adjust for the drift or tolerate it or ...
I don't know.
But if there is a large drift on a higher time frame, you should get large errors in lower ones (if you go both sides, i.e. reversal strategy).
So I think, that it is possible, that the market just looks like it is fractal over time,
because they don't like to go to zero and they don't like to go to the sky.
Somehow its all academic, the practical problem is (at least for me), what stop will keep me out of noise while riding the drift. And, how do I recognize, when the drift changes direction. I don't have to recognize it in all frames, just within the one I like to trade,
based on time, volume, ticks, range, whatsoever.
Today I found out one mistake I made on my loosing days, too tight stops, simply placed within noise. Simple problem. Deadly result.
Hal
-
Am I confusing myself?
Reading my answer, I think I have to say, I don't believe that markets are fractal.
I believe that markets are like music.
Lets say you have a wave with 440 Hz (Drift).
Then you overlay this wave with a quicker wave (Noise).
And so on. (More noise)
(Sorry have to search for the correct English phrases tomorrow.
But I think you understand).
I believe in drift and noise.


Open and Free Discussion on Volume
in The Candlestick Corner
Posted · Edited by HAL9000
Just a thought,
what variables are there to play with:
price,
volume (and maybe the number of trades, which might depend on volume, i.e. not a free variable),
time.
Now we can play with these variables.
We can just use different kind of charts.
---
Now my view:
Is it important, whether I get stopped out on low or high volume?
I think not, the stop depends on price,
but it is interesting to see, on what volume the price moves happen.
High volume up, low volume down, etc. until it stalls.
Well, do you have to watch volume, maybe, but s/r lines and trendlines
seem to be more important to me. And these lines are based mainly on price
(at least, if you look at a price chart).
Now this thread is about volume, but what is about time?
I ask this, because I used tick charts for quite while, now I am looking at range bars, and the market seems to follow its rules 24 h a day,
on low/high volume, on low/high trade numbers, in slow motion and on fast track.
I just discovered it for me now,
I thought the old traders used P&F charts,
now I ask myself if range bars are a new form of them?
Anyway, I don't have to switch from a 500 tick chart to a 50 tick at night anymore, and trendlines are as clean, as they can be in my view.
Sorry, that I went off topic, but if my impression is right, doesn't
this imply, that volume can just give you additional hints, while price rules?
Yes, if you play with 1000 ES lots its different compared to play with 1,
but just playing with one would be an advantage then, because you can do it 24 h a day.
Just thoughts.