
Welcome to the new Traders Laboratory! Please bear with us as we finish the migration over the next few days. If you find any issues, want to leave feedback, get in touch with us, or offer suggestions please post to the Support forum here.


HAL9000
-
Content Count
241 -
Joined
-
Last visited
Posts posted by HAL9000
-
-
I have a 1 period xmaHi Neil,
What is an Xma?
I am confused
 somehow,
maybe because of the 1 period.
Or stands x just for exponential?
Well why not an SMA for a period like 1?
Regards,
Hal
-
Thales,
I have deleted these indicators,
because they added complexity.
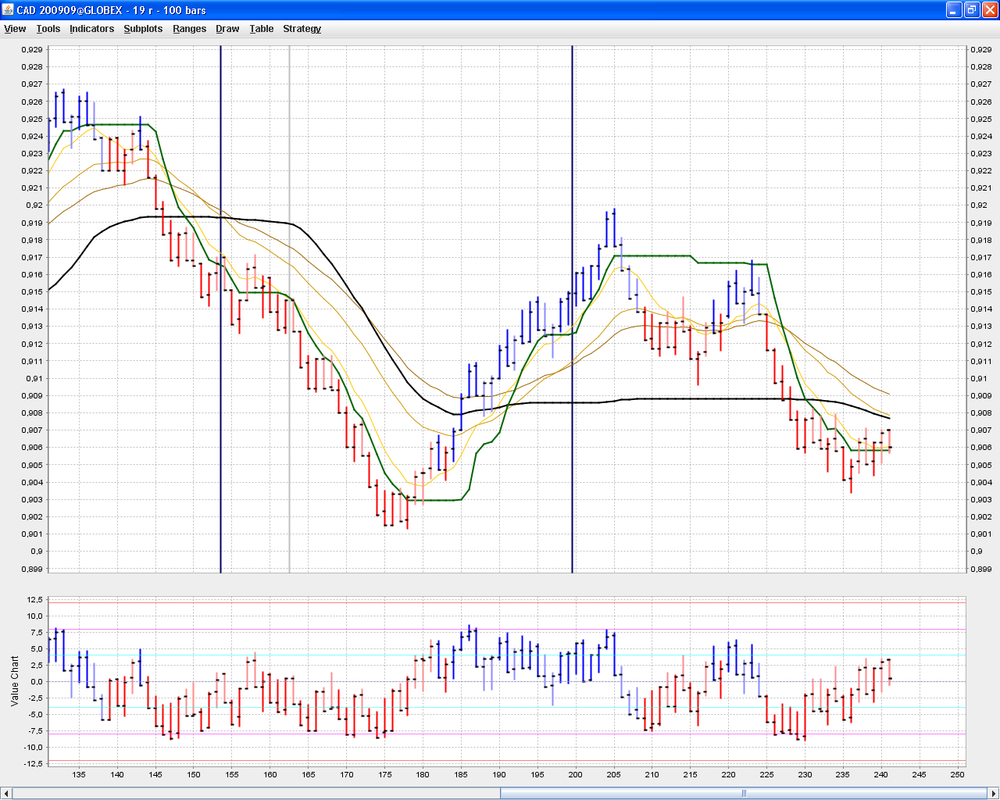
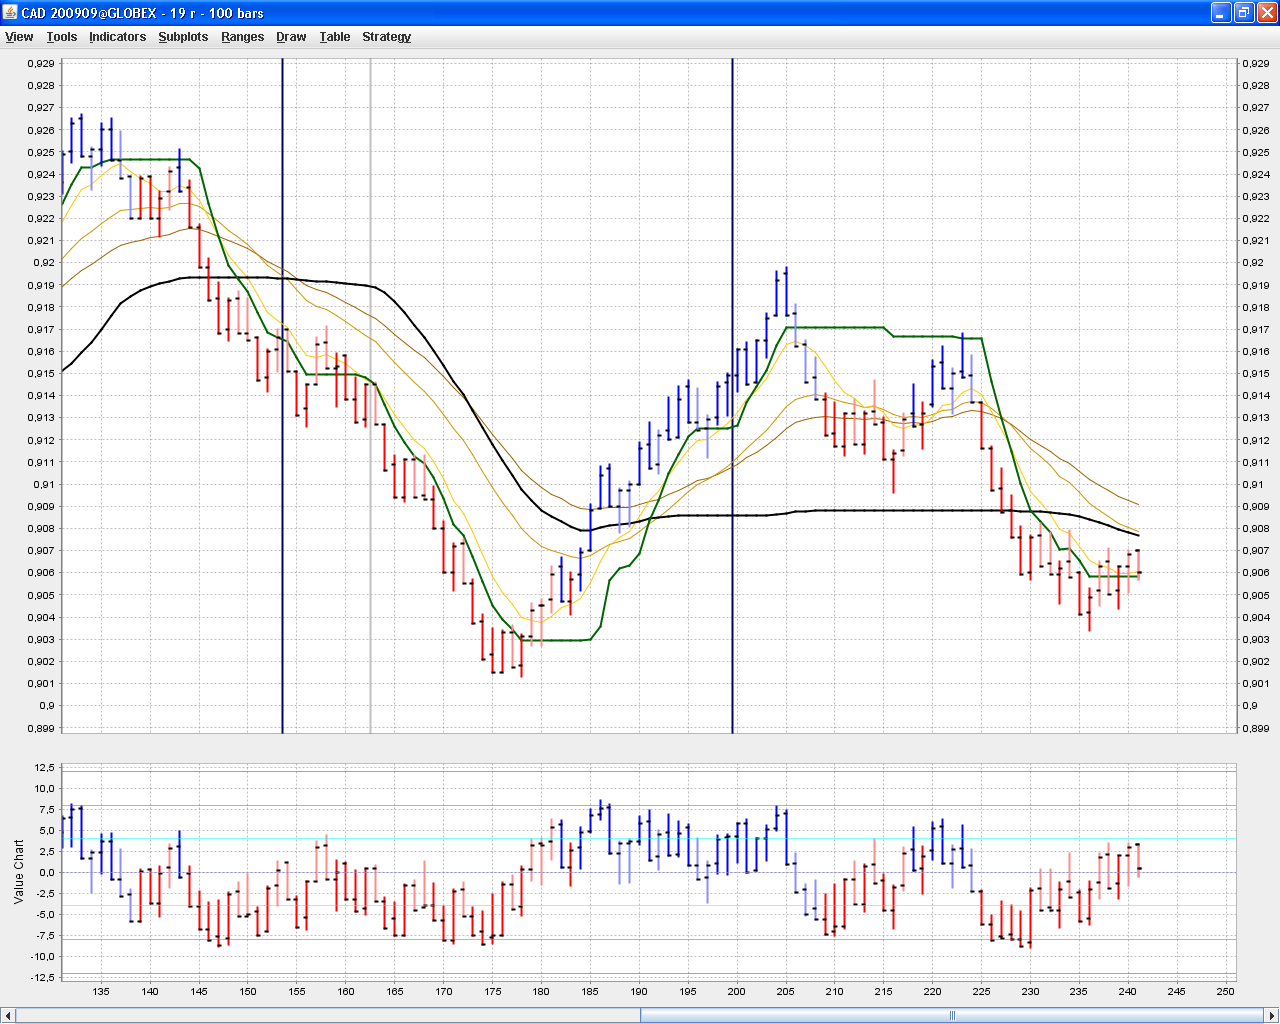
I said, I will play with ranges,
so here is a 19 r (also one I often use) of yesterday and today,
Nothing else is changed.
Regards,
Hal
-
Thales,
I will answer tomorrow,
but yes, I have already thought about it,
but isn't 0.911 visible short term too on my chart.
Well, the black line, well the darkest EMA (34 BTW.),
its just; all tell the same story (confidence?!):
- 34 EMA test, and up again.
- Support test, and up again.
- HL, and up again.
- Relative extreme on VC, and up again.
- Black line test (balance point (more or less), if horizontal), and up again.
Finally its really about money (or trade) management,
not about (parameters of) indicators.
Well, I often violated my rules, but progress
is made step by step. I should know.

Regards,
Hal
P.S.: Just look at the green line. Step by step. 1,2,3,4 ... 5 ouch!
:rofl: Bedtime!
-
Necessary black line test happened!
Why?

:rofl:
And now it depends,
well and also the break will come.
Bedtime, hindsight!

Hal
P.S.: Machines trading today?! :sleep:
-
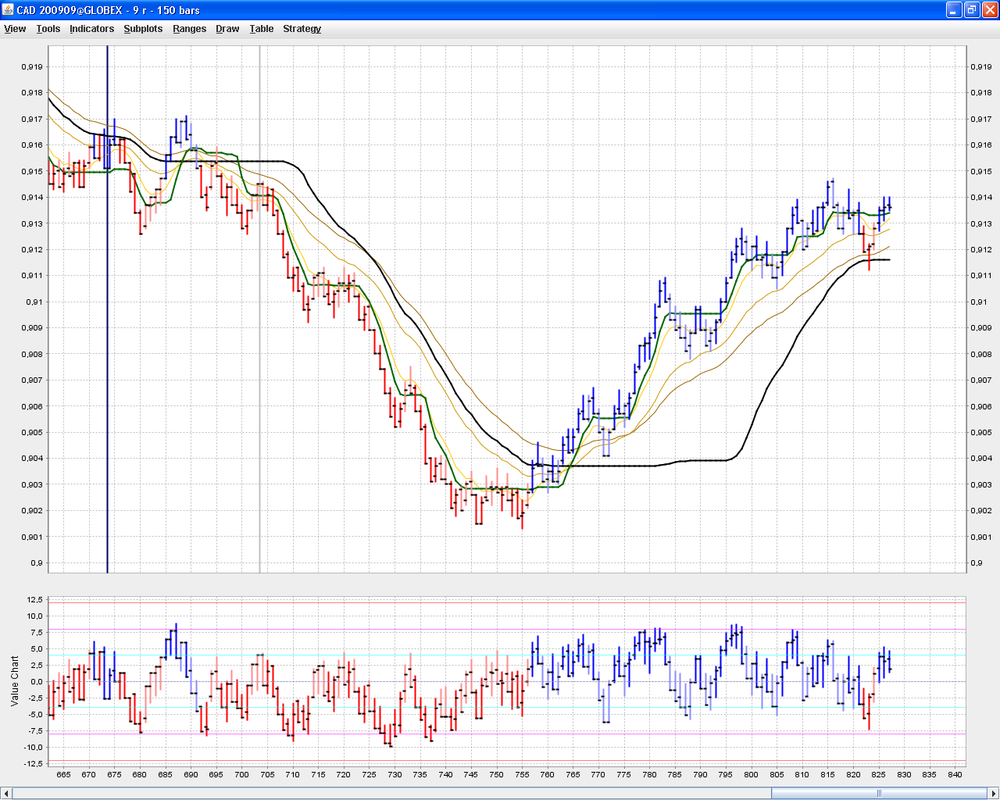
During this weekend,
I have deleted the CCI again, the Linear Regression too.
Somehow this made it more complex again.
Instead I have added some old EMA's,
searching for an explanation for the ADXVMA's, beside of step 1.
I looked at various currencies today,
with my standard ranges,
but was focused on this one.
LOL, nearly picture perfect today, but not every day,
but I think, that now I am really done with checking indicators.
This set will be it, with the same fixed parameters,
that I am already using for a while now,
only the ranges will change.
So here is the picture:
Frozen,
Hal
-
i am a little bit out of this thread, but i'd like also make a comparisonabout array in easylanguage and ninjatrader.
It would it be possible to explain how array works in c# and how to conver an array from easylanguage to c#?
For Ninjatrader/C# you might look here:
Regards,
Hal
-
Note When using the MRO function in an analysis technique, always check the result of the MRO function before using the value in another calculation or function. If the condition occurred over Length number of bars, a -1 value will be returned.
Hi, its just a guess,
but I think this check is missing
and therefore an array overflow might happen during run-time
(like Tams said within the previous post).
Regards,
Hal
-
IF CONDITION0
THEN PRINT ( DATE : 8 : 0 , CURRENTTIME : 6 : 0 , ", ABS1LOCK initialized successfully." )
ELSE PRINT ( DATE : 8 : 0 , CURRENTTIME : 6 : 0 , ", ABS1LOCK failed to initialize. Contact AbleSys Corporation." ) ;
Hi,
maybe you should contact the mentioned corporation for help.
Hal
-
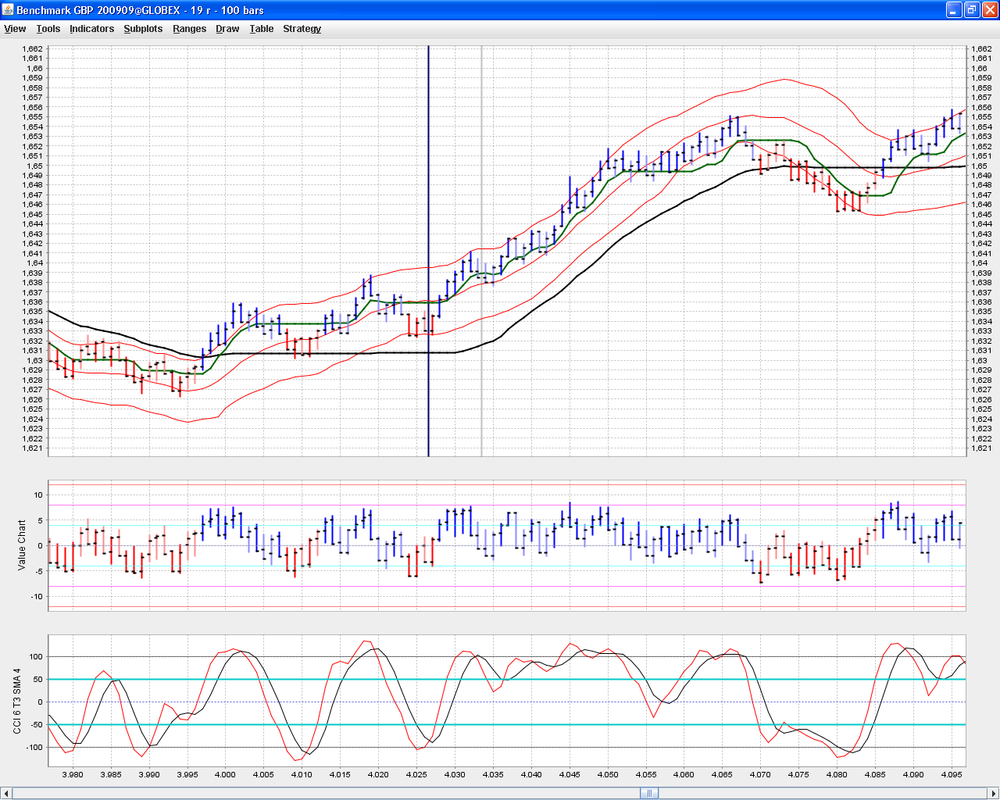
Don't stone me (Thales),
yes I might be close,
I play with my pictures,
but just old stuff.
So here is another picture,
Friday to Monday somewhere within July.
Just another picture,
just old things.
Its all there.
And time will come soon,
where my metal issues will be solved, or ...
Anyway, ...
-
Hey all, just have to say AWESOME thread!! I believe this is definetly a great edge to add to your trading arsenal. Quick question for all those mt4 users...I am experiencing considerable lag when using the market statistics mq4 indicator, does anyone else find this or have any solutions? Is it the indicator or most likely a computer issue on my end?Dryfter
Hi,
Its difficult to say, without knowing your indicator (source code)
your PC, and how many charts you have open etc...
Anyway, the calculations need some resources (CPU and memory).
Regards,
Hal
-
Jammy,
maybe you have just opened the door,
for getting help from others in here.
I don't know, where you can find it.
As I said, maybe others will help you,
maybe, you also look at Walters (The Chimps) threads in here,
he has also nice things (some for MT4, if I remember right).
And you have an advantage,
you are very young!
You have time!
Hal
-
dont know how to code!would it be c++?
No, not really, you don't have to care about memory allocation etc. in my view.
But maybe you start a little project, with a little team.
Just start with some examples.
But maybe someone else knows, where you could find the code.
Regards,
Hal
P.S.: And good luck!
-
Hi,
Hmmmm .....
Regards,
Hal
P.S.: Sorry, maybe you try to code them yourself, and offer them here later.
Its not that difficult, and BTW. they should be out there, or even in here.

-
hmm................................................Hmmm ....,
what?
Explain! :rofl:
Hal
P.S.: Post #3. Hmm ...
More to say?
Excuse me, I am in this mood!
-
One more,
and then I will be quiet, or help you (but I will not do your work!).
It depends on you, but ...
some people here helped you, to develop your EL indicators,
but your threads just end (sometimes just after my hopefully helpful questions,
at least they were intended as such), after you seem to have found your solution.
But isn't it about helping and sharing!
So why don't you post your final versions of your source codes (indicators) on your threads?
While I will have no advantage of that, maybe others will?
Anyway, I hope you got it!
Peace,
Hal
-
BTW, have you searched for a cross-compiler?
I believe there will be none,
and if I am wrong, I think it will be not for free.
Anyway, what I mean with translate is really old fashioned.
Read EL sources, write ShareScript sources.
Developing seems to be your day job,
it was mine too, so ...
Regards,
Hal
P.S.: Just do it! :missy:
-
some nice p/l here...........................You and all others reading ours,
are invited to post yours too (simulated or real, just mention it!).
Its free. :rofl:
Regards,
Hal
-
Chris/Kama are you experienced in JavaScript programming?
Or with an other object oriented language?
Well, I don't use ShareScript, I have just looked through the Language Reference manual.
Anyway, I develop my application in Java.
But I think, without knowing something more about your experience,
its difficult to help you.
Or in other words;
Where do you expect problems?
And why?
Regards,
Hal
-
I think, the easiest solution will be to translate your EL sources into Sharescript.
Regards,
Hal
-
BTW,
while I am sometimes confused how links are handled here on TL,
here is one:
Standard Error Bands | Tucker Report
It would be unfair in my view, to copycat his work,
and also he has more good articles (i.e. linear regression angles for example).
I found it a while ago, during my continuing process.
Regards,
Hal
-
Hi Tams,
I have rated it 5/5 now.
Its a good tool, and like it is with every tool,
the user has to learn, how to use it.
So far, the small settings are mentioned here.
I use 10 on my charts,
but sometimes I like to look at 50 or 100 too.
For me its not the center line,
I usually like to see the 2 SD bands.
I like extremes, this is why I like these bands.
Regards,
Hal
-
Here are some more questions for you:
- What is begin good for?
- What is end good for?
Hope this might help you,
Hal
P.S.: It might be helpful, if you format and comment your code,
before you post it here.
-
Could we define "profitable trader"? I keep reading about this and really don't know exactly what it means.Hi Jonbig,
maybe its best, to define it for yourself, and ...
A simple definition I would like to provide, is, that you can
trade for your living without a job, additional business and so on.
Well, the $ amount to do so, might be another story,
but this story is not mine.
Regards,
Hal
-
BTW: Why poker? Blackjack seems much to be much closer to me, in comparison.
During trading, you see no faces, just numbers.
Playing blackjack, the noise (face(s)) isn't there,
but the signal stays.
Double (?),
Hal


Is This Possible
in Coding Forum
Posted · Edited by HAL9000
Hi nab,
I am not completely sure, if I understand your problem correctly.
But as far as I understand it, the histogram should show the difference
between the red and the green line as on your posted chart.
But these two lines are still just showing the closes of data1 and data2.
So the difference is a difference in price.
The red and the green line seem to be scaled within the subplot,
based on the highest and lowest price visible.
So as time goes by, highest and lowest prices will change,
and therefore the scaling changes,
and therefore their relative distance changes,
and even their crossings might change.
So, what I think is, that your problem is within your concept.
Maybe you post a chart with lines and histogram,
and maybe best your source code too.
Otherwise, its somehow just guessing.
Regards,
Hal