
Welcome to the new Traders Laboratory! Please bear with us as we finish the migration over the next few days. If you find any issues, want to leave feedback, get in touch with us, or offer suggestions please post to the Support forum here.


analyst75
-
Content Count
656 -
Joined
-
Last visited
-
Days Won
2
Posts posted by analyst75
-
-
Infinite Regret = Infinite Opportunities
It might be difficult to see at times, especially if you’re not currently a benefactor of these — but there is no shortage of incredible, life changing opportunities in the NFT space.
Yeah it sucks if you aren’t minting projects that 100x, and are seeing everyone around you doing that. However the fact that there are projects returning such insane profits, is a very, very, very good thing. It means you are in roughly the right place, at roughly the right time.
This is a numbers game. There is a huge amount of luck involved when it comes to investing in NFTs. Anyone that says otherwise is lying. There’s also a significant element of skill, and that is what we should focus on. Improving our ability to evaluate projects, to research them, to know what is likely to succeed and what isn’t, and then placing our bets accordingly — this is the way.
Nobody can know for sure what projects will pop off. Nobody can know whether a project that has 10x’d will then go on to 100x, or whether it might crash to 0. The best we can do is make educated guesses, over and over and over again.
As time goes on, if you do this, the odds will slant in your favour. This still does not guarantee success, but it guarantees you have a better chance of success.
I’ve said this so many times before but it’s worth repeating so many more times, because I truly believe it: the only thing you need to do to thrive in this space, is to survive this space.
If you go all in and spend your entire bankroll and rent money on a couple of projects that turn to dust, not only are you out that money, but you are out the opportunity cost of not being able to take advantage of all the future opportunities. If you go busto, it’s incredibly hard to recover — not only financially but also emotionally.
This is why the #1 piece of advice I always give to newcomers to this space is to be patient. There is no shortage of opportunities and there is not going to be a shortage of opportunities, not any time soon at least. Don’t feel the need to rush in and FOMO into whatever hot project your favourite neighbourhood influencer is talking about, or what your friends are talking about. Take the time to really learn and understand this space, and the projects in it, and craft a bankroll management strategy that ensures your longevity (let alone your sanity).
Sure, if you have a steady job and a tonne of disposable income and are okay losing a few thousand dollars by minting random projects then by all means — go ahead. Many of us cut our teeth this way, but by and large, we all lost thousands of dollars in the learning process. It was basically the cost of tuition. It’s a great learning experience, but it’s not feasible for most people. As it is, transacting on the Ethereum Mainnet is prohibitively expensive for 99% of the world or something. Consider other blockchains, and consider being patient and biding your time and money before jumping in and parting with your hard earned dollarydoos.
Align your emotions with your actions, not with the outcomes
I was a professional poker player for 15 years. For the most part, for most of my career the difference between the good players and the great players was not technical skill. It was psychological skill and mental fortitude. It was the ability to not tilt, to not play poorly, to not let your emotions rule your decision making. This is not an easy thing to do.
At some point in my career I received “mental game coaching”. I learned a lot, but probably the single greatest takeaway which I still carry with me to this day is to try to align my emotions with my actions, and not the outcomes of my actions. This is because my actions are within my control, whatever happens beyond that is not.
To continue the poker analogy: the goal is not to be happy when you make money and upset when you lose money. The goal is to be happy when you play well and upset when you play poorly. The goal is to be able to lose a tonne of money but feel fantastic knowing that you made good decisions and knowing that in the long run, if you continue to make good decisions, you are likely to come out ahead. You should also be able to make a tonne of money and not feel like you’re a genius and did everything right — if you played poorly, you should perhaps be a little upset, and critical, and think about what you could do differently next time, even if you came away a big winner….
Every project that I bought into, or passed over, presents opportunities to learn from. Make money or lose money, or make ‘not as much as you could have’, or ‘lose more than you should have’, these are things that are going to happen over and over and over and over and over again. These are things that are not really in our control. The decisions we make, and our reactions to the outcomes, these are within our control.
It’s worth remembering that most people don’t talk about the dark side of this space. It might seem to be all GM, WAGMI, LOVE LOVE LOVE, MOON MOON MOON, etc — it really isn’t. We’re still largely communicating via social media, and we all know that people tend to show off their best side and hide their worst. So we end up comparing our worsts to other people’s bests, and thinking we’re doing something wrong and/or that there’s something wrong with us. We end up feeling the depths of infinite regret.
There’s nothing wrong with you, or me. Know that we all go through feeling down and out about ourselves. Know that we all make mistakes, sometimes huge ones, and sometimes we don’t learn from them, and make the same mistakes again. The goal is not to never make mistakes — that’s impossible. The goal is actually quite simple.
The goal is to be better today than you were yesterday, and to be better tomorrow still. It is utterly useless to compare yourself to anyone other than your previous self. It is utterly useless to dwell on things outside of your control. It is very hard not to, but it is useless.
Life isn’t easy, it’s not meant to be easy. The NFT space moves at warp speed and amplifies everything. Days feel like weeks, weeks like months, months like years, and a year is a decade. It can be stressful. It can take its toll. It can be all consuming. Your job is to not be consumed by it; to not fall so deep into a pit that you can’t find your way out, and if you do fall in, to ask for help. There is no shame in asking for help, or for taking a break, or for quitting.
If you find yourself in a hole, reach out to a friend. We’re largely a friendly bunch in this web3 NFT space and we all gotta support one another. Investing in NFTs is super interesting in that it’s simultaneously competitive while also being collaborative. Let’s lean into the collaborative side of things and try not to focus on the competitive side. Let’s also break any stigmas around talking about the dark side of NFTs. This is a mentally draining and demanding space, and it can really amplify any mental health difficulties a person might be going through (not to mention creating new ones). Let’s encourage open dialogue with a focus on bettering ourselves, and one another. Not to wallow in self pity (the most useless thing in the world), but to seek support and companionship, and help, and advice, and to navigate this insane space together and not alone.
So much of this space revolves around money. That’s cool. Money is fun, it’s exciting. It lets us pay off debt. It lets us put food on the table and a roof over our heads. It lets us buy fun things. It lets us partake in more experience. It opens new doors and opportunities to be able to make more money. Making money can be addictive. It’s like a game. It’s fun when number go up.
Some things are more important than money. Most things are more important than money. While the space is inevitably going to continue to revolve around money for a very long time, we should try our best to not have our personal lives also revolve around money. I know this is easy for me to say from my ivory tower, but I was not always wealthy. I am fortunate to have never been in poverty, but I have experienced most of the rest of the spectrum. Another comma, another zero, they do not grant fulfillment or true happiness.
Family, friends, health, reputation. Living a good and virtuous life, being a good person, doing good things. Leaving the world a better place than you found it. This, to me, is what true wealth means. NFTs are great, money is great, but never forget that at the end of the day
We are all stardust.
Author: Seneca_33
Source: https://learn2.trade/the-thoughts-of-a-trading-maverick
-
SILVER (XAGUSD) PRICE: BEARS MAY DEFEND $25 SUPPORT LEVEL TO CONTINUE BULLISH TREND
SILVER Weekly Price Analysis – March 10
In case the bulls defend the support level of $25 and increase their momentum, bullish trend will be restored and the resistance level at $26 may be penetrated. If the daily candle close above it, then, the price may increase further to $27 and $28 price level.
XAGUSD Market
Key Levels:
Resistance levels: $26, $27, $28
Support levels: $25, $24, $23
XAGUSD Long-term trend: Bullish
On the long-term outlook, XAGUSD is bullish. The formation of double bottom chart pattern at the support level of $22 made the Bulls to influx the Silver market. The bulls’ momentum increase and the price increase accordingly. Former resistance levels of $23 and $24 is broken upside and the $25 price level is tested. At the moment, the white metal pulls back to retest the support level of $25 before bulls exert more pressure.
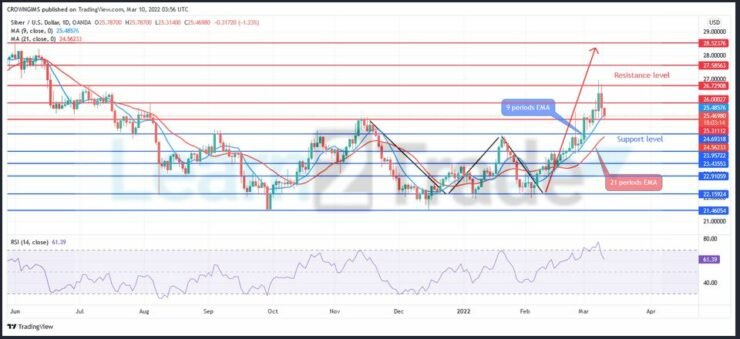
The price is trading above the 9 periods EMA and 21 periods EMA as an indication of bullish movement. In case the bulls defend the support level of $25 and increase their momentum, bullish trend will be restored and the resistance level at $26 may be penetrated. If the daily candle close above it, then, the price may increase further to $27 and $28 price level. Should the bears push the price to penetrate $25 level, the support level at $24 may be tested, and price may decrease to $23 levels. The relative strength index period 14 is at 61 levels and the signal line bending down to indicate a sell signal.
XAGUSD Medium-term Trend: Bullish
XAGUSD is bullish on the 4-hour chart. Last two weeks, pullback was experienced as the bears’ momentum pushed the price from the $25 resistance level. The bulls’ pressure could not break up the level due to weak bullish momentum. Last week, the bulls gained more pressure and the price increase to the resistance level of $26. Price retracement is ongoing at the moment. It is a normal phenomenon in a trending market.
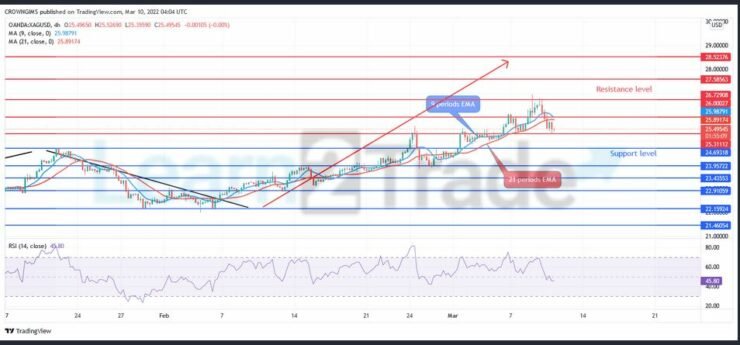
Silver price is trading below the 9 periods EMA and 21 periods EMA. The Relative Strength Index period 14 is displaying a bearish market direction at $45.
Source: https://learn2.trade -
GOLD FLUCTUATES BELOW $1,950 RESISTANCE AS IT TARGETS THE $2,020 HIGH
Key Resistance Levels: $1,900, $1,950, $2000
Key Support Levels: $1,750, $1, 700,$1,650
Gold (XAUUSD) Long-term Trend: Bullish
Gold (XAUUSD) is in an uptrend as it targets the $2,020 high. The bulls have also broken above the resistance at $1,870. The market has reached a high of $1,950. Presently, Gold is fluctuating below the recent high. On February 24 uptrend, a retraced candle body tested the 78.6% Fibonacci retracement level. The retracement indicates that Gold will rise but reverse at level 1.272 Fibonacci extension or $2,020.72.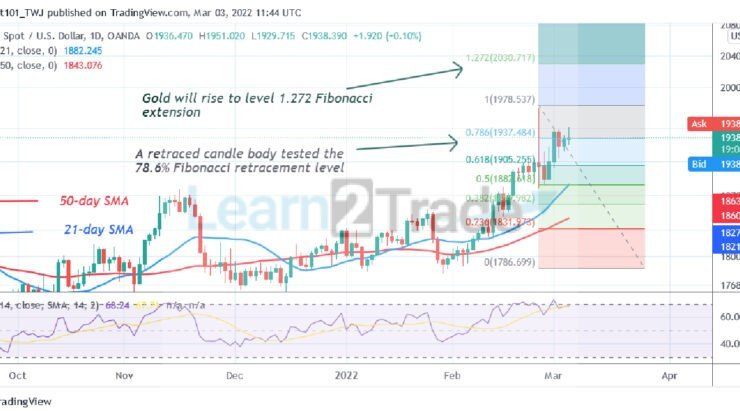 XAUUSD – Daily Chart
Daily Chart Indicators Reading:
Gold is at level 69 of the Relative Strength Index for period 14. The gold price has reached the overbought region of the market. There is a long candlestick tail pointing towards the resistance zone. This indicates that the recent high has strong selling pressure. Therefore further upward movement of prices is doubtful. The 21-day SMA and the 50-day SMA are sloping upward indicating the uptrend.
Gold (XAUUSD) Medium-term bias: Bearish
On the 4-hour chart, the Gold price is in an uptrend. On February 24, the Gold price rebounded to reach the high $1,950 but was repelled immediately. The price fell above the moving averages as the market continues its upward move.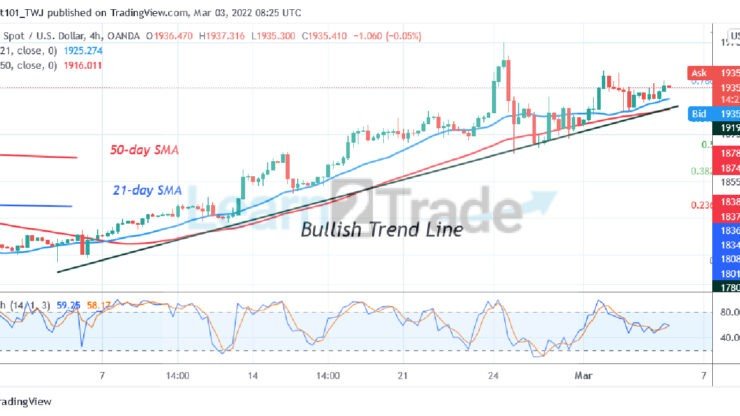 XAUUSD – 4 Hour Chart
4-hour Chart Indicators Reading
XAUUSD is above the 40% range of the daily stochastic. A bullish trend line is drawn showing the support levels of prices. The 21-day SMA and the 50-day SMA are sloping upward indicating the uptrend.
General Outlook for Gold (XAUUSD)
Gold’s (XAUUSD) price is in an uptrend as it it targets the $2,020 high. The market has reached the overbought region. Sellers will emerge in the overbought region push prices down.
Source: https://learn2.trade
-
Sadukey indicator... That is really strange.
Profits from games of knowledge: https://www.predictmag.com/ -
GBP/USD FACES REJECTION AT LEVEL 1.3642, MAY FURTHER DECLINE TO LEVEL 1.2914
Key Resistance Levels: 1.4200, 1.4400, 1.4600
Key Support Levels: 1.3400, 1.3200, 1.3000
GBP/USD Price Long-term Trend: Bearish
GBP/USD is in a downtrend as it may further decline to level 1.2914. On the weekly chart, the currency pair has been fluctuating between levels 1.3160 and 1.3800 since October 25, 2021. The downtrend may resume as price breaks below the moving averages. Meanwhile, on October 25 downtrend, a retraced candle body tested the 61.8% Fibonacci retracement level. The retracement indicates that the Pound will fall to level 1.618 Fibonacci extension or 1.2914.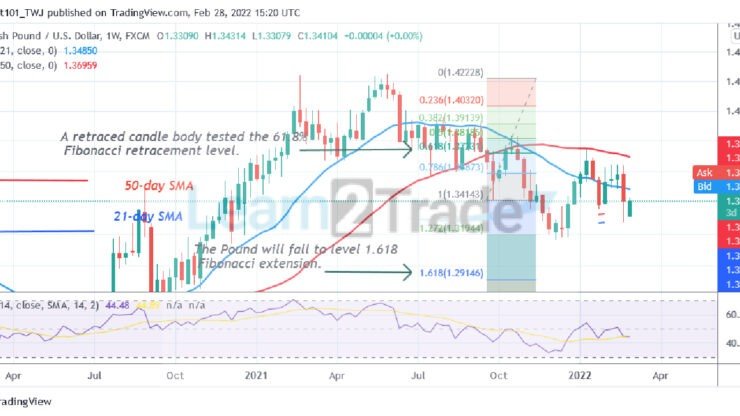 GBP/USD – Weekly Chart
Weekly Chart Indicators Reading:
The Pound is at level 44 of the Relative Strength Index for period 14. The Pound is in the downtrend zone and below the centerline 50. The pair is capable of a further downward move. The 21-day line and 50-day line moving averages are sloping downward indicating the downtrend.
GBP/USD Medium-term Trend: Bearish
On the daily chart, the Pound is below the moving averages. It has fallen to the low of level 1.3300. The pound will further decline if it breaks below level 1.3300. Meanwhile, on January 27 downtrend; a retraced candle body tested the 50% Fibonacci retracement level. The retracement suggests that the Pound will fall to level 2.0 Fibonacci extension or 1.2985.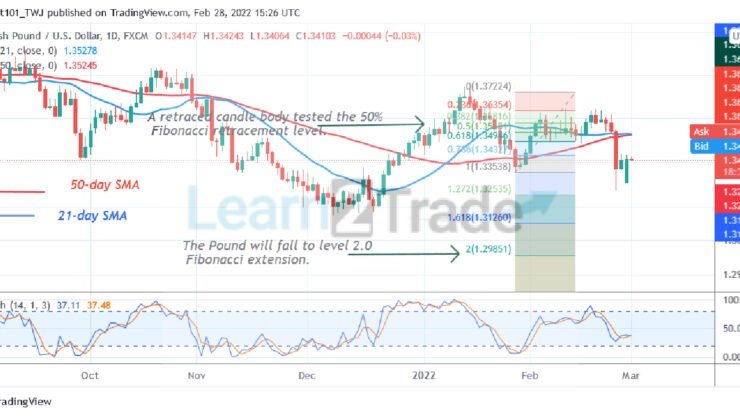 GBP/USD – Daily Chart
Daily Chart Indicators Reading
The Pound is above the 30% range of the daily stochastic. It indicates that the market is in a bullish momentum. The 21-day and 50-day SMAs are sloping horizontally indicating the sideways move.
General Outlook for GBP/USD
GBP/USD is in a downward move but may further decline to level 1.2914. The Pound will fall as long as it is in the bearish trend zone. Today, GBP/USD is facing resistance at a level 1.3400 high. The pair will fall and revisit the previous low at level 1.3300.
Source: https://learn2.trade -
EURUSD PRICE: TRIPLE BOTTOM CHART PATTERN AT $1.11 SUPPORT LEVEL, BULLISH REVERSAL ENVISAGED
EURUSD Price Analysis – February 28
In case the Bears are able to push the price below the support level of $1.11, then, support level of $1.10 and $1.09 may be tested. Should the just mentioned level is defend by the bulls, the price may continue its bullish trend towards $1.13, $1.14 and $1.16 levels.
EUR/USD Market
Key Levels:
Resistance levels: $1.13, $1.14, $1.16
Support levels: $1.11, $1.10, $1.09
EURUSD Long-term Trend: Bearish
On the long term outlook, EURUSD is bearish. The price action of EURUSD on the daily chart formed a double bottom chart pattern last week. The price reached the support level of $1.11 on November 24, it pulled back and test resistance level of $1.14. The price tested the support level of $1.11 second time on January 28. Today, the price is testing the support level of $1.11 as the third time. Price may bounce up at the just mentioned support level.
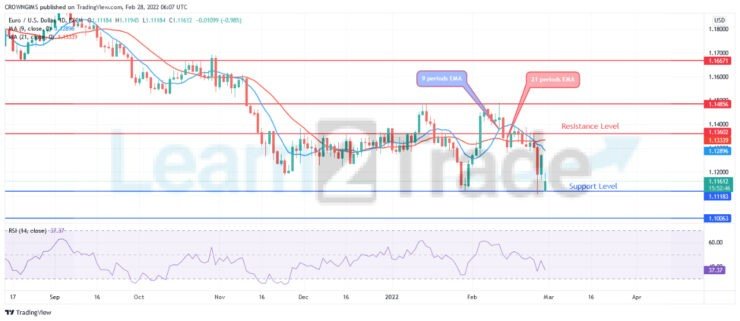
EURUSD has penetrated the two EMA downside, the price is trading below the 21 periods EMA and 9 periods EMA heading towards the previous low of $1.11. In case the Bears are able to push the price below the support level of $1.11, then, support level of $1.10 and $1.09 may be tested. Should the just mentioned level is defend by the bulls, the price may continue its bullish trend towards $1.13, $1.14 and $1.16 levels. However, the Relative Strength index period 14 is at 37 levels pointing down to indicate further price reduction.
EURUSD medium-term Trend: Bearish
EURUSD currency pair remains under the bearish control. The price increase to test the resistance level of $1.14 on February 04. The just mentioned level hold the price and it pulled back to retest the previous low at $1.11. A bullish pin bar formed and the price increased towards the dynamic resistance level. Today, the price experience a gap and it falls to test $1.11 support level third time.
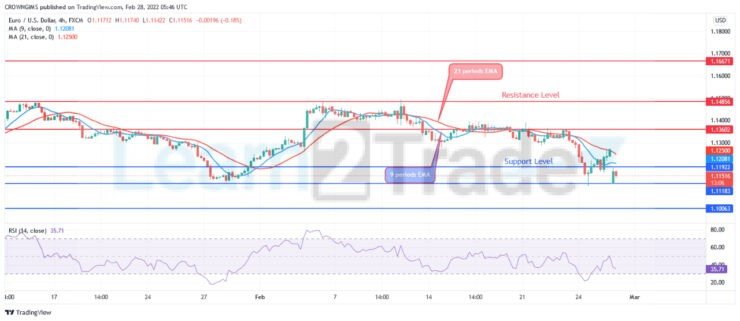
The Relative Strength Index period 14 is at 33 levels with the signal lines pointing up to indicate a buy signal.
Source: https://learn2.trade
-
BITCOIN SLUMPS BELOW $35,000 AMID WORSENING GLOBAL GEOPOLITICAL TENSIONS
Bitcoin (BTC) suffered another wave of sell-off in the Asian session on Thursday, as it fell to the $34,337 low. The rest of the cryptocurrency industry suffered the same fate, as the total market capitalization fell to the $1.5 trillion mark again.
Many analysts argued that the $35,000 level was a critical level for the benchmark cryptocurrency and that a sustained breach below this level could spur additional sell-offs. That said, speculation over the next support level and whether a near-term recovery was possible flooded the crypto space on Thursday.
Notably, the refreshed bearish momentum came due to the risk flight by investors across the financial markets after Russian forces invaded Ukraine on Thursday after Russian President Vladimir Putin said that the country would carry out a “special” military operation in Ukraine and called for Kyiv to surrender.
The broadcast triggered a widespread crash across the equities and crypto market this morning, highlighting the tight correlation between both markets.
Meanwhile, stablecoins recorded the highest overnight trading volume amid the frenzied flight to safe-haven assets. Tether (USDT) recorded a 24-hour trading volume surge of over $50 billion, while Binance USD (BUSD) and USD Coin (USDC) trading volumes spiked by about $8 billion collectively.
With reports of bombing and aggressive military operations in Ukraine, investors remain on edge over a possible retaliation from western powers. Already, the US has imposed some sanctions against Russia and has promised to impose even stricter sanctions. Also, the EU is set to impose “the harshest sanctions ever” on Russia, according to the EU foreign policy chief.
Key Bitcoin Levels to Watch — February 24
As mentioned earlier, BTC continues to suffer intense bearish pressure amid the prevailing risk-off mood in the market, as the benchmark cryptocurrency inches closer to its 2022 low of $33,150.
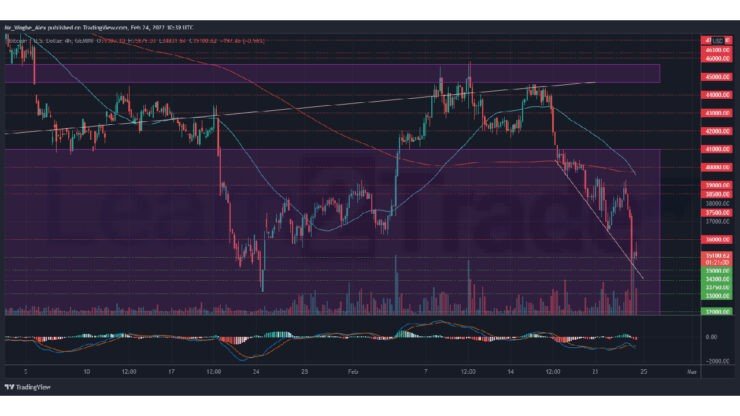 BTCUSD – 4-Hour Chart on Gemini. Source: TradingView
Notably, we can see the completion of a bearish golden cross pattern on the 4-hour chart, indicating that the bearish trend could persist longer. That said, I expect a sighting of the $33,000 low this week as the market fall to bearish forces.
Meanwhile, my resistance levels are at $36,000, $37,500, and $38,500, and my key support levels are at $36,320, $36,000, and $35,000.
Total Market Capitalization: $1.57 trillion
Bitcoin Market Capitalization: $666.9 billion
Bitcoin Dominance: 42.4%
Market Rank: #1
Source: https://learn2.trade -
ETHEREUM REACHES AN OVERBOUGHT REGION, FACES REJECTION TWICE AT $2,700 HIGH
Ethereum makes an upward correction to the high of $2,756
ETH/USD reaches an overbought region of the market
Ethereum ETH) Current Statistics
The current price: $2,647.01
Market Capitalization: $316,852,179,584
Trading Volume: $13,281,411,345
Major supply zones: $4,000, $4,500, $5,000
Major demand zones: $3,500, $3,000, $2,500
Ethereum (ETH) Price Analysis February23, 2022
Ethereum’s (ETH) price is now in a downtrend as it faces rejection twice at $2,700 high. Ether price fell to the low of $2,563 as bulls bought the dips. The largest altcoin is making an upward correction but it is facing resistance at the $2,756 high. If Ether turns from the recent high and breaks below the $2,500 support, the altcoin will decline to the previous low at $2,300 support. Since January 22, ETH/USD has been consolidating above the $2,300 support.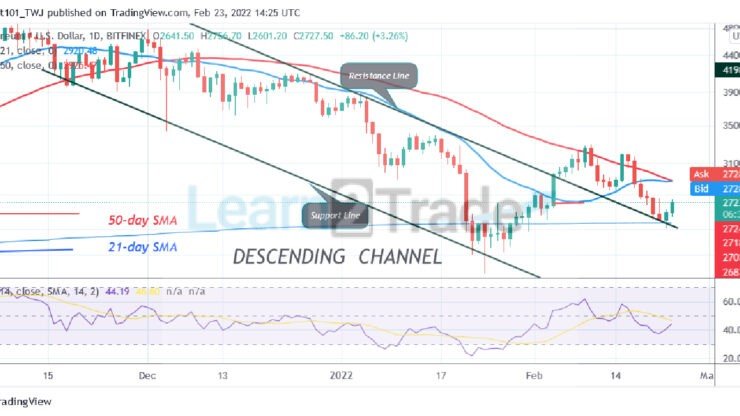 ETH/USD – Daily Chart
ETH Technical Indicators Reading
Ether is at level 43 of the Relative Strength Index for period 14. The market has fallen to the downtrend zone and below the centerline 50. This implies that the altcoin is capable of a further downward move. Ether’s price bars are below the moving averages which give the impression of a further downward move. Ether is above the 80% range of the daily stochastic. The market is in the overbought region. As Ether faces rejection, the altcoin may likely decline.
Conclusion
On the 4-hour chart, the altcoin is in an upward move but faces rejection twice at $2,700 high. The uptrend reached an overbought region of the market. Meanwhile, on February 20 downtrend; a retraced candle body tested the 78.6% Fibonacci retracement level. the Retracement indicates that Ether will fall to level 1.272 Fibonacci extension or $2,400.42.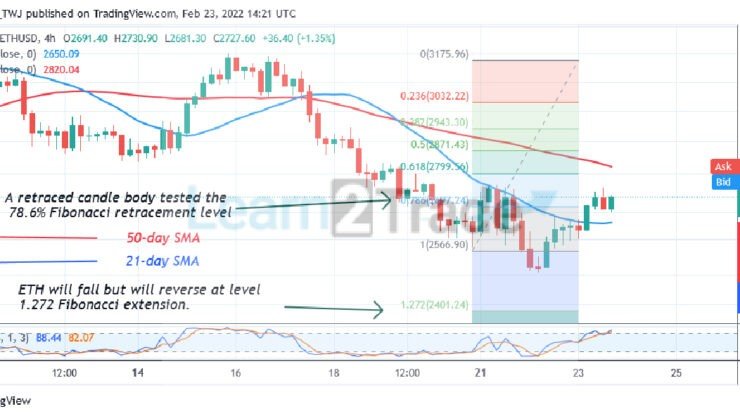 ETH/USD – 4 Hour Chart
Source: https://learn2.trade
-
Technical analysis is very important for trading, but many people don’t understand what it is, nor do they know how to apply it to their own trading. The truth is, when applied correctly and objectively, technical analysis works.
So what is technical analysis? It is a trading discipline employed to evaluate investments and identify trading opportunities by analysing statistical trends gathered from trading activity, such as price movement and volume. Unlike fundamental analysts, who attempt to evaluate a security’s intrinsic value, technical analysts focus on patterns of price movements, trading signals and various other analytical charting tools to evaluate a security’s strength or weakness.
Teach Yourself Technical Analysis explains some of the common technical indicators found on charts, and how to use them in the popular Meta Trader platform. The indicators help in timing entries and exits in the market, as well as confirming and anticipating market biases. The book reveals the parameters of the indicators, applies them to charts, and shows you how each of them can be used to make trading decisions.
Now available almost free of charge!
It covers 30 different indicators, including the Accelerator Oscillator, Bollinger Bands, the DeMarker, Momentum, Moving Averages, Ichimoku Kinko Hyo and Stochastic Oscillator.With the help of this book you will be able to apply technical analysis to your own speculation and investments, which should boost your success rate and give you satisfactory results.
The contents of this book were originally published in TRADERS’ and have been reproduced by their kind permission.
Get it here almost free of charge: https://www.advfnbooks.com/books/techanalysis/index.html
-
The internet has created a demand for online gambling, with companies offering easily accessible online wagering. So, it’s hardly surprising these websites are fast-growing and highly profitable.
Lucky Block envisions a worldwide lottery with players using Blockchain Protocols, operating on the binance smart chain. We believe the lottery should not be bound geographically or tied to local financial systems.
Instead, our focus is to develop further transparency and fairness in gaming, creating a lottery where every player has better win odds while providing a solid investment strategy for token holders while contributing to the community.More info here: https://luckyblock.com/
-
My Initial Interest
When I first heard about Bitcoin in 2015, I thought it was a joke. I didn’t care much about it, although I knew brokers and exchanges that were dealing in BTC then.
I created a Bitcoin wallet and once or twice received payment in BTC… But apart from that, I didn’t do anything about cryptos, except watching news about it, like Mt. Gox crash, maniacal movements on BTUSD, and prophecies of doom.
In a nutshell, I thought Bitcoin would eventually go the way of e-Gold, e-Bullion, Liberty Reserve, etc. But I was dead wrong! The technology behind Bitcoin is different and the coin is a totally different breed.
In 2017, I witnessed huge and unprecedented gains in cryptos…. I also connected to major crypto news websites and projects, and the truth dawned on me. This is an investment of a lifetime, the biggest asymmetrical bet in the history of the world. My First Crypto Investment Attempt
In early 2018, I decided to delve into the world of cryptos, although cautiously. My strategy then, was to have a single coin on a single exchange or cold wallet. I didn’t want to put all my eggs in a single basket. If one wallet or exchange went kaput, others would still survive.
I selected 4 coins which I thought would make good profits. At almost $20,000, Bitcoin seemed expensive to me. Therefore I chose:
Ethereum (ETH): It was around $1000 then and cheaper than Bitcoin and I thought it had good potential. I bought it on Blockchain.
Zcash (ZEC): It was around $500 then and I thought it would be another Bitcoin because of its privacy features and because its maximum supply is capped at 21 million coins. I bought it on Trezor.
ATB Coin (ATB): The coin was around $0.99 then. It was featured on many local exchangers’ websites and there was a lot of hype surrounding it. It was a household name then. I bought it on the ATB mobile wallet and stored it there.
Ripple (XRP): I bought that on GateHub. Many cryptos experts believed XRP would be hugely successful in the future. XRP was around $0.99 when I bought it in 2018.
Out of these 4 coins, only ETH is has proven to be successful so far. ZEC went as high as over $700 and later plummeted to $128. ATB became a crashing failure, and the price is currently at $0.003. The chances of ATB getting back to breakeven are very slim indeed. This fact is also true of ZEC and there is no major gain or major loss on XRP.
Basically, I lost money on XRP, ATB, and ZEC. I was only fortunate enough to recover all the investment funds from ETH alone.
In 2018, I had very limited knowledge and I was a neophyte as far as crypto investment was concerned.
My Second Crypto Investment Attempt
In 2020, I created wallets on Myetherwallet (MEW), Binance, and Bittrex. I invested in some altcoins and ERC-20 tokens.
I invested in:
EOS (EOS)
NEO (NEO)
Tron (TRX)
Stellar (XLM)
Cardano (ADA)
Binance Coin (BNB)
Skycoin (SKY)
IOTA (MIOTA)
Zcoin, now Firo (FIRO)
I had a strong belief that MIOTA, particularly, as the 3rd generation of cryptocurrencies, would be successful. I thought it was the future. Nonetheless, I made some money on coins like EOS and NEO. I lost money on MIOTA and TRX, but I made huge profits on ADA and BNB. My Third Crypto Investment Attempt
The last Bitcoin halving took place in May 2020 and the next one is due in 2024. After the last halving, cryptos skyrocketed and personally, I know a lot of local investors who became seriously rich. So in early 2021, I decided to invest in more coins.
I bought:
Holo (HOT)
Wanchain (WAN)
0x (ZRX)
VeChain (VET)
NEM (XEM)
Dogecoin (DOGE)
Shiba Inu (SHIB)
I thought of going for coins that were cheap and at the same time, had huge potential, I avoided expensive coins like yearn.finance (YFI).
You see, the coins I thought would make me money didn’t perform, and the coins I didn’t have much hope for, eventually made me money. A coin may have good fundamentals and metrics now, but that doesn’t guarantee what would happen to it in the future.
To me, SHIB and DOGE don’t have much future potential, I would soon cash out of them and forget about them. I simply invested in them for fun. In 2021, XEM proved to be my worst investment with very poor results, while HOT has made me huge gains.
In Cryptos, Timing Matters
When trading and investing in cryptos, indices, stocks, Forex, and commodities. Timing matters a lot. I lacked knowledge about timing when I first decided to invest in cryptos in 2018. I entered the markets when they were extremely overbought and a long and protracted crypto winter was about to begin… I lost my socks. I was eventually rescued by ETH, though I had to outwait the bearishness on ETH itself, which lasted for many months.
Even if a coin currently looks expensive, investing in it can still bring profits as long as you can wait for years. On the other hand, such an expensive coin would even be a better bargain if you buy it after it becomes cheaper, owing to a crash.
It is far better to buy coins when they have found strong supports, following massive bearishness in the markets. Recently, XRP crashed seriously in January 2022, and then began to rally, bringing good gains for those who went long on XRPUSD.
Really, XRPUSD is a very good instrument when it comes to picking tops and bottoms in the market as a swing trader… XRPUSD is not good for investment.
Yes, timing is everything… It is no longer a secret that one of the best periods to invest in cryptos is the month in which BTC halving takes place. You won’t believe the results you will get if you do that. The Next Coins on My Radar
Having said all of the above, I am watching the coins below. I have carried out extensive research on them and I am convinced that, though there are no certainties in the market, the coins below would bring extremely huge returns within the next few to several years, when you invest with great timing and good entries. Remember I said one of the best timing periods is the month of a BTC halving.
These are the next coins on my radar. I am seriously considering them. They have great potential, enviable metrics, and cool fundamentals. They solve unique problems, bring novel features and great innovations to the world of blockchain. I won’t go into details about the particulars and facts for each coin, but I would mention them.
The coins are:
Axie Infinity (AXS)
Enjin Coin (ENT)
Internet Computer (ICP)
Polkadot (DOT)
Theta Network (THETA)
Solana (SOL)
Polygon (MATIC)
Filecoin (FILE)
TEZOS (XTZ)
Terra (LUNA)
Helium (HNT)
Pancakeswap (CAKE)
And Lucky Block (LBlock)
I won’t reveal more about my timing methods and investment strategies here, for I have gained so much knowledge in the past few years. However, I believe, with the proper timing (proper timing only), a total of $1,000 invested in all the coins above would bring at least $10,000 returns in less than 18 months.
Please note this: this is my personal opinion, and what I intend to do. It is not what I ask you to do. You’re responsible for your own investment decisions.
Source: https://learn2.trade -
SILVER (XAGUSD) PRICE: BULLISH REVERSAL AT $22 LEVEL, TARGETING $23 RESISTANCE LEVEL
SILVER Price Analysis – February 10
The price may increase to the resistance level of $23 and if it does not hold, it may incline to $24 and $25 levels. When the bears interrupt the bulls, price may decrease towards the support level of $22, $21 and $19.
XAGUSD Market
Key Levels:
Resistance levels: $23, $24, $25
Support levels: $22, $21, $19
XAGUSD Long-term trend: Bullish
On the daily chart, XAGUSD (Silver) is bullish. There is a formation of double bottom chart pattern at $22 support level. This is a bullish chart pattern which indicate that bulls are increasing their momentum in the Uniswap market. The price is increasing towards the resistance level of $23 at the moment. That means the buyers are in control of the Silver market, further increase envisaged.
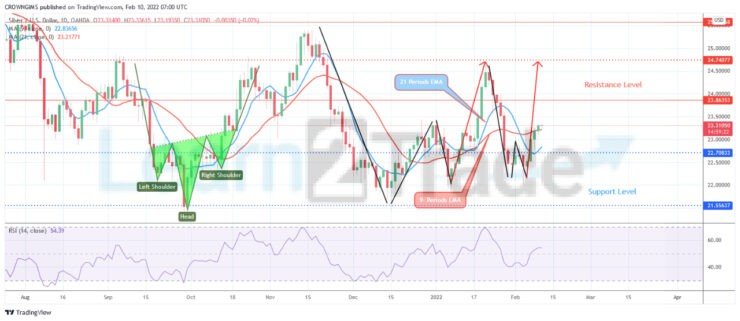
There is an increase in bullish momentum as the Silver price is trading above the 9 periods EMA and the 21 periods EMA. The relative strength index period 14 is above 50 levels with the signal lines pointing up displaying bullish direction. The price may increase to the resistance level of $23 and if it does not hold, it may incline to $24 and $25 levels. When the bears interrupt the bulls, price may decrease towards the support level of $22, $21 and $19.
XAGUSD Medium-term Trend: Bullish
XAGUSD is bullish on the daily chart. The price was bearish last week as the price action was under the formation of “W” chart pattern. The bulls have gained more momentum and the price is increasing accordingly. The price is heading towards the resistance level of $23 at the moment.
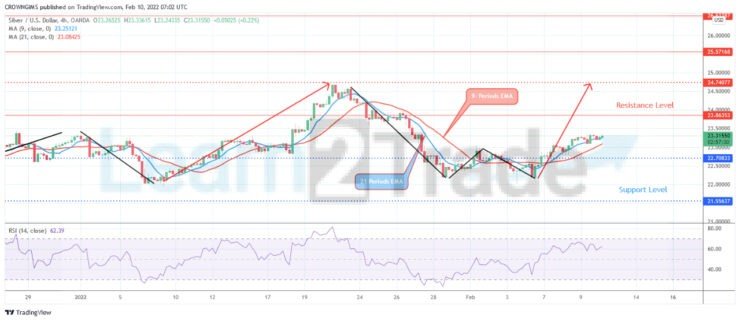
The Silver price is trading above the 9 periods EMA and 21 periods EMA. The relative strength index period 14 is above 60 levels with the signal lines pointing up to indicate buy signal.
Source: https://learn2.trade -
Some charting services and extensive research will do.
Profits from games of knowledge: https://www.predictmag.com/
-
LUCKY BLOCK MARKET FORECAST: LBLOCK/USD IS SET FOR AN UPWARD BREAKOUT
Lucky Block Market Forecast – February 3
The Lucky Block market forecast points towards a breakout to the upside after the market conforms to a triangle pattern.
LBLOCK/USD Long-term Trend: Bullish (Daily Chart)Key Levels:
Resistance Levels: $0.0011500, $0.001370
Support Levels: $0.0009490, $0.0007300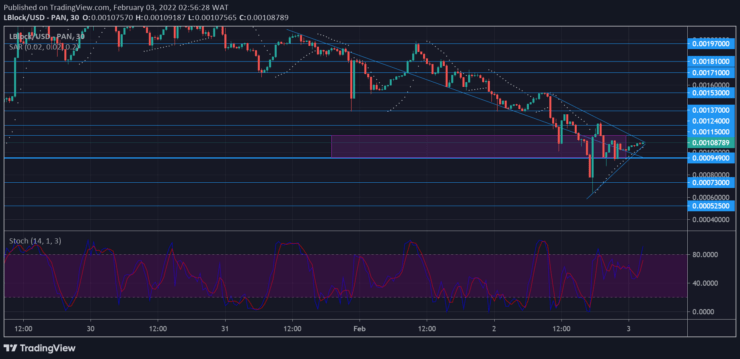 LBLOCK/USD bulls are leveraging on a strong and significant price level to halt the activity of the bears. Furthermore, the price is expected to rise further in favor of buyers as it follows a symmetrical triangle pattern. Hence, the market can be seen making consistent lower highs and higher lows as it tapers through the triangle pattern. From yesterday into today, the market has become quiet as it waits for market forces to push it in an upward direction.
Lucky Block Price Prediction: LBlock Market AnticipationThe market has been in decline since hitting a strong resistance level at $0.001970. The price is seen gyrating downward above the downtrend line. The fall in the price of Lucky Block is an opportunity for buyers as they set themselves up in an array to gazump the market at a lower price.
The $0.0009490 key level is the reversal point at which the bulls chose to enter the market. Bears were unrelenting nevertheless, and they dragged the market below the strong support level. However, the price is now recoiling into a triangle pattern as it prepares for a push-up.
LBLOCK has climbed back above the strong support at $0.0009490 as it tapers through the symmetrical triangle. The Parabolic SAR (Stop and Reverse) already infers a change of direction upwards with multiple dots below the daily candles. The Stochastic, meanwhile, has risen to midlevel, from where it has crossed upward to the overbought region. A slight pullback may precede a market breakout.
LBLOCK/USD Medium-Term Trend: Bearish (5-minute chart)The 5-minute chart helps us see the silence in the market as bulls get ready to swoop into the market. LBLOCK/USD is currently ranging between $0.001150 as resistance and $0.0009490 as support, and the price is set to take a definite direction.
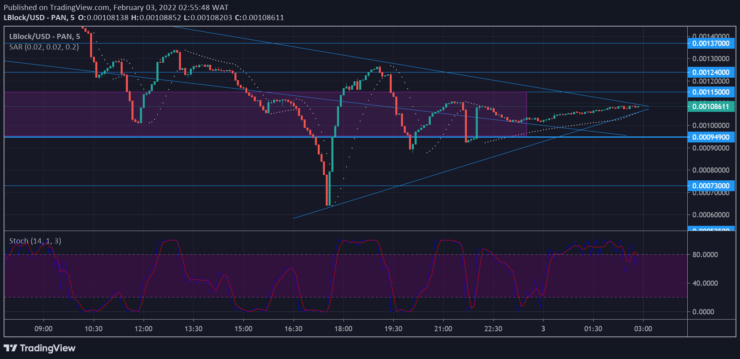 Like the daily chart, the Parabolic SAR has multiple dots below the 5-minute candles to signal a switch in an upward direction. The Stochastic on the 5-minute chart is currently hovering around the overbought region. The price is likely to touch down at $0.0009490 before breaking out upward towards $0.001370.
Source: https://learn2.trade -
Lucky Block Awaits FTX Listing, On Track for 250,000 Holders in Month
Lucky Block, the new People’s Lottery platform set to launch on 21 March, is seeing its price consolidate in the $0.00190 to $0.00210 range, with more exchange listings news imminent.
The globally focused blockchain-based lottery platform that pays a dividend to all token holders and will be donating 10% of jackpots to charity, is awaiting its first listing on a centralised exchange, after launching on the PancakeSwap DEX on 26 January.
 Pictured: Love Island 2019 contestant Nabila Badda attends an exclusive drinks reception hosted by cryptocurrency lottery Lucky Block to celebrate 2022 with a donation to the British Red Cross at IT London on January 7, 2022 in London, England. (Photo by David M. Benett/Dave Benett)
First up is expected to be the fast-growing FTX exchange, followed by Crypto.com. Crypto.com is already tracking the price of LBLOCK. To keep up with the news on that, interested parties are urged to join the official Telegram group, where pinned messages keep the community informed.
In the short time since its PancakeSwap listing, Lucky Block has soared to a market cap of $200 million on a fully diluted basis of total supply of 100 billion tokens, with early investors seeing returns north of 1,000%.
Lucky Block could have 250,000 token holders in 30 days at current rate of progress
Currently, buyers are running into strong overhead resistance in the $0.00220s area, but will be encouraged by support around the $0.00190 level, although it did slip below that level earlier today.
The number of investors (wallet holders) has climbed above 16,925 after five days of listing on just one exchange – PancakeSwap. Wallet holder numbers have doubled since the end of the presale when it stood at 8,611.
If the current rate is maintained – that’s to say doubling every 5 days, then the platform could have 250,000 active addresses in 30 days’ time.
LuckyBlock (LBlock/WBNB) Price: $ 0.002048 (24h +0.08%) Volume 24 hour: $2,097,045.80 Holders: 16,925 Transactions: 94,333 Pooled LBlock: 871,684,494.72 Pooled WBNB: 4,781.89 Liquidity: $3,570,544.40 Diluted Market CAP: $204,807,153.34 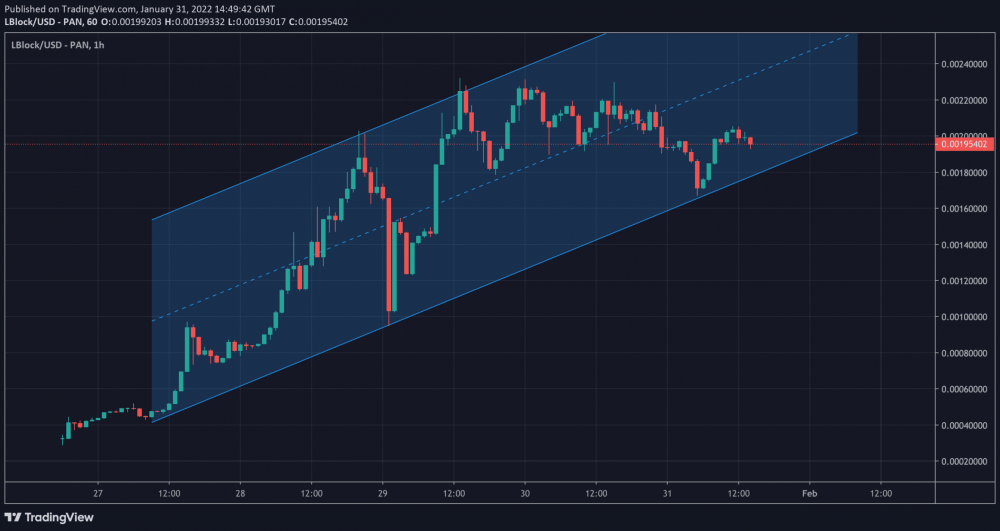 Lucky Block is in an ascending price channel with further catalysts from dev milestones and exchange listings news expected this week
Lucky Block app – development news on tap tomorrow, Tuesday 1 February
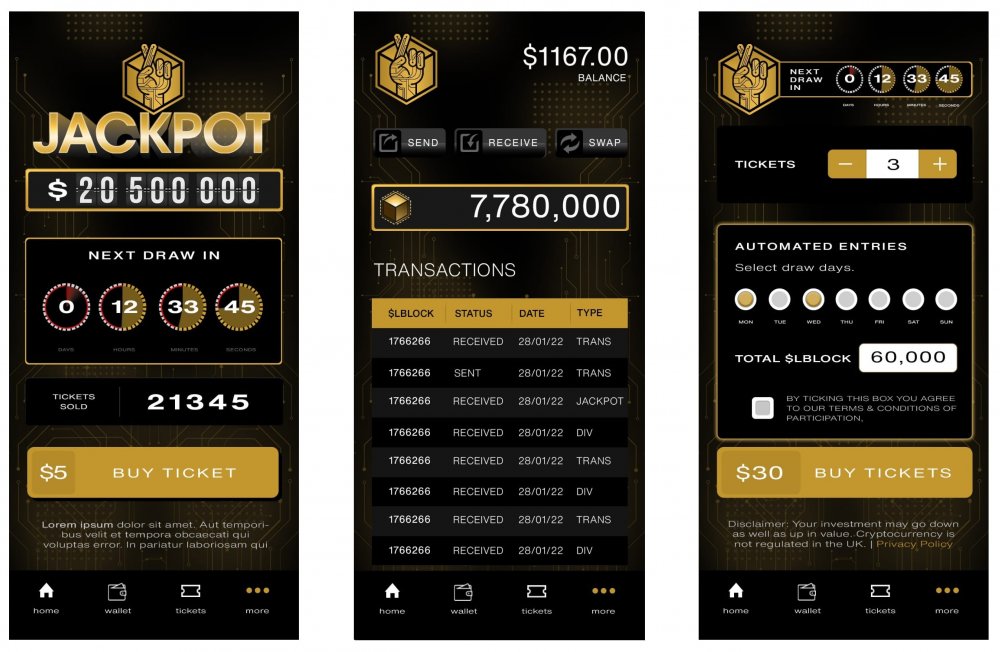
Lucky Block users access the lottery platform through the mobile app, due for release on 21 March. It is understood that users will be incentivised to download the app because it will be the primary way to play the lottery, which will include daily draws.
Token holders will connect their wallet to the app in order to play the lottery. The dividends from each jackpot will be paid instantly and be viewable and tracked on the app.
To drive adoption, 22.5% of token supply has been allocated to marketing to promote the global lottery.
According to team insiders, more news on app development is expected tomorrow. So too are details of its referral programme.
James Fennell, chief strategy officer at Lucky Block, said: “At the moment we are working hard to deliver on our vision for a global lottery open to all and owned by its players.
“Key to realising that strategy is our app launch in March. The app will make playing the lottery and tracking winnings easy, as well as being the place where token holders can see their dividend payments compound and track the passive income they are earning.
“As we continue to build out our offering, which at a later day will include gaming, NFT and metaverse products, we will work towards achieving one of our other strategic goals – advancing our mission to transform philanthropy, in part through setting up our global not-for-profit Lucky Block Foundation.”
Dividend yields to grow as number of lottery players increases
The dividend payout rises as the number of people playing the lottery grows.
Every time LBLOCK is sold a 12% transaction fee is applied, of which a third of that amount is paid into the lottery pool.
Regarding the market cap valuation of the platform, the revenue from ticket sales – tickets can only be bought with LBLOCK – will offset jackpot winners cashing out their LBLOCK. The exact details are yet to be revealed.
For a deeper dive into how the lottery platform’s innovative dividend works, the Lucky Block team has provided some illustrative examples:
Based on conservative amount of 25,000 holders by lotto launch 25 March:
50% of holders buying on average of 1 ticket per day @ $2.50 with the addition of the 4% of transactional tax added to the lottery pool from the expected $400,000 a day trading volume at the time of lottery launch.
- Daily jackpot (70% of pool) of $33,075
- Daily Charity Donation (10% of pool) of £4,725
- 11.5% Dividend PA via jackpot distribution to holders
Based on conservative amount of 25,000 holders by lotto launch 25 March:
50% of holders buying on average of 1 ticket per day @ $5 with the addition of the 4% of transactional tax added to the lottery pool from the expected $400,000 a day trading volume at the time of lottery launch.
- Daily jackpot (70% of pool) of $54,950
- Daily Charity Donation (70% of pool) of £7,850
- 19.1% Dividend PA via jackpot distribution to holders
Generic case study: Based on conservative amount of 25,000 holders by lotto launch 25 March 50% of holders buying on average of 1 ticket per day @ $5:
Alice holds $1000 LBLOCK in her wallet, which is 0.07% of LBLOCK held on the platform. She buys a $5 ticket in a lottery which has a jackpot of $54,950. Despite her 12500/1 odds, Alice doesn’t win but she get’s paid a dividend in LBLOCK of $0.52 anyway. However, Alice would have received this dividend whether she bought a ticket or not.”
If Alice held this amount of LBLOCK all year round at this rate she earns 19.5% PA. If the lottery grows, so does her return! Furthermore, if the market price of LBLOCK increases, Alice would essentially be getting free ticket entries offsetting her gains against her tickets.
The exact breakdown of the transaction fee is:
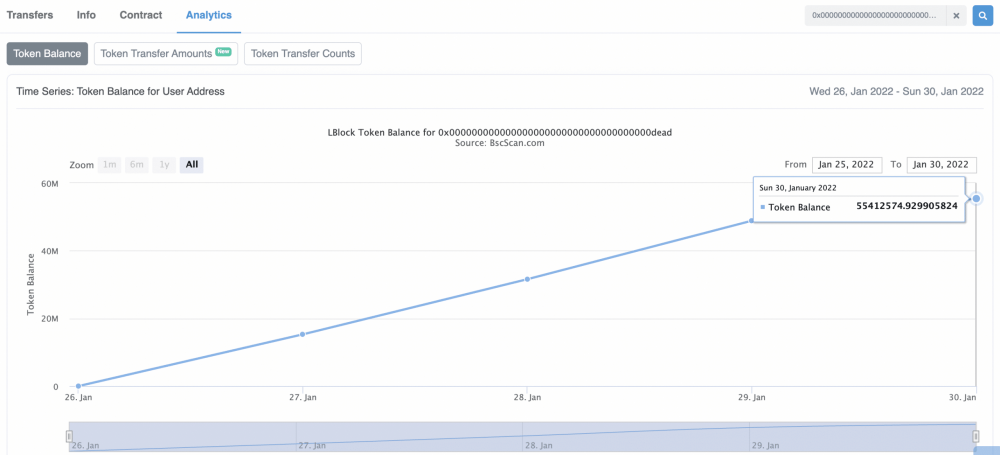
Transactional fee – 12% transactional fee on sale Lottery Pool 4% Liquidity Pools 4% NFT & Gaming Royalty Fund 3% Token Burn 1% 55.4 million tokens have been burned so far. Click here for the address at the bscscan explorer (screenshot below):
Token distribution of the total supply of 100,000,000,000 (100 billion) is as follows:
- Presale: 32,500,000,000 (32.5 billion – 32.5%)
- Strategic partners and advisors: 20,000,000,000 (20 billion – 20%)
- Marketing: 22,500,000,000 (22.5 billion – 22.5%)
- Team: 20,000,000,000 (20 billion – 20%)
- Product development: 2,500,000,000 (2.5 billion – 2.5%)
-
Locked liquidity – 1-year lock: 2,500,000,000 (2.5 billion – 2.5%)
Source: https://www.economywatch.com/news/lucky-block-awaits-ftx-listing-on-track-for-250000-holders-in-month
-
One danger of having a large social media following is that your account gets poached. It’s happened a dozen times to me, on every platform. Fake Jeffrey Tuckers have routinely popped up on Twitter and Facebook. I have to waste time getting the accounts disabled.
A particularly bad platform for fakes is Instagram. I’ve racked up quite a number of followers there, even though I rarely use it. That makes me a target. Someone can easily set up an account with my image and name, just using a slight variation, and then they can contact the people who follow me. They can block my own account so that I never know they exist.
This happened to me at some point last fall. I knew nothing about it. I rarely check in to that account, so when I did I found dozens of notes to me saying that they would like to follow up on my Bitcoin investment idea.
Ripoff!
Huh? I would never private message anyone with an investment idea. That’s completely nuts, and probably comes close to illegality. I would never do it. Utterly crazy. Why did people believe that I would? A certain degree of gullibility I suppose.
In any case, after months of exasperation with this nonsense I finally did what I should have done in the first place. I reported the fake account with proof that I am who I am and not the guy who is pretending to be me. After a week or so, they finally got rid of the fake. Good.
In the meantime, I do wonder how many people got scammed in my name. I do not know. What I find incredible is that anyone would go for it. And yet smart people do. They find someone they trust — not knowing it is a fake — and go for the promise of high earnings.
I do not know the nature of the scam, but I’m guessing that it followed the usual path. Send Bitcoins right away. They will be invested with people who need money. These investments will pay big returns. Then the company will send back my crypto with lots of new earnings.
I’m rich!
It never works. What happens is that you send your crypto to someone and they disappear. There is absolutely no legal way to get the money back. As I’ve explained repeatedly, the glory and the danger of crypto is the speed of settlement. When you move coins from your wallet to someone else’s wallet, the property is transferred. Period. You cannot get it back. In this way, crypto is very different from a trust-based system like banks and credit cards. The property moves without an intermediary (unless you are using an exchange).
Rules for Scam Avoidance
It seems more than obvious. I shouldn’t have to say it. But given the number of people who bought into this, I will say it. Never ever engage with anyone on social media concerning some crypto investment idea. It is a guaranteed scam. Even if you think you know the person. Do not answer and do not bite. Do not denounce the person. Just apply an immediate block or simply ignore it. Period. No exceptions.
That’s the first rule of avoiding scams.
There are others. I went to my old friend, a trusted source of all such matters, a man who runs TheBitcoinConsultancy, and a brilliant observer of the industry, and he offered a valuable look at some other tips for avoiding rackets. He puts this in the form of 5 solid questions to ask before getting involved.
1: Does this project have a legitimate profit model? There are plenty of ways to make money in crypto: mining, lending, holding, and trading. There are many illegitimate ways and they are rather obvious if you look carefully at them. Any legitimate Centralized Finance (CeFi) company will disclose its business model. A Decentralized Finance company will too but they are not as easy to check, and this is by design. But you should be able to verify its legitimacy with a white paper and other sources online that verify opportunities.
2: Is this project feasible and sustainable? My friend gives the example of many tokens out there that are designed for particular niches, such as buying prescriptions online or gaming. If the project is too niche, it has no possibility of scaling. It is very likely a pump and dump, just something to arouse naive interest before the coin disappears. It seems amazing to me that people are still falling for such nonsense, but that’s where we are.
3: Does this project have independent verification or third-party certification? There are very few legal ways in which crypto companies are allowed to trade your money. They must be registered if they do so, and this is an arduous process. Very few companies end up jumping through all the regulatory hoops. You can verify this with FINRA, SIPC, or the SEC. These companies are simply not allowed to advertise their services, via instant messaging or pushes on social media. No hedge fund is allowed to do that. If someone is, it is likely a scam. In addition, the crypto industry itself has its own verifications at Rugdoc.io
4: Can you independently verify this token or platform? Always check new tokens with coinmarketcap or some other services that watch crypto prices. If the token is not listed or cannot be verified, run away. There are no exceptions to this rule.
5: Check out the management structure. Any legitimate company will include the names of its officers and they should be judged according to their professional reputations. Many people in this industry have ruined their reputations by getting involved, however accidentally, in companies that are not legitimate. Their names are now mud. That sounds cruel but that’s the way it is .
My friend has looked at more than 2,000 cases of crypto scams and finds that 95% have these common problems. They offer “unrealistic returns, high-pressure tactics, sales pitches via messaging platforms, no mention of fees, and lack of reputation.” If you can avoid those problems, you will avoid most rackets in this industry.
It sounds boring, but the best and safest way to earn money in this world is not by leaping on the latest fad, much less buying some non-fungible token in the art world. The best path is to buy and hold. Nothing more to it than that. There are fancy things you can do later but avoiding rackets and scams is priority number one.
Jeffrey TuckerFor Altucher Confidential: https://altucherconfidential.com/
Profits from games of knowledge: https://www.predictmag.com/
-
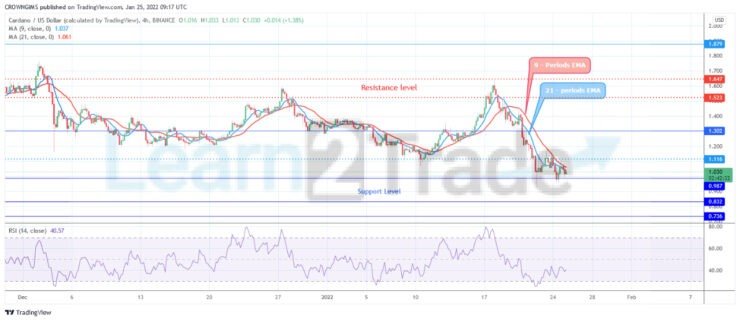
CARDANO PRICE EXPOSES TO $0.98 SUPPORT LEVEL
ADA Price Analysis – January 25
When the sellers increase their momentum to push down price below $0.98, the support level of $0.83 and $0.73 may be tested. In case the Support level of $0.98 holds, the buyers may push up the price towards $1.11, $1.30 and $1.46 levels.
ADA/USD Market
Key Levels:
Resistance levels: $1.11, $1.30, $1.46
Support levels: $0.98, $0.83, $0.73
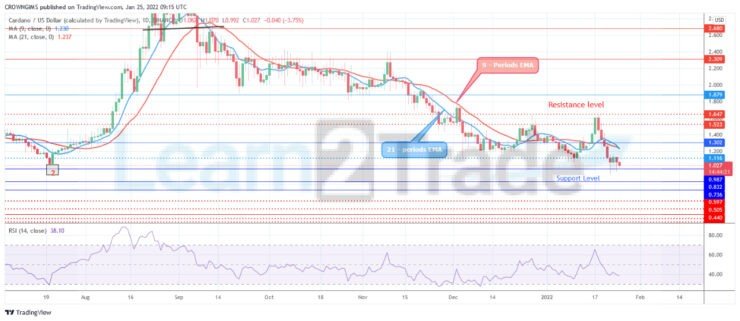
ADA/USD Long-term Trend: Bearish
Cardano is bearish on daily chart. Buyers and sellers are struggling over the crypto. The sellers are trying to overpower the buyers. Former support level of $1.30 and $1.11 has been penetrated downside by the sellers and the price exposes to $0.98 support level. There is tendency for the price to decline further if the sellers maintain their pressure.
 ADAUSD Daily chart, January 25
Cardano has crossed the two EMAs downside, currently trading below the 9 periods EMA and 21 periods EMA at distance which indicate a bearish movement. When the sellers increase their momentum to push down price below $0.98, the support level of $0.83 and $0.73 may be tested. In case the Support level of $0.98 holds, the buyers may push up the price towards $1.11, $1.30 and $1.46 levels. The relative Strength Index period 14 is at 40 levels with the signal line pointing downside which indicates sell signal.
ADA/USD Medium-term Trend: Bearish
Cardano is on the bearish movement on 4-hour chart. The bullish movement could not continue when the buyers pushed up Cardano to test the resistance level at $1.64. The bears reacted against the price increase with the formation of bearish engulfing candle. The price started decreasing and the support level of $1.30 is broken downside. Further price decrease envisaged as the price is below the two dynamic resistance levels.
 ADAUSD 4-hour chart, January 25
The price is trading below the 9 periods EMA and 21 periods EMA. The relative strength index period 14 is at 40 levels and the signal line pointing down to indicate sell signal.
Source: https://learn2.trade -
SOLANA REACHES OVERSOLD REGION AS THE ALTCOIN MAKES DEEPER CORRECTION
Solana has fallen to the low of $87
SOL/USD has reached the oversold region
Solana (SOL) Current Statistics
The current price: $90.94
Market Capitalization: $46,528,296,188
Trading Volume: $4,555,783,625
Major supply zones: $280, $300, $320
Major demand zones: $160, $140, $120
Solana (SOL) Price Analysis January 24, 2022
Solana’s (SOL) price has fallen significantly to the low of $87 as the altcoin makes deeper correction. The crypto’s price corrected upward but faces resistance at $104. If the crypto is facing resistance at $104, it implies that the selling pressure will resume to the downside. Presently, the altcoin is fluctuating between $80 and $104 price levels. The crypto will resume trending when the range-bound levels are breached. For instance, if the bears break below the $80, the market will decline to $68 low.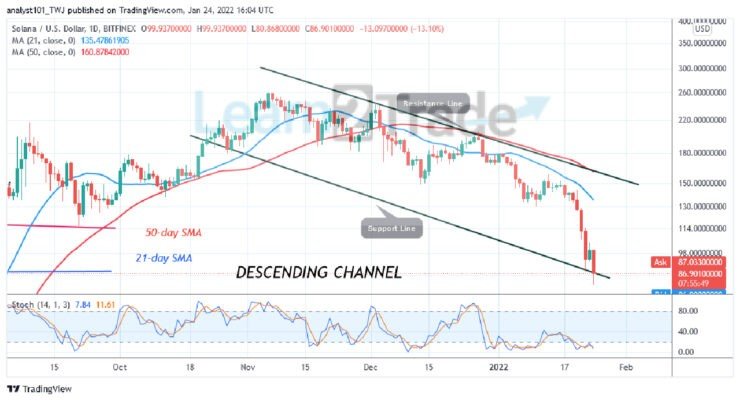 SOL/USD – Daily Chart
Solana (SOL) Technical Indicators Reading
Solana is at level 23 of the Relative Strength Index for period 14. The cryptocurrency is seriously in the oversold region. This is an indication that the current downtrend has reached bearish exhaustion. SOL/USD is below the 20% range of the daily stochastic. It indicates that the market has reached the oversold region of the market. Since December 29, the altcoin has been trading in the oversold region of the market. The 21-day SMA and 50-day SMA are sloping downward indicating the downtrend.
Conclusion
Solana is in a downward move as the altcoin makes deeper correction.. The current price action and Fibonacci tool analysis are closely related. The cryptocurrency has reached the oversold region and there is a possibility of price reversal. Meanwhile, on December 14 downtrend; a retraced candle body tested the 61.8% Fibonacci retracement level. The retracement indicates that Solana will fall to level 1.618 Fibonacci extensions or $79.34.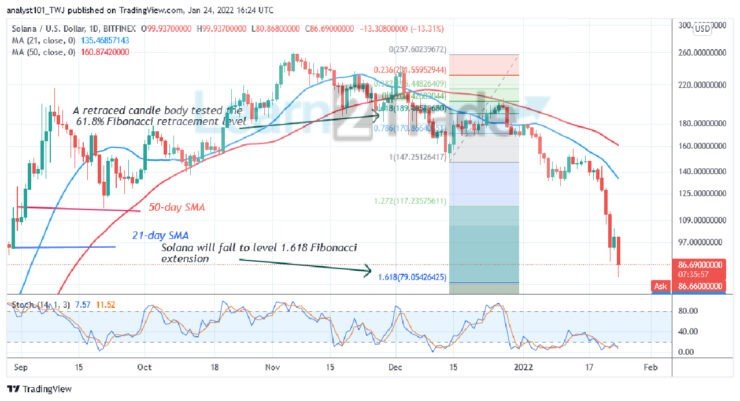 SOL/USD – Daily Chart
Source: https://learn2.trade
-
GOLD FLUCTUATES BELOW $1,830 OVERHEAD RESISTANCE, MAY SLUMP TO $1,800 LO
Key Resistance Levels: $1,900, $1,950, $2000
Key Support Levels: $1,750, $1, 700,$1,650
Gold (XAUUSD) Long-term Trend: Bullish
Gold (XAUUSD) is in a sideways move but may slump to $1,800 low. Gold is retracing as it faces rejection at the high of $1,830. However, if price breaks the resistance level, the market will rise and retest the previous high of $1,860. Meanwhile, on January 14 uptrend; a retraced candle body tested the 78.6% Fibonacci retracement level. The retracement suggests that Gold will rise but reverse at level 1.272 Fibonacci extension or $1,840.86.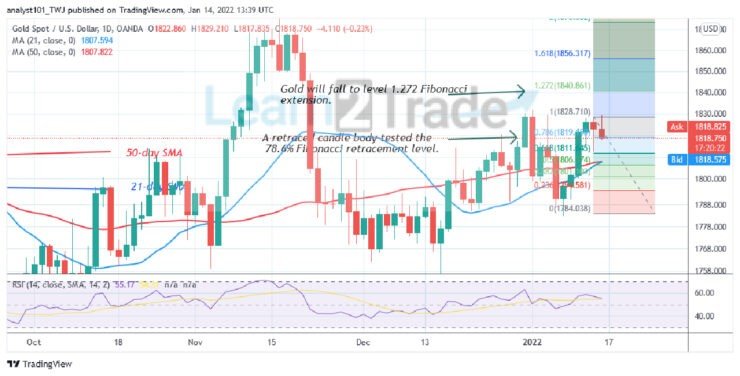 XAUUSD – Daily Chart
Daily Chart Indicators Reading:
Gold is at level 55 of the Relative Strength Index for period 14. The market has reached the uptrend zone and further upside is likely. The 21-day SMA and the 50-day SMA are sloping upward indicating an uptrend.
Gold (XAUUSD) Medium-term bias: Ranging
On the 4 hour chart, the Gold price is in a sideways trend. The gold price fluctuates below the $1,828 overhead resistance. The sideways trend has been ongoing since December 21. Each time the market retest the overhead resistance, the selling pressure will resume. The current downtrend is likely to extend to the low of $1,804 before upward.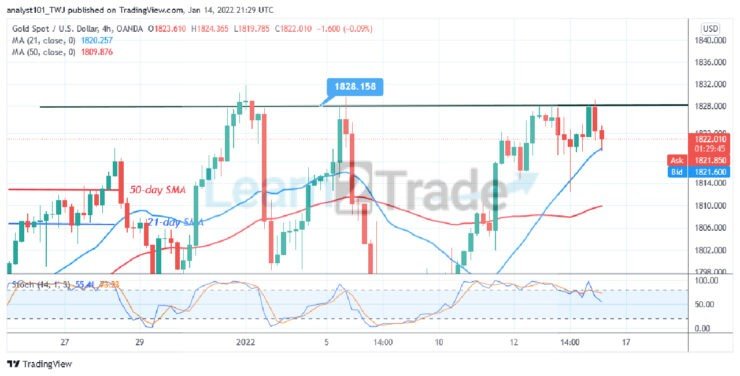 XAUUSD – 4 Hour Chart
4-hour Chart Indicators Reading
XAUUSD is below the 80% range of the daily stochastic. The market is in the bearish momentum. The 21-day SMA and the 50-day SMA are sloping upward indicating the uptrend.
General Outlook for Gold (XAUUSD)
Gold’s (XAUUSD) price is declining as it may slump to $1,800 low. The market is fluctuating below the $1,828 resistance zone. The Gold price is falling to the downside. The upward move will resume if price finds support above the $1,800.
Source: https://learn2.trade
-
USOIL REACHES AN OVERBOUGHT REGION, MAY FACE REJECTION AT $85.39
Key Resistance Levels: $80.00, $84.00, $88.00
Key Support Levels: $66.00,$62.200,$58.00
USOIL (WTI) Long-term Trend: Bullish
USOIL has been in an uptrend but it may face rejection at $85.39. The index is retesting the previous high of $85.39. In previous price action in October and November, the bulls failed to break above the overhead resistance. Meanwhile, on December 9 uptrend; a retraced candle body tested the 50% Fibonacci retracement level. The retracement indicates that WTI will rise to level 2.0 Fibonacci extension or $81.61. From the price action, buyers have broken above the Fibonacci extension and have reached a high of $84.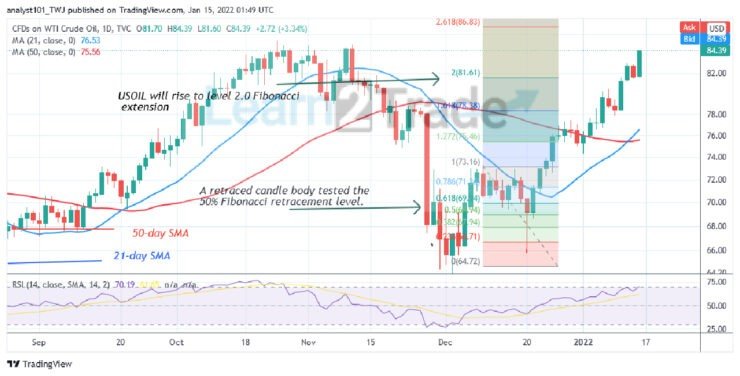 USOIL – Daily Chart
Daily Chart Indicators Reading:
USOIL is at level 70 of the Relative Strength Index period 14. It indicates that the index is in the overbought region of the market. The current uptrend is likely to face rejection at the recent high. Besides, sellers will emerge to push prices down. The index price is above the 21-day SMA and 50 –day SMA which indicates a further upward move.
USOIL (WTI) Medium-term bias: Bullish
On the 4-hour chart, the index is in an uptrend. WTI price has broken above the resistance at level 83.00. Meanwhile, on December 12 uptrend; a retraced candle body tested the 78.6% Fibonacci retracement level. The retracement indicates that WTI will rise but reverse at level 1.278 Fibonacci extension or $84.22.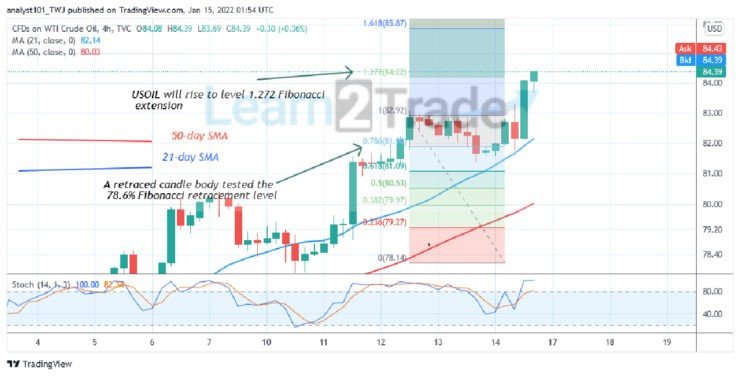 USOIL – 4 Hour Chart
4-hour Chart Indicators Reading
The index is above the 80% range of the daily stochastic. The market has reached the overbought region. Sellers are likely to emerge to push prices down. The 21-day and 50-day SMAs are sloping upward indicating the uptrend. The uptrend will continue to the upside as long as price bars are above the moving averages.
General Outlook for USOIL (WTI)
USDOL has reached the overbought region of the market but may face rejection at $85.39. The current uptrend is likely to terminate at the previous price level of the market. WTI is trading at $84.39 at press time.
Source: https://learn2.trade -
ANNUAL FORECAST FOR EURJPY (2022)
EURJPY Annual Forecast – Price Is Set to Scale New Heights With a Bullish Flag Formation
The annual forecast for EURJPY is for it to scale new heights, having conformed to a bullish flag formation. The bullish flag formation, an offshoot of the triangle pattern, began towards the tail end of 2020 as bulls began to exercise dominance in the market. The market began to recover from the 116.910 support level in May 2020. It pulled back when it first hit the upper border of its triangle pattern and surged through it at the second time of asking, thereby leading to the creation of the flag pattern.
EURJPYJPY Significant ZonesSupply Zones: 134.150, 140.650, 149.010
Demand Zones: 113.920, 116.910, 127.630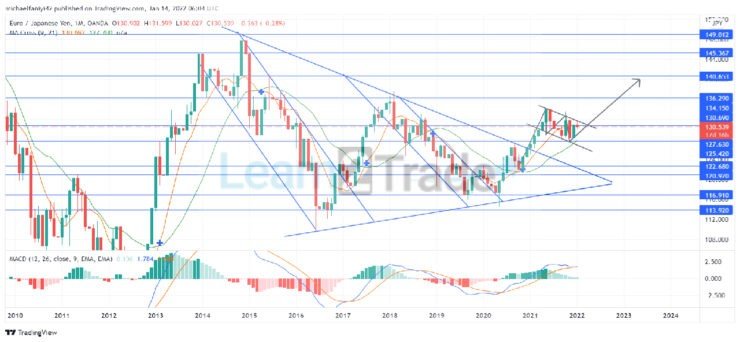 EURJPY Long Term Plan: Bullish
A bearish impact is visible annually in the market, notably since 2013. Every time EURJPY makes a bullish move, the move is cut off prematurely and it always leads to a plunge back around the 113.920 demand level. This happened from 2013 to 2016, and then from 2017 to 2020. The result is a triangle-tapered market structure. By June 2020, the price hit the 116.910 demand level and began another ascent, but this time, it eventually broke the triangle pattern on 2021 New Year’s Day.
The flag pole was formed as the price surged from 120.920 and was stopped abruptly at 134.150. Subsequently, EURJPY began cranking through a downward channel. This continued into the year 2022. The market forecast is for an upward liquidity flow. The upward signal of the MA Cross is still very valid. Meanwhile, the Moving Average Convergence Divergence indicator is showing dwindling bullish bars. This is due to the downward ranging in the market. Its signal lines remain above the zero level.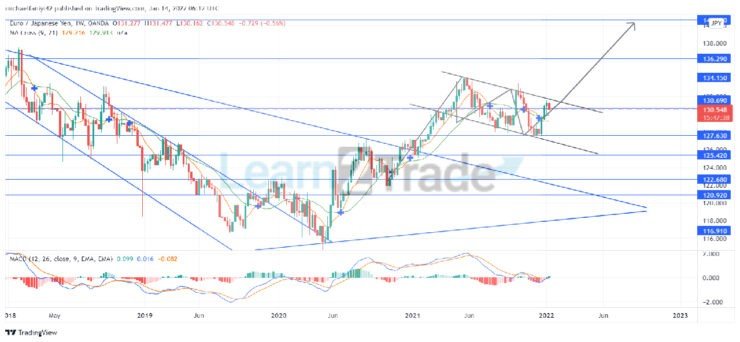 EURJPY Medium Term Plan: Bearish
In early 2022, prices are set to drop after hitting the upper border of the ranging channel. The MA Cross is directed down-sideways to show the undulating nature of the current market. The same can be said for the MACD indicator.
The annual forecast is towards the end of the year 2022 into early 2023 when the bullish flag pattern is anticipated to drive the market upward towards 140.650.
Source: https://learn2.trade -
ANNUAL FORECAST FOR GBPJPY (2022)
GBPJPY Annual Forecast – Bulls Have the Bias in a Ranging Market
The annual forecast for GBPJPY points to a bias in the bulls’ favor. The market has been in a ranging pattern as bulls and bears tussle for preeminence. Despite the bears’ being more aggressive, bulls are favored to gain preeminence. This is chiefly due to a very strong support level, which is at 132.980 and extends to 128.620. Currently, the price has risen from the support level to test the 157.000 resistance level, intending to break through it.
GBPJPY Significant LevelsResistance Levels: 157.000, 174.770, 193.610
Support Levels: 149.260, 132.980, 128.620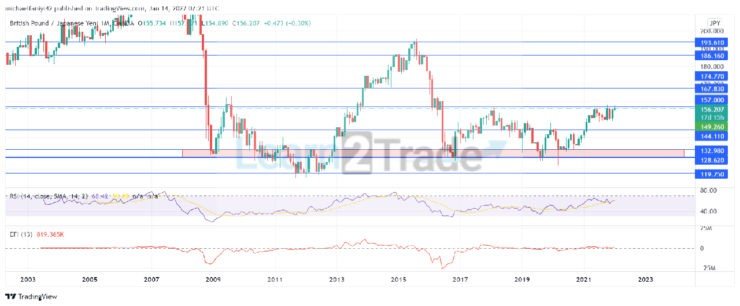 GBPJPY Long Term Plan: Bullish
Sellers effected a correction to the bullish rise that happened from mid-2012 to mid-2015. The market got rejected at 193.610 and it took about a year to fall back to the 132.980 strong support zone. A bullish bounce occurred after that, but a limit was placed on the market at 157.000. This helped the seller to keep pounding against the strong support unsuccessfully. The bulls have stepped back to lift the market to 157.000.
The market rose from the support level in November 2020 and violated the 144.110 middle-range line. By May 2021, the price had touched below the 157.000 resistance and was rejected. Price, however, keeps recovering from the 149.260 level to retest the resistance. This continues into the year 2022. The RSI (Relative Strength Index) influences the annual forecast in the bulls’ favor as it has remained above the mid-level since 2020.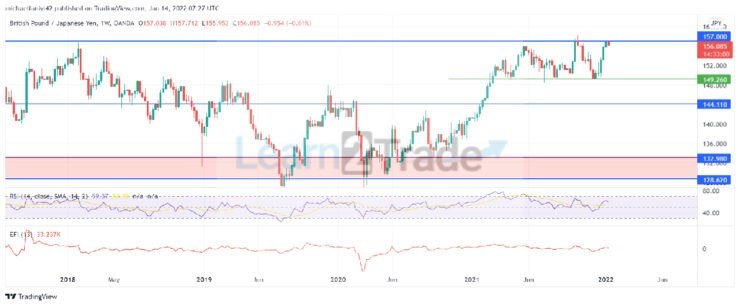 GBPJPY Medium Term Plan: Ranging
On the weekly chart, the market is essentially in equilibrium, as shown by the EFI (Elders Force Index) power line, which is almost parallel with the zero line. The RSI indicator still predisposes the market in the bulls’ favor as its line remains in the bulls’ half. The market is set to drop to 149.260 again to continue ranging, but the forecast is that GBPJPY will eventually break upward towards 167.830.
Source: https://learn2.trade
-
LITECOIN (LTC) FLUCTUATES BETWEEN $144 AND $155 AS BUYERS RECOUP TO RESUME UPTREND
Key Highlights
LTC price resumes downward correction
Litecoin fluctuates between $144 and $155
Litecoin (LTC) Current Statistics
The current price: $148.18
Market Capitalization: $12,451,441,024
Trading Volume: $12,451,441,024
Major supply zones: $200, $220, $240
Major demand zones: $100, $80, $60
Litecoin (LTC) Price Analysis January 5, 2022
Litecoin’s (LTC) price is still in a downward correction as buyers recoup to resume uptrend. Since December 28, the cryptocurrency fell to the range-bound zone at the bottom of the chart. On December 23 uptrend, the altcoin corrected upward but was repelled at the $165 resistance level. Consequently, LTC/USD fell below the moving averages. Today, Litecoin is consolidating above $144 support but below $155 resistance. The uptrend will resume if the bulls break above the moving averages or $165high.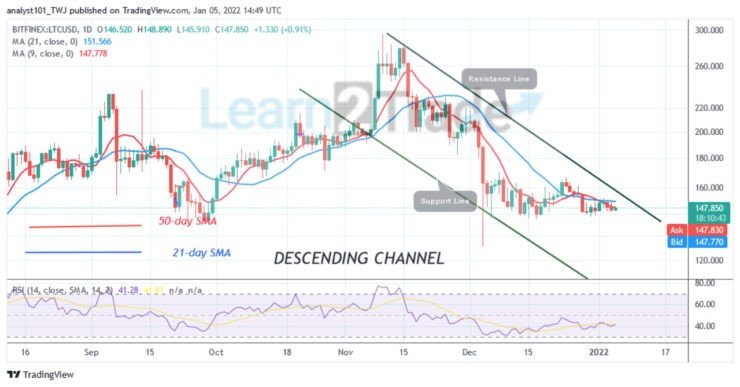 LTC/USD – Daily Chart
Litecoin (LTC) Technical Indicators Reading
LTC price is below the moving averages which indicate a possible fall of the cryptocurrency. The crypto has fallen to level 41 of the Relative Strength Index for period 14. The altcoin is in the downtrend zone and below the centerline 50. The market is above the 40% range of the daily stochastic. The bullish momentum is unstable as the price fluctuates.
Conclusion
Litecoin is in a range-bound move at the bottom of the chart as buyers recoup to resume uptrend. The price action is characterized by small body candlesticks called Doji and Spinning tops. The candlesticks are responsible for the current range-bound move. The candlesticks indicate that buyers and sellers are undecided about the direction of the market.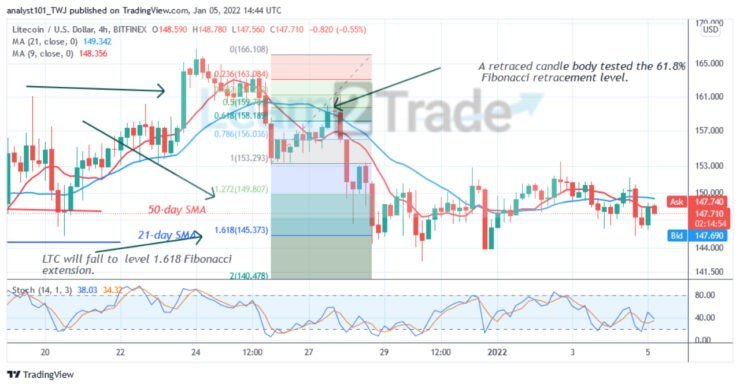 LTC/USD – 4 Hour Chart
Source: https://learn2.trade
-
BINANCE COIN (BNBUSD) PRICE APPROACHES POTENTIAL BULLISH REVERSAL LEVEL
BNBUSD Price Analysis – January 07
Further increase in the sellers’ momentum will push down the Binance Coin to break the support level of $430 and if the daily candlestick close below it, then, the price may decrease further to test the $364 support levels.
BNBUSD Market
Key levels:
Resistance levels: $503, $540, $599
Support levels: $430, $364, $311
BNBUSD Long-term trend: Bearish
Binance coin is bearish on the daily chart. The crypto was trading between the resistance level of $540 and the support level of $503 last week. The coin has tested the resistance level of $540 twice which indicate a signal for the bears to dominate the Binance coin market. On 05 January, the bears prevailed over the bulls with the formation of strong bearish candle that breaks down the support level of $503, the price is decreasing towards the $430 price level.
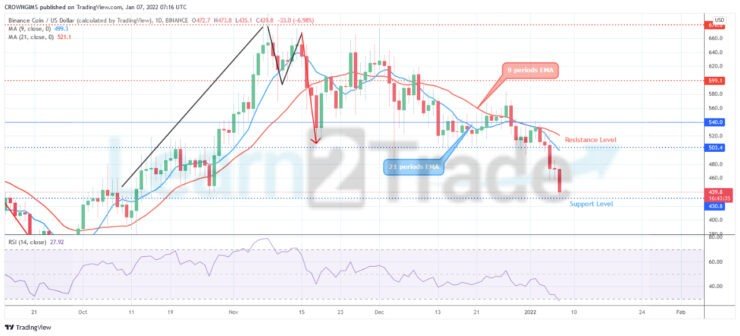 BNBUSD Daily chart, January 07
Binance Coin has penetrated the fast moving average and the slow moving average downside. The coin is trading below the 9 periods EMA and 21 periods EMA at distance which indicate that the bears’ momentum is gradually increasing in the Binance coin market. The Relative Strength Index period 14 is at 20 levels with the signal lines pointing down to indicate sell signal. Further increase in the sellers’ momentum will push down the Binance Coin to break the support level of $430 and if the daily candlestick close below it, then, the price may decrease further to test the $364 support levels. Inability to break down the support level of $430 by the bears, BNBUSD will break up the $503 and bullish trend may commence to the resistance levels at $540, and $599.
BNBUSD medium-term Trend: Bearish
BNBUSD is bearish in the 4-hour chart. The price was ranging within the $540 and $503 levels last week. The price broke up the resistance level of $540 on December 27. The sellers rejected the price increase and break down the support level of $503 on January 05. The price is heading towards the support level of $430.
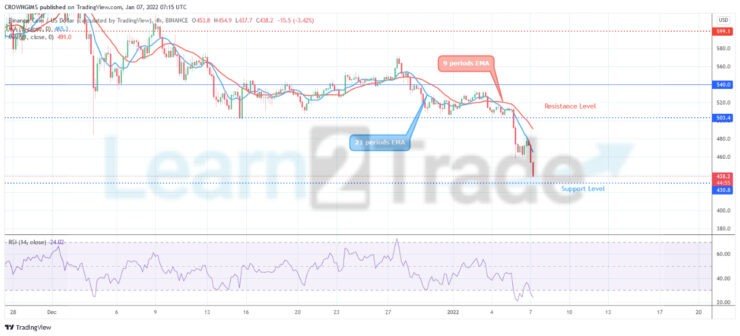 BNBUSD 4-hour chart, January 07
Binance coin is trading below 9 periods EMA and 21 periods EMA which indicate an increase in the bears’ momentum.
Source: https://learn2.trade
The exit of a super trader and a world-renowned trading coach
in Trading Psychology
Posted
THE EXIT OF A SUPER TRADER AND A WORLD-RENOWNED TRADING COACH
DR. VAN K. THARP TURNS TO LIGHT
“In loving memory of Van K. Tharp (1946 – 2022). A beloved leader who touched the lives of so many traders around the world.” – VTI
Our hearts are heavy to share the news that Dr. Tharp, our beloved Van, has turned to light and passed to the other side.
Dr. Van K. Tharp passed away from liver failure on Thursday, February 24, 2022, in Raleigh, North Carolina. His wife of nearly 30 years, Kala Tharp, was at his side. She has lovingly cared for Van during his illness which was first diagnosed in June of 2021.
Dr. Tharp will be remembered for being among the world’s top trading coaches. He is a founding father of the trading psychology field. Van was also a trading concept innovator, a brilliant teacher, and a humble leader. He had a keen, creative mind and a singular ability to be authentic in each moment.
Over the last 20 years, Van experienced a great spiritual awakening which profoundly influenced his life and he wanted to share those gifts with everyone. Van developed a deep trust for his Inner Guidance and came to believe that “God is everything in the universe”. Van would want us to remember that even in our apparent loss at the moment, we are all one with each other and we are one with the Divine.
Van touched the lives of many people across the globe. People regularly sent him letters thanking him for helping them change their lives through his books, home study courses, and workshops.
In the last few months, Van’s health challenges started becoming more obvious and he received an outpouring of love and appreciation from many.
Who then, is Van Tharp?
Professional Coach for Traders and Investors
In the unique arena of professional trading coaches and consultants, Dr. Tharp stands out as an international leader in the industry. Helping others become the best trader or investor that they can be has been his mission since 1982.
Dr. Tharp offers unique learning strategies, and his techniques for producing great traders are some of the most effective in the field.
Over the years, Dr. Tharp has helped people overcome problems in areas of system development and trading psychology, and success related issues such as self-sabotage. He is the founder and president of the Van Tharp Institute, dedicated to offering high-quality educational products and services for traders and investors around the globe.
While Dr. Tharp’s expertise is in the area of finance, his mission is to touch people in a way that changes them for the better. In his books, courses, and workshops, he uses the financial metaphor to do so.
Dr. Tharp uses a combination of skills and education to fine-tune his strategies to coach, consult and teach traders and investors. He received his Ph.D. in psychology from the University of Oklahoma Health Science Center in 1975. He is a certified Master Practitioner of Neuro-Linguistic Programming (NLP), a Certified Master Time Line Therapist, a certified Modeler of NLP, and an Assistant Trainer of NLP. He has used his expertise in NLP to create the successful models of trading and investing upon which so much of his work is based.
Dr. Tharp published the Market Mastery newsletter for over 10 years, and now publishes a weekly e-newsletter, Tharp’s Thoughts.
Speaker and Presenter
The Van Tharp Institute offers workshops year-round to help traders improve performance. In addition, Dr. Tharp has designed special seminars for banks and institutions and has presented these throughout the United States, as well as Paris, Italy, Singapore, Sydney, Melbourne, Venice, London, Vienna, Stockholm, Frankfurt, Nuremberg, Hungary, and numerous other places throughout the world. He has toured Asia as a guest speaker with Dow Jones and was the keynote speaker in 2011 at the largest investment conference in Poland.
He has conducted workshops for floor traders at the CBOT, the CBOE, and the CME. He is also a regular speaker to a portfolio and hedge fund managers worldwide. He was a member of the distinguished Investment Advisory Panel of the prestigious Oxford Club-a rare honor only half dozen or so individuals have received.
Dr. Tharp is also a highly rated guest speaker at expositions and conferences throughout the world.
Van Books:
1. The Definitive Guide to Position Sizing Strategies: How to Evaluate Your System and Use Position Sizing to Meet Your Objectives, 2013
2. Trading Beyond the Matrix: The Red Pill for Traders and Investors, 2013
3. The Peak Performance Course for Traders and Investor, 1989
4. Super Trader: Make Consistent Profits in Good and Bad Markets, 2010
5. Trade Your Way to Financial Freedom, 2007
Some Memories of Van:
“Dr. Van Tharp’s exit has been very painful for me. I came across him when I was contemplating quitting trading because I had hit a roadblock, a dead-end, and an impasse. I was 100% frustrated and I wanted to go do something else with my life. Then I came across Van in an old edition of TRADERS’ magazine, and I had a rude awakening. It dawned on me that there are successful traders, professional traders. What are they doing differently? Through Van, I realized that what they are doing differently fly in the face of conventional wisdom, plus what most traders like to do, as people tend to look for a solution to their problems in the wrong places and do the wrong things. Since then, I have hooked to Tharp’s teachings, formulas, thoughts, updates, and newsletters. This is the biggest factor that has helped me reach the top echelon of trading mastery. I gained a lot of life-saving and career-saving knowledge from Van, as well as tips on other markets and cryptos. I had the 3 most important trading coaches, as far as I’m concerned. I lost Joe Ross in September 2021. I lost Van Tharp in February 2022, and only James Altucher remains alive. The loss of Van Tharp is a wound that cannot heal on time… I will sorely miss him. However, I’m glad that he lived a successful and fulfilled life, and he impacted numerous lives. Truly, a man’s worth is measured only by what he gives others. The testimonies below are just a few from an outpouring of testimonies given when the news of his transition was broken.” – Azeez M.
“Dear Van, I will be forever grateful to you for the profound changes you were able to create in so many people. You introduced me to the Red Pill and my life was changed forever (for the better, of course)! I joined your Super Trader program in 2013 and underwent many wonderful transformations. Your guidance was so helpful, and my happiness level soared. I have not been to Cary in over 3 years, but I still miss the love and spiritual energy that enveloped VTI. My heart goes out to my dear friend Kala and the VTI staff. I am so glad you will be carrying on Van’s mission!” – Susan P.
“His books has a great impact on my decision-making. He was a risk management Guru. His contribution is priceless, always wanted to meet him but never got a chance. I am grateful for all the knowledge he has shared through his books and seminars. His work will be helpful for the generations to come…” – Mihir T.
“I met Van in ’97 when he played the marble game at a workshop in Reno, Nv. His positive influence on me got me started on my path of personal development that has also spilled over to my wife and children. I still have a lot of work to do in my super trader journey. Van, Kala, RJ, past and present staff and all the other students that I have met at training over the years have all in some way helped me become a better person. The journey continues.” – Eugene C.
“Thank you all for sharing your stories and experience. I am finding a lot of comfort and peace in all your stories. Nothing will give Van so much joy as listening and reading about all the lives he has touched. You all make him so proud. You are all the reason he did what he did. I told him one day please don’t die, and he said I don’t want to die but then death is all an illusion. He reminded me to always live in the present, do my gratitude meditation and live life. Van lived his life to the fullest every day. During his last days he could hardly walk but would seat and write his new book, he managed to write 4 chapters. It was his life story. He told me the liver cirrhosis was a blessing. There is not enough space to share my experiences with you here, but you all get the picture. Seeing all your responses I am so confident and humbled that Van Tharp’s legacy will live on through you all and all the amazing teachers Van has produced at VTI, RJ, Ken Long, Gabriel, and the list goes on. I will miss him dearly because living with him has been an adventure, you never know what to expect next, it is always full of surprises. He was the kindest, most generous, amazing man I will ever know. I feel so honored and humbled to have been his wife. He was a shy, simple and down-to-earth man. I will miss him so much. But he facilitated my growth to be a strong and independent woman. Will forever be grateful to this genius legend I shared 30 years with. He left me with a lot of tools, to help me continue to grow. Once again thank you all for generously sharing your stories.” – Kala Tharp (Van’s widow)
Source: https://learn2.trade/the-exit-of-a-super-trader-and-a-world-renowned-trading-coach