
Welcome to the new Traders Laboratory! Please bear with us as we finish the migration over the next few days. If you find any issues, want to leave feedback, get in touch with us, or offer suggestions please post to the Support forum here.


analyst75
-
Content Count
656 -
Joined
-
Last visited
-
Days Won
2
Posts posted by analyst75
-
-
On the day Apple was founded, here’s how the founders divided the shares:
Steve Jobs — 45%
Steve Wozniak — 45%
Ronald Wayne — 10%
You’ve heard of Steve Jobs. You’ve heard of Steve Wozniak.
You probably haven’t heard of Ronald Wayne.
Why? Because Wayne didn’t last.
12 days after they founded Apple, Wayne sold his 10% stake for $800. One year later, he forfeited any potential future claims for $1,500.
In total, he walked away from Apple with $2,300.
Big mistake.
In 2018, when Apple became the first $1 trillion company, his shares would’ve been worth $100 billion.
Today, with Apple’s market cap hovering around 2.87 trillion… it’s worth a lot more.
It doesn’t end there.
In the 1990s, Wayne sold his copy of Apple’s original founding documents for $500.
In 2011, the same documents were auctioned off by the buyer for nearly $1.6 million at a Sotheby’s auction.
We All Make Mistakes
In many ways, we all can kind of feel Ronald Wayne’s pain.
We’ve all missed the boat. Made mistakes. Have regrets.
Regret is a powerful teacher. That is, if we can learn from it.
Truth is, 99% missed the boat on today’s titans.
But consider when many of them were founded:
Intel → 54 years ago
Microsoft → 47 years ago
Apple → 46 years ago
Amazon → 28 years ago
Netflix → 25 years ago
Google → 24 years ago
SpaceX → 20 years ago
Tesla → 19 years
Facebook → 18 years
Twitter → 16 years
Airbnb → 14 years
Uber → 13 years
Zoom → 11 years
That, on average, is about 25 years.
In 25 years, I bet half of these companies won’t exist. They’ll be replaced by new industry titans.
Right now, many of those titans are just getting started.
And these new titans will look nothing like the companies today.
Web3 Barons
Most people can’t see it yet…
But many of today’s largest companies will be replaced by trillion-dollar crypto networks.
And here’s the thing.
Years from now, you might look back on this email…
And one of two things will happen:
You’ll either feel like Ronald Wayne.
Or you’ll feel like the person who bought 10% of Apple for $800.
If you want to feel like the latter…
There are only a few strategies we know of.”
Author: Chris C.
Profits from games of knowledge: https://www.predictmag.com/
-
The DEFC price is up over 175% in the past 24 hours, currently trading at $0.23 on Bitmart exchange.
From its daily low of $0.08 to its high of $0.25 was an over 300% move for DeFi Coin.
Liquidity is low on Bitmart however the DEFC / USDT pair is currently green again with today’s daily candle holding most of the gains from yesterday, suggesting new buyers have stepped in.
There is likely to be little selling pressure as DEFC already retraced 98% from its all time high of $4 set in July 2021.
DeFi Coin has completed another phase of its roadmap, the version 3 launch of their Defiswap.io DEX, app and farming pool.
The DEFC project aims to be an alternative to decentralized exchanges such as Pancakeswap, Uniswap and Sushiswap, providing liquidity for crypto swaps with no centralized third party required.
More info here: https://deficoins.io/#
Want to buy DEFC/USD?: https://pancakeswap.finance/info/token/0xeb33cbbe6f1e699574f10606ed9a495a196476df
-
Is this kinda program still accessible?
Make money from Forex, stocks, commodities, indices and cryptos with us: https://www.instaforex.com/en/index.php?x=LYZG -
This is really an old broker.
Make money from Forex, stocks, commodities, indices and cryptos with us: https://www.instaforex.com/en/index.php?x=LYZG -
Lucky Block (LBLOCK)’s highly-anticipated $1 million jackpot is only a few hours away. At press time, the LBLOCK jackpot and NFT winner will be announced in 35 hours, according to data from the network’s website.
Apart from the $1 million jackpot up for grabs, Lucky Block is also giving away another $1 million in its NFT draw alongside a Lamborghini Aventador, priced at over $400,000. The daily main prize draws will begin on June 6.
Participants in the lottery continue to flood the network by purchasing the network’s native token LBLOCK and its Platinum Rollers NFT to stand a chance to win. Holding either the token or the NFT is your ‘ticket’ for the draw, making this a multidimensional income-making endeavor. That said, the time to stock up on tickets (LBLOCK token and Lucky Block NFTs) is now.
Interestingly, holders of Lucky Block’s NFTs have twice the chances of winning the jackpot, considering the limited circulating supply of NFTs. Also, NFT holders are automatically awarded free entry for life into the daily draw. For those who haven’t already purchased a ticket and are interested in a rare opportunity to become a millionaire, the Lucky Block website provides detailed directions on how to partake in the jackpot.
Key Lucky Block Levels To Watch — May 30
Unsurprisingly, LBLOCK has recorded a notable rally on the eve of the jackpot draw. The play-to-earn cryptocurrency has jumped by over 25% in the last 24 hours.
 LBLOCK 4-Hour Chart on TradingView
We expect to see more price rallies to the runup of the jackpot. That said, estimates suggest that LBLOCK could jump by 100%, double its price, before the end of the week. This would put LBLOCK back at the $0.0050 mark for the first time since early March. The potentials for profits in the coming weeks are even more exciting, and LBLOCK holders are set to smile to the bank in the near term.
Meanwhile, my resistance levels are at $0.0030, $0.0035, and $0.0040, and my support levels are at $0.0022, $0.0020, and $0.0018.
Total Market Capitalization: $1.27 trillion
Lucky Block Market Capitalization: $251.21 million
You can purchase Lucky Block here. Buy LBlock
-
3 Secrets Of Everlasting Victory In The Markets – Part 1
Updated: 13 May 20223 MANDATORY INGREDIENTS FOR PERMANENT TRADING SUCCESS
“Stop trying to force trades with strategies that don’t work for you. Instead, enjoy the freedom of executing trades that fit your psychology and that help you reach your financial objectives.” – VTI
In case you didn’t know, trading is the second most difficult job in the world. The only job that is more difficult than trading is defusing nuclear bombs. No, I don’t mean to scare you, but you need to accept this brutal truth if you want to really attain the goal of financial freedom as a trader.
Trading is a very tough game. It is well known that roughly 70% of traders lose their capital within the first year of funding their accounts, and eventually, more than 95% of traders cannot succeed consistently. It’s even argued that less than 3% or 2% of all traders in the world can boast of permanent victory.
Honestly, “over 95% eventual losers” isn’t a sexy statistic. But it shows how hard trading is. Period. I have said it over and over again: What makes trading difficult is the everlasting fact that the next movement of price can never be predicted with absolute certainties. This is the biggest factor behind traders’ losses. They think the market will behave in certain ways, but the market behaves differently.
What are your trading beliefs?
In his past newsletters, the late Dr. Van Tharp always said, “You do not trade the markets—no one does. Now that might sound surprising to many of you. But what you really trade are your beliefs about the market. Furthermore, your ability to do so is tempered by your beliefs about yourself.”
You live your life according to your beliefs. You deal with people according to your beliefs. If you’re religious, you worship according to your beliefs. Everything you do in life is according to your beliefs: schooling, marriage, eating habits, dressing, business, parenting, hobbies, etc.
If you’re a trader, your trading styles, strategies, entries, exits, position sizes, etc. are according to your beliefs. So your trading activities reflect your beliefs as a trader.
Are your trading beliefs useful?
Some trading beliefs are totally useless and some are really useful.
Are you part of the 95% losing traders, or do you belong to the 5% who make consistent profits? Look at your account history…
If your account history is not attractive (negative) that means your beliefs about the markets are not useful. If your account history over the years, or several months, is amazing (positive), then your trading beliefs are useful.
Unfortunately, most beliefs about the markets are not useful. The world is full of problems
The world is full of problems and the majority of the problems are man-made. We create problems for ourselves as a result of what we do.
For example, what would be the result of chain-smoking? What would be the end results of criminal activities? What about those who are destroying the planet earth because of their own personal gains? What about those who complain of the poor economy and they keep on voting bad leaders into power?
Likewise, as an individual, your life is what you make it.
What is happening to you as a trader is the result of your actions. If you have problems from trading, you created the problems yourself.
The surest way to make progress in life
The best way to make progress in life is to realize your mistakes and stop repeating them. If it’s going to be, it’s up to you. If the results you’re getting in life are not what you want, the only way to get good results is to stop the habits or actions that constantly create problems for you.
Likewise, in trading, the only way to make progress and become a consistently profitable trader is to stop doing things you’re currently doing, which have not been giving you good results. You cannot continue trading the way you’re trading and expect better results. There’s no way that’s possible.
The most guaranteed way to always be a losing trader, is to always trade to satisfy your emotions. You can’t continue trading to satisfy your emotions and expect breakthroughs.
The unpredictability of the markets is our ally
If you’re still reading this article, count yourself very lucky.
Those small percentage of permanently successful traders are successful because they have found ways to make profits from the markets without being able to predict with absolute certainties.
And the principles they use are simple in theory, but difficult to apply, owing to serious psychological problems.
Nonetheless, if you’re really tired of losing money… If you want to be among those less than 5% who are consistently making money, then stay tuned for the second article in this series. It would reveal two secrets of consistent triumph, while the third article in the series will reveal the third and the final secret.
We are not talking about the ups and downs of trading. We are not talking about making money temporarily and then blowing accounts, making another money, and blowing accounts again. We are talking about the permanent process of making money.
Your goal in life is to be a successful trader, and success is possible if you can discipline yourself to apply the 3 secrets that would be revealed in the next articles.
The first part of the articles is ended with the quote below:
“My greatest challenge was the idea my opinion is not worth a pinch of s***. The more I accepted my opinion was worthless and the more I accepted whatever the market provided – the better and more consistent my results became.” – Sven HolmesInsights into the Mindset of Super Traders
Source: https://learn2.trade/3-secrets-of-everlasting-victory-in-the-markets-part-1 -
Why Inflation Is A Good Thing
Inflation would be the greatest thing to happen to me.
I selfishly want the government to spend as much money as possible. “You can’t print money forever!” everyone is shouting.
Yes you can. And they will.
They’ve been printing money for decades, and only now it’s making the headlines. The reason I am selfishly supportive of inflation is that there is a well-known maxim in poker that “money flows clockwise.” If you sit to the left of the weakest player at the poker table, then eventually you will have all of their money.
Every time they bet, you raise them, scaring out all of the other players. So you are now “heads-up” with the weaker player. It’s just the two of you. Luck will give him some hands, but luck/skill will give you most of the money.
In inflation, the same thing happens. Print up a trillion dollars and give it to everyone… and where does it end up?
Eventually it’s all put in the stock market or in real estate. To be fair, some of it is now showing up in crypto.
Inflation of a currency occurs when goods that are priced in that currency go higher (IN THAT CURRENCY) year-over-year or month-over-month. For instance, gas — which you buy with dollars — is over $3 a gallon for the first time since 2008.
This is VERY important to understand. Gas itself is not different. Gas is not even worth more UNLESS it is priced in US dollars.
Everything you own goes up in value, but ONLY IF it is priced in US dollars. What do I mean?
Here are things you might own that will go up if inflation goes higher:
Stocks
Real Estate
Cryptocurrencies
Collectables
Services you offer
The more you own of the above, the less inflation hurts you.
And if you own “Good” stocks or “Good” real estate, then you will make a lot of money during inflationary periods.
But what’s a good stock or good real estate?
Without inflation, it is very hard to predict the stock market. When there is no inflation, the stock market will stay the same except for stocks that are growing. And it’s very hard to know which companies will grow.
Remember this: Almost all of the growth in the stock market over the past 100 years has occurred because of inflation. I don’t give a shit about “candlesticks” or P/E ratios or what The Wall Street Journal says.
So, ok, if you own a basket of stocks — and that is the bulk of your net worth — then you will survive inflation. But how can you BEAT inflation?
It’s simple. Just own stocks in an industry that is growing faster than inflation.
Some industries are fully mature, and I would not bet on them. Sure, Exxon and Chevron will go up when gas prices are going up. But they are not interesting, and eventually their stocks settle down.
The oil industry might even be in trouble as renewable energy gets more realistic.
But just look in your life. Do you drive more? Do you use the computer more? Do you read more? Ask yourself which activities you do are “inflating.”
Author: James A.
-
Unfortunately, if you’ve sent crypto, it’s likely gone for good, never to be recovered. At this point, because of the worldwide nature of cryptocurrency, there is no central authority that can help you recover your crypto. Make sure that what ever price you paid becomes tuition in the school of crypto life. You’ve learned a hard lesson. Print a certificate or do whatever you need to do help you move on, but ultimately learn from the experience and move on. Trying to recover what you sent is a battle you will likely waste more time, energy, and maybe money on with NOTHING to show for it in the end.” – Airdrops Blog
Profits from games of knowledge: https://www.predictmag.com/ -
DeFi Coin Soars By Over 500% In Two Days As DEFC Prepares For Bull Cycle
DeFi Coin (DEFC) surged by over 175% last Wednesday alone, as the price rallied to $0.23 on Bitmart. On that day, the DeFi token jumped from a daily low of $0.08 to tap a high of $0.25, a jaw-dropping 300% single-day move.
That said, DEFC did not stop there. Instead, the cryptocurrency surged by another 124% between May 5 and May 6. However, it has since retraced to the $0.470 area, where it currently trades.
That said, analysts opine that bullish continuation might be brewing in the background for the DeFi token. Impressively, DeFi Coin put up this exceptional bullish performance when most of the market suffered monumental losses, as Bitcoin slumped to the $33,000 low, a record yearly low.
In other news, DeFi Coin recently achieved another milestone in its roadmap after launching its Defiswap.io decentralized exchange (DEX), app, and farming pool.
DEFC aims to become the go-to alternative to decentralized exchange giants, like Pancakeswap, Uniswap, and Sushiswap, and provides liquidity for crypto token swaps in a decentralized setting.
A recent report suggested that DEFC could attract a listing on Coinmarketcap with its recent meteoric rally, which should amplify the token to more audiences and attract more investors and developers.
Key DeFi Coin Levels To Watch — May 9
As mentioned earlier, DEFC has recorded a massive boom over the past few days after recording an activity and volume spike last Wednesday.
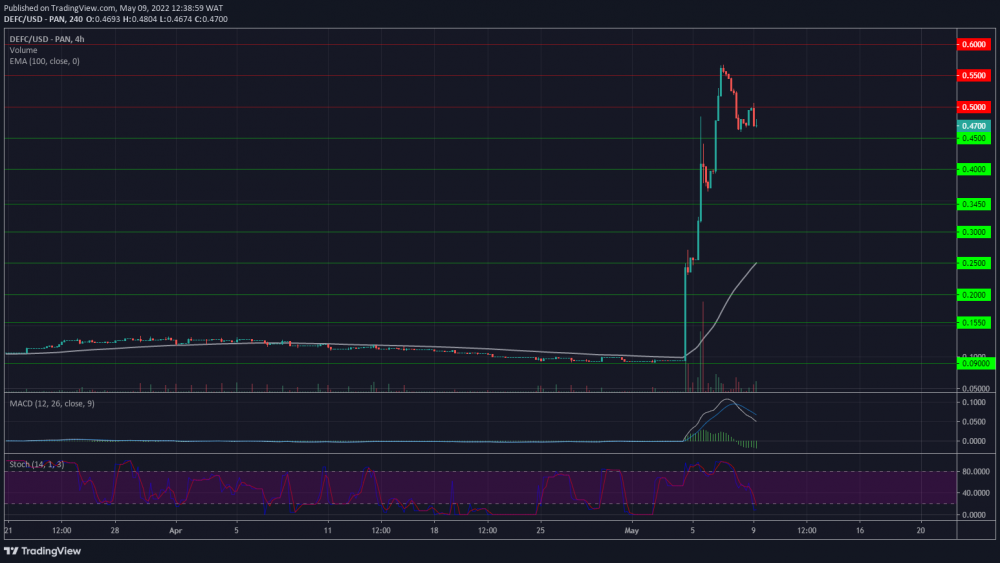 DEFC 4-Hour Chart on TradingView.
The decentralized token jumped by a volcanic 514% between Wednesday and Friday before correcting mildly to the $0.470 zone. The cryptocurrency still trades up by 411% from its lowest point in May, recorded on May 4.
With the bearish pressure on the broader market persisting on Monday, DeFi Coin could record a bullish slow down and enter a sideways pattern. However, analysts believe that the cryptocurrency has now touched the floor from its recent crash, adding that it could start a bull cycle soon.
Meanwhile, my resistance levels are at $0.500, $0.550, and $0.600, and my support levels are at $0.450, $0.400, and $0.350.
Total Market Capitalization: $1.51 trillion
DeFi Coin Market Capitalization: $49.3 million
Source: https://learn2.trade -
“Forbes magazine just updated their annual lists of billionaires.
And if you’ve been following the red-hot crypto market, it should come as no surprise that more and more new crypto billionaires are being minted.
Here are just four examples:
Jed McCaleb — early investor in both Ripple (XRP) and Stellar Lumens (XLM).
Tyler Winklevoss — invested heavily in Bitcoin starting back in 2012.
Cameron Winklevoss — also an early Bitcoin investor.
Tim Draper — invested in Bitcoin in 2014 and was one of the early investors in leading altcoin Tezos.
Can you see what they have in common?
They’re billionaires today because they invested in young, up-and-coming cryptocurrencies before they were well-known.
They bought Bitcoin in its early days. Or they were among the early investors in newer cryptos that took blockchain technology to the next level.
It’s just more evidence of what I’ve been telling you for weeks:
For the opportunity to build the kind of monumental wealth that early Bitcoin investors have created, you need to look beyond Bitcoin, even beyond the most popular altcoins.
You need to explore a sector of the crypto world that almost no one has ever heard of — a small group of new, under the radar cryptocurrencies that could soon burst out of the digital shadows.” - – Altucher Confidential
Profits from games of knowledge: https://www.predictmag.com/
-
Solana (SOL) Declines To $95 Low But Recovers Above $100
Solana consolidates above $100
SOL/USD is in a downtrend
Solana (SOL) Current Statistics
The current price: $101.36
Market Capitalization: $51,901,058,136
Trading Volume: $1,876,922,199
Major supply zones: $280, $300, $320
Major demand zones: $160, $140, $120
Solana (SOL) Price Analysis April 18, 2022
Solana’s (SOL) price is in a downtrend as the cryptocurrency recovers above $100. Solana is trading above the 50-day line SMA but below the 21-day line. Since April 11, the altcoin has been fluctuating between the moving averages. The bulls and bears are yet to break the moving average lines. A break below or above the moving average lines will compel the altcoin to trend. Today, the altcoin is trading above the 50-day line SMA if the bears break below the current support, the market will decline to the lows of $87 or $77 price levels. Conversely, if price rebounds above current support, the 50-day line SMA will be broken and Solana will rise to revisit the previous highs. SOL/USD – Daily Chart
Solana (SOL) Technical Indicators Reading
The altcoin is at level 45 of the Relative Strength Index for period 14. The market is in the downtrend zone and below the centerline 50. The crypto’s price is between the moving averages as the altcoin continues to be range-bound in a range. Solana is above the 70% range of the daily stochastic. The market is in a bullish momentum. The 21-day line and the 50-day line SMAs are sloping downward.
Conclusion
SOL/USD is in a downward move as it recovers above $100. The altcoin is making an upward correction as it faces rejection at the high of $103. Meanwhile, on April 7 downtrend; a retraced candle body tested the 61.8% Fibonacci retracement level. The retracement indicates that Solana will fall to level 1.618 Fibonacci extensions or $93.84. SOL/USD – 4 Hour Chart
Source: https://learn2.trade
-
Bitcoin SV Price Analysis – April 25
Further increase in the bears’ pressure will decrease the price to break down the support level of $73 which may expose the price to $50 and $41 price level. In case the support level of $73 holds, the price may increase towards the resistance level at $87, $105 and $123.
Key Levels:
Resistance levels: $87, $105, $123
Support levels: $73, $50, $41
BSV/USD Long-Term Trend: Bearish
On the daily chart, Bitcoin SV is bearish. Last two weeks, the coin was on the bullish movement in the daily chart. The resistance level $105 was tested when the price pulled back from $73 support level. The bears opposed the price increase and long tailed daily candle formed. Follow the scenario is the formation of bearish engulfing candle which triggered a bearish trend. The price is currently facing previous low of $73 price level.

The two EMAs are bending down to follow the direction of the price. The crypto continue its trading below the 9 periods EMA and the 21 periods EMA which indicate bearish momentum. Further increase in the bears’ pressure will decrease the price to break down the support level of $73 which may expose the price to $50 and $41 price level. In case the support level of $73 holds, the price may increase towards the resistance level at $87, $105 and $123.
BSV/USD Medium-Term Trend: Bearish
Bitcoin SV is on the bearish movement on the medium-term outlook. The bears eventually dominates the Bitcoin SV market. The momentum of the bears increase and the price decline to break down the support level at $87. The price is decreasing towards the support level of $73 at the moment.

The price is trading below the 9 periods EMA and 21 periods EMA which indicate that bears are in control of the market. The relative strength index period 14 is below $25 levels displaying a bearish signal.
Source: https://learn2.trade
-
LUCKY BLOCK MARKET PREDICTION: LBLOCK/USD ANTICIPATES AN IMMINENT UPRISING
Lucky Block Market Prediction – April 13The Lucky Block market prediction is for an imminent uprising as the price touches down at the $0.00246460 key support level.
LBLOCK/USD Long-Term Trend: Bullish (30-Minute Chart)Key Levels:
Supply Zones: $0.00378260, $0.00324440, $0.00272320
Demand Zones: $0.00272320, $0.00246460, $0.00222220 LBLOCK/USD is currently anticipating an imminent uprising as it drops lower. The market’s downward slide is an opportunity to accommodate more buy traders are low price levels. There is a good chance that the market’s uprising will begin from its current support level at $0.00246460 or a more substantial confluence level just below the current level.
Lucky Block Market Prediction: LBLOCK/USD Is Gathering Momentum for an UprisingIn a bid for the market to return under their dominance, the buy-traders have stopped directly pushing against the $0.00304100 resistance zone.
Instead, the bulls have allowed a drop in the price to accommodate more market investors. The lower the price, the more buy-traders are added, and the greater the probability of an imminent uprising.
The market failed to rally at $0.00272320 and has dropped to $0.00246460, where bulls anticipate a price rise. A predominantly bearish MACD (Moving Average Convergence Divergence) chart shows reducing bearish momentum as its line gyrates closer to the zero level from below.
LBLOCK/USD Medium-Term Trend: Bullish (5-minute chart)The 5-minute chart shows that the price has been bouncing on the $0.00246460 significant support level. However, the squeeze of the Bollinger Band around the candles speaks of the current silent nature of the market. This is the same situation on the 30-minute chart.
 There is a more positive outlook for the bulls on the MACD chart. Its lines have shifted from predominantly bearish to fluctuating around the zero level. If the market fails to drive up from this level, it will drop to a more substantial level below, at $0.00222220, which contains a bullish confluence. Whenever the market rises, it will aim to break the $0.00304100 resistance level.
Source: https://learn2.trade
-
REGAINS BULLISH MOMKey Resistance Levels: $1,900, $1,950, $2000
Key Support Levels: $1,750, $1, 700,$1,650
Gold (XAUUSD) Long-term Trend: Bearish
Gold (XAUUSD) has been consolidating above $1,907 as it regains bullish momentum. XAUUSD is trading above the 50-day line moving average but below the 21-day line moving average. The market will trend when the moving average lines are breached. For instance, if the bears break below the 50-day line moving average, the downtrend will resume. The market will decline to the low of $1,844. On the upside, if the bulls break above the 21-day line moving average, Gold will rise to revisit the previous high of $2,040. However, the market will continue to consolidate if the range-bound levels remain unbroken.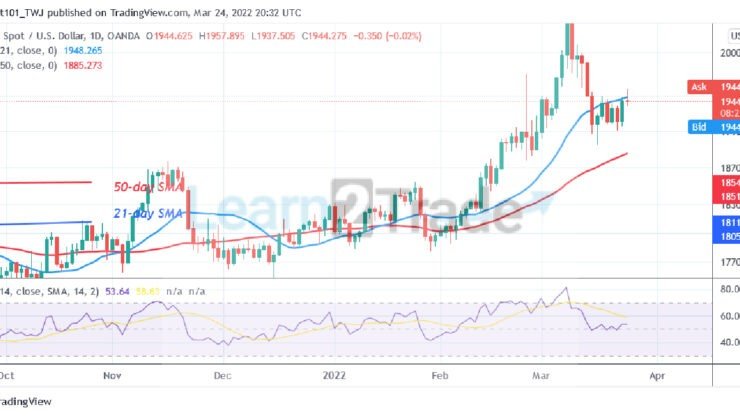 XAUUSD – Daily Chart
Daily Chart Indicators Reading:
Gold is at level 54 of the Relative Strength Index for period 14. It is now in the uptrend zone and capable of rising to the upside. The 21-day SMA and the 50-day SMA are sloping upward indicating the uptrend. The price bars are between the moving averages indicating the range-bound move.
Gold (XAUUSD) Medium-term bias: Bullish
On the 4-hour chart, the Gold price is in an upward move. The uptrend has been stuck below the $1,960 resistance zone. Meanwhile, on March 23 uptrend; a retraced candle body tested the 78.6% Fibonacci retracement level. The retracement indicates that Gold will rise but reverse at level 1.272 Fibonacci extension or $1,956. From the price action, Gold has retested the level 1.272 Fibonacci extension and reversed it.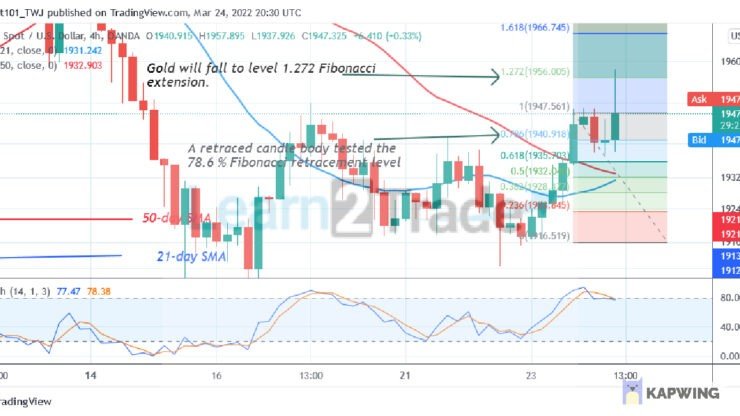 XAUUSD – 4 Hour Chart
4-hour Chart Indicators Reading
XAUUSD is above the 80% range of the daily stochastic. Gold is likely to face rejection as the market reaches the overbought region. The 21-day SMA and the 50-day SMA are sloping upward indicating the downtrend.
General Outlook for Gold (XAUUSD)
Gold’s (XAUUSD) price is in a sideways trend as it regains bullish momentum. The uptrend is facing rejection at the $1,960 high. The price indicator has shown that Gold is in the overbought region of the market. There is the possibility of price fall.Source: https://learn2.trade
-
WHY I’M BULLISH ON “HISTORICAL” NF
In 2020, the global NFT market did about $338 million in transaction volume.
In 2021, it surpassed $41 billion.
Meanwhile, the global physical collectibles market, including trading cards, games, toys, coins, etc., is a $370 billion market.
If history is any indication, when a physical market goes digital, it eventually grows even bigger than the traditional market.
For example, the e-commerce market is already bigger than the physical retail market. The digital entertainment market is bigger than the physical entertainment market.
NFTs are unique because they combine several lucrative markets into one.
Art + Collectibles + Luxury Goods + Gaming + Gambling
Added up, these markets represent a $1 trillion+ opportunity.
That’s why some analysts predict the digital collectibles market could be at least twice as big as the physical collectibles market in less than ten years.
And, looking out further, the broader NFT market — with potential use-cases for everything from event tickets to supply chain tracking — could become bigger than the Internet.
In short, there’s room to grow.
But, here’s a harsh truth:
About 99% of the digital collectible NFTs that exist today will go to zero.
(By the way, that’s what James and I said in 2017 about the ICO market. Fact check: true.)
That’s why, when it comes to NFTs, I focus almost exclusively on a certain class of NFTs… those with historical value.
Let me explain why, and tell you about the first NFT I bought in 2017.Life of a Nomad
I’ve been writing about, studying, and engaging in the cryptosphere since about 2012-2013.
In 2014, as part of this journey, I gave up my apartment and started living a nomadic lifestyle, writing, traveling, learning, and seeing the world.
For about five years, I made homes everywhere. Bangkok to Brazil. Texas to Tijuana. Lithuania to Little Rock. Malaysia to… the magnetic meridian. All over.
Everywhere I went, I sought out the crypto communities. (And they were around, even back then.)
It was beautiful, but got lonely. After year three, I felt like a ghost floating around the world, watching others grow roots and forge lasting relationships.
Of course, I’m grateful I was able to do it before everything shut down and was hurled into chaos. But the lifestyle alone was chaotic enough.
To scratch the surface…
I escaped packs of wild dogs in Bangkok and a wild-eyed stalker in Kuala Lumpur. I found myself at the center of a psychedelic renaissance in Prague… and hitchhiked on a mustachioed bus with a random group of Canadians all along the West Coast.
But nothing prepared me for South America… and my first foray into NFTs.
Build a Blockchain
In 2017, on a whim, I ended up in Brazil.
There, I signed up for an alternative academy called Exosphere, where you could take unconventional classes on things like “How to Live on Mars,” “Biohacking 101,” and “How to Build a Blockchain.”
I helped to build a blockchain-based voting system for a small village in Chile. No idea if they used it, but it worked. (Upon completion, I screamed “It’s alive! It’s alive! Now I know what it feels like to be God!” as my hunchbacked assistant stared at it in wonder.)
In 2017, you’ll recall, Venezuela was crumbling. Hyperinflation. Shortages. Violence. Chaos.
It was all over the news, and during a time when toilet paper shortages seemed unprecedented.
In the middle of this chaos, however, I caught wind of a tiny technology company getting rich in Venezuela… from art on the blockchain.
Huh?
Turns out, a small group of Venezuelans were minting their Pepe the frog digital art on the Bitcoin blockchain and making bank.
But the Venezuelans didn’t call them NFTs. Nobody had heard of “NFTs” back then.
They called them Rare Pepes.
[By the way, here’s a bit of trivia: The term “NFT” was coined in 2017 by Dieter Shirley, co-creator of CryptoKitties, the first NFT collection on Ethereum.]
The Rarest Pepe
Intrigued, I tracked them down and got their story.
Bitcoin and Rare Pepe memes saved their small digital arts business. In fact, they were one of a few companies left in their once-thriving business district.
The ring leader, John Villar (who, unfortunately, passed away last year), convinced me that art on the blockchain had a future.
I had a feeling.
I bought the first card from the collection for about $250.
I then got a cheap notebook (Frozen-themed, because, strangely, kid’s notebooks were all I could find in Brazil at the time), and wrote down the seed phrase.
I’m glad I did because of what happened next.
Disaster Strikes
A couple of months later, after a series of mishaps, I landed in Guatemala. There, a 5,000 pound boulder crashed through the roof of the house I was living in.
It landed in bed with me.
Instead of dying, which seemed like the only plausible option at the time, I fell out of bed. But instead of hitting the upstairs bedroom floor, which also seemed likely, I opted for another unlikely scenario: I fell out of the house completely and landed in the backyard.
(The boulder landed downstairs in the kitchen, hovering above me, held back by a few strands of rebar.)
You can actually see my bed underneath it.

Sounds crazy, but it felt like I was pulled out from that house. Saved.
Lady luck wasn’t as generous to my laptop. Though it was in my lap during the crash, I later found it downstairs in the kitchen, hiding underneath the boulder.
But you know what else did survive? That Frozen notebook with the seed phrase for the Rare Pepe card.
Untouched.
(Always write down your seed phrases! And maybe, for good luck, write them down in Frozen notebooks.)
For years, I held onto the notebook, convinced that John Villar’s vision of art on the blockchain would one day come true.
Fast-forward to 2021, NFTs went mainstream.
Rare Pepes were quickly recognized as “historical” NFTs and the one I bought — Series 1 Card 1 — had already become highly coveted.
Not missing a beat, I quickly sold that RarePepe for 111 ETH, or around $300,000.
Historical NFTs
All of this piqued my interest in “historical” NFTs.
When it comes to “digital collectibles,” new NFTs are being minted every minute. Thousands come online every single day. The market is drowning in JPEGs.
But if NFTs are indeed here to stay…
Those with historical significance have the best chance at sticking around and seeing a dramatic appreciation in price.
After all, the “historical” NFT supply is fixed. It will only decrease from here as wallets are forgotten and lost.
Right now, the historical NFT projects are overlooked in favor of apes and derivatives of apes and derivatives of those apes. But I don’t think that will be the case for long.
For now, it represents a huge opportunity for those with patience, conviction, and a little bit of luck.NB: By Chris Campbell
Source: https://learn2.trade/why-im-bullish-on-historical-nfts
-
Yahoo boys should be called thieves. Period.
When you say someone is a Yahoo boy, you are simply embellishing their evil profession.
“Aponle ni Mola, Hausa ni Hausa nje.”
Meaning: Malam is an honorary word, Hausa is Hausa.
“Adape oro ni omo mi nfewo.”
Meaning: It is euphemistic to say my child is light-fingered.Yahoo involves impersonation, lies and pretense to obtain money or anything of values from unsuspecting victims. That is theft.
So Yahoo boy is a euphemistic word. A thief is a thief.
ONE
Her boyfriend is a Yahoo boy. He just bought her an iPhone. – Wrong
Her boyfriend is a thief. He just bought her an iPhone – Right.
TWO
Some Yahoo boys have bought cars for their mothers. – Wrong
Some thieves have bought cars for their mothers – RightTHREE
How can I become a Yahoo boy? – Wrong
How can I become a thief?” – Right
About 5 Yahoo boys are doing rituals now. – Wrong
FOUR
About 5 thieves are doing rituals now. – Right
Calling them Yahoo boys would make them feel they are special and doing something unique.
Another better word is to call them an Internet thieves.
Profits from games of knowledge: https://www.predictmag.com/ -
ILVER (XAGUSD) PRICE IS STRUGGLING TO BREAK UP $25 RESISTANCE LEVEL
SILVER Weekly Price Analysis – March 03
In case the bulls are able to increase their momentum and penetrate the resistance level at $25 with the daily candle close above it, then, the price may increase further to $26 and $27 price level. Should the bears defend the resistance level of $25, the support level at $24 may be penetrated and price may decrease to $23 and $22 levels.
XAGUSD Market
Key Levels:
Resistance levels: $25, $26, $27
Support levels: $24, $23, $22
XAGUSD Long-term trend: Bullish
On the long-term outlook, XAGUSD is bullish. Bulls dominate the Silver market started from February 04. The bulls push up the currency pair and the resistance levels of $21, $22 and $23 has turned to support levels. The white metal pulls back to retest the support level of $23 before bulls exert more pressure and the price increase to $25 level. There is tendency for the price to increase further this week if bulls exert more pressure.
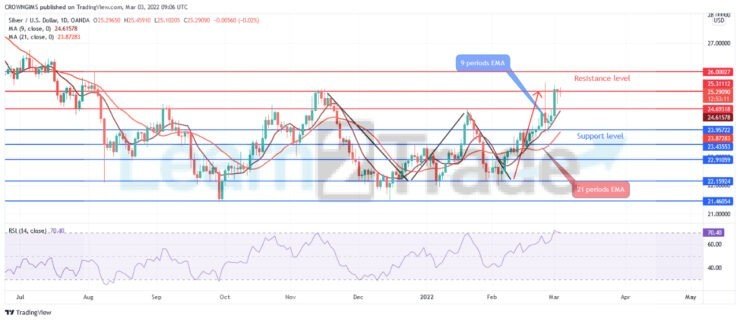 The price is trading above the 9 periods EMA and 21 periods EMA at a distance is an indication of bullish movement. In case the bulls are able to increase their momentum and penetrate the resistance level at $25 with the daily candle close above it, then, the price may increase further to $26 and $27 price level. Should the bears defend the resistance level of $25, the support level at $24 may be penetrated and price may decrease to $23 and $22 levels. The relative strength index period 14 is at 71 levels and the signal line bending up to indicate buy signal.
XAGUSD Medium-term Trend: Bullish
XAGUSD is bullish on the 4-hour chart. Last week, the bears’ momentum pushes the price from the $25 resistance level. The bulls’ pressure could not break up the level due to weak bullish momentum. The evening star candle pattern formed and the bears’ momentum increased and tested $23 level. At the moment, the price is inclining to break up $25 resistance level.
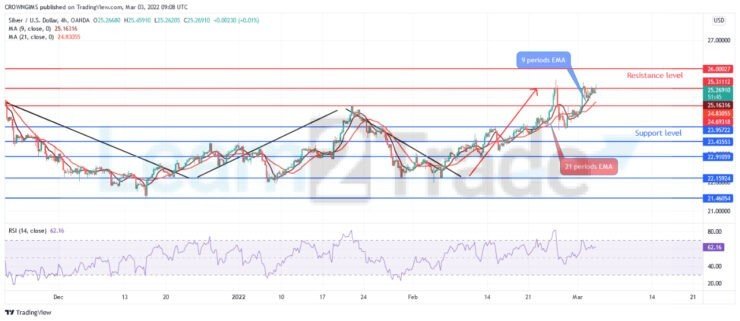 Silver price is trading above the 9 periods EMA and 21 periods EMA. The Relative Strength Index period 14 is displaying a bullish market direction.
Source: https://learn2.trade
-
GOLD CONSOLIDATES ABOVE $1,907 AS IT REGAINS BULLISH MOMENTUM
Key Resistance Levels: $1,900, $1,950, $2000
Key Support Levels: $1,750, $1, 700,$1,650
Gold (XAUUSD) Long-term Trend: Bearish
Gold (XAUUSD) has been consolidating above $1,907 as it regains bullish momentum. XAUUSD is trading above the 50-day line moving average but below the 21-day line moving average. The market will trend when the moving average lines are breached. For instance, if the bears break below the 50-day line moving average, the downtrend will resume. The market will decline to the low of $1,844. On the upside, if the bulls break above the 21-day line moving average, Gold will rise to revisit the previous high of $2,040. However, the market will continue to consolidate if the range-bound levels remain unbroken. XAUUSD – Daily Chart
Daily Chart Indicators Reading:
Gold is at level 54 of the Relative Strength Index for period 14. It is now in the uptrend zone and capable of rising to the upside. The 21-day SMA and the 50-day SMA are sloping upward indicating the uptrend. The price bars are between the moving averages indicating the range-bound move.
Gold (XAUUSD) Medium-term bias: Bullish
On the 4-hour chart, the Gold price is in an upward move. The uptrend has been stuck below the $1,960 resistance zone. Meanwhile, on March 23 uptrend; a retraced candle body tested the 78.6% Fibonacci retracement level. The retracement indicates that Gold will rise but reverse at level 1.272 Fibonacci extension or $1,956. From the price action, Gold has retested the level 1.272 Fibonacci extension and reversed it. XAUUSD – 4 Hour Chart
4-hour Chart Indicators Reading
XAUUSD is above the 80% range of the daily stochastic. Gold is likely to face rejection as the market reaches the overbought region. The 21-day SMA and the 50-day SMA are sloping upward indicating the downtrend.
General Outlook for Gold (XAUUSD)
Gold’s (XAUUSD) price is in a sideways trend as it regains bullish momentum. The uptrend is facing rejection at the $1,960 high. The price indicator has shown that Gold is in the overbought region of the market. There is the possibility of price fall.Source: https://learn2.trade
-
Hi Traders:
On a yearly basis, we choose a few of our loyal customers, and they become our Neteller VIPs.
This year, we have selected new Neteller VIPs, to join our existing one. They are:
Johnson Michael Temitope: This is our famous Mabelynene. He buys and sells Neteller constantly and he has been doing that for many years. We wish him the best in the years ahead.
John Ndubuisi Nwankwo: This great guy (also known as PrinceJohn) doesn’t make calls, nor send email or nor IM. He’s best known as an SMS buyer. He simply sends us SMS whenever he needs Neteller and we fulfill his orders as soon as we can. He is one of our most consistent buyers.
Olokuntoye Ibukun: Topechat is his handle. This is also one of our consistent buyers and sellers. He doesn’t buy Neteller only, as he also does Perfect Money (PM). He has referred customers to us, and we really appreciate him for that.NB: We now have a total of 26 VIPs in the house.
Who are the OUR NETELLER VIPs?ITU GLOBAL VIP MEMBERS’ REWARDS
Every calendar year, we choose 2 customers to become our VIPs. They have permanently special status with us and they can fund/withdraw Neteller through us, at parallel market rates, whether they open brokerage accounts through us or not.
These are people who funded with the highest amount of Neteller, and who also withdrew the highest amount of Neteller through us. They would be announced in January each year and added to our list of VIPs. Their status is permanent.
To fund and withdraw with Neteller, please visit: www.instantforex.com.ng
-
Why 95% of traders fail?
In this post, we will discuss the trader's road to success and why most of the traders give up at the halfway point.
On the chart, I was trying to portray the journey of a trader:
most of the traders start this game with gambling.
They randomly buy and sell the market relying on their intuition and with a high degree of probability end up with nice cush.💰
However, as they proceed they realize that the profits that they made were the product of luck, not skill. 🍀
The more they trade, the less they win.
At some moment losing trades start to outperform winners.
Trying different things, jumping from one strategy to another, one comes to the conclusion that nothing seems to work.🙅♂️
He goes broke, he is panicking.
At that stage, the majority blame the market for their failure.
Forex, stocks, gold trading is complete scam.
Making profits on the market is not possible.
They give up and leave.👣
Only 5% are persistent. Only 5% are blaming themselves not the market for their failure.
They start following a strict trading plan, they follow risk management recommendations of pro traders and at some moment they start making 0.📝
Buying and selling the market, at the end of the day, they don't lose anymore.
That is the most important milestone in a trader's journey.
Realizing that the one stopped losing, a trader starts polishing and improving his rules in order to achieve better results.
He trains and works with his psyche.💪
After years of struggling, one finally contemplates a consistent account growth.
He became a pro trader.🏆
I wish you to be persistent, traders and don't give up.
Patience pay and at the end of the day winners win: https://www.tradingview.com/chart/BTCUSD/ZmLTunDW-The-Journey-of-a-Trader/?utm_source=Weekly&utm_medium=email&utm_campaign=TradingView+Weekly+151+%28EN%29
Profits from games of knowledge: https://www.predictmag.com/
-
AUDUSD PRICE REACHES $0.755 RESISTANCE LEVEL, WHAT NEXT?
AUDUSD Price Analysis – March 30
The breaking up of $0.755 level by the bulls may push the price to test the resistance level of $0.763 and $0.770. Failure to break up the $0.755 level may lead to price reversal movement towards the support level of $0.745, $0.731 and $0.717.
AUD/USD Market
Key levels:
Resistance levels: $0.755, $0.763, $0.770
Support levels: $0.745, $0.731, $0.717
AUDUSD Long-term trend: Bullish
On the daily chart, AUDUSD is bullish. The currency pair really follow the direction of double bottom chart pattern formed Last three weeks. The currency pair formed a double bottom chart pattern at the support level of $0.968. The bullish momentum in the daily chart increased and turned the former resistance levels of $0.731 and $0.745 to support levels. The price reaches the high of $0.7555 last week and started a consolidation movement.
AUDUSD price is currently trading above the 9 periods EMA and 21 periods EMA which indicate that bulls’ momentum is increasing. The relative strength index period 14 is at 66 levels and the signal lines pointing up displaying bullish direction. The breaking up of $0.755 level by the bulls may push the price to test the resistance level of $0.763 and $0.770. Failure to break up the $0.755 level may lead to price reversal movement towards the support level of $0.745, $0.731 and $0.717.
AUDUSD medium-term Trend: Bullish
AUDUSD is bullish on the 4-hour chart. The sellers’ pressure was terminated at the support level of $0.717 on March 16. The bears’ pressure failed and the buyers gained more pressure to push up the price. The resistance level of $0.755 was tested last week after it penetrated $0.731 and $0.749 levels upside.
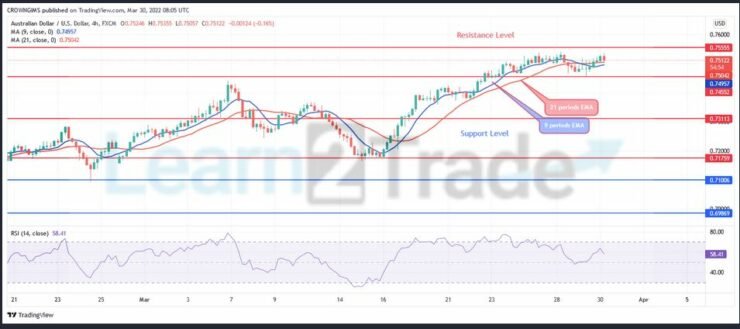
AUDUSD is trading above the 9 periods EMA and 21 periods EMA. The relative strength index period 14 is at 62 levels and the signal lines pointing up to indicate a buy signal.
Source: https://learn2.trade
-
EUR/JPY REACHES AN OVERBOUGHT REGION, MAY FURTHER RISE TO LEVEL 136.16
Key Resistance Levels: 132.00, 133.00, 134.00
Key Support Levels: 129.00, 128.00, 126.00
EUR/JPY Price Long-term Trend: Bullish
EUR/JPY pair has broken the previous overhead resistance and may further rise to level 136.16. The first uptrend retraced to the low of level 133.72 and commenced an upward move. Further upward move is unlikely as the market reaches the overbought region. In the first uptrend, EUR/JPY reached the overbought region at level 71 of the RSI but it fell to level 67. Buyers are still pushing the pair to the previous highs which may result in a fall.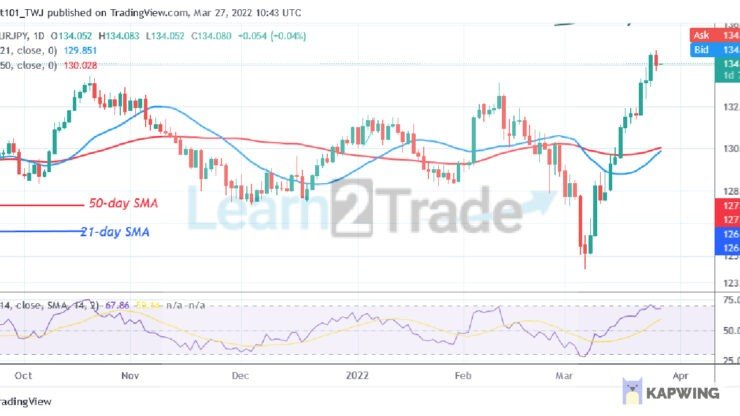 EUR/JPY – Daily Chart
Daily Chart Indicators Reading:
EUR/JPY is at level 69 of the Relative Strength Index for period 14. The currency pair is in the uptrend zone and it is resuming upward after the initial fall. The 21-day SMA and 50-day SMA are sloping horizontally indicating the sideways trend.
EUR/JPY Medium-term Trend: Bullish
On the 4- hour chart, the currency pair is in a smooth uptrend. The currency price has been making a series of higher highs and higher lows as the market reaches the high of level 134.64. The pair is likely to further rise if it breaks the resistance at level 134.74. Meanwhile, on March 22 uptrend; a retraced candle body tested the 50% Fibonacci retracement level. The retracement suggests that the EUR/JPY will rise to level 2.0 Fibonacci extension or level 136.15.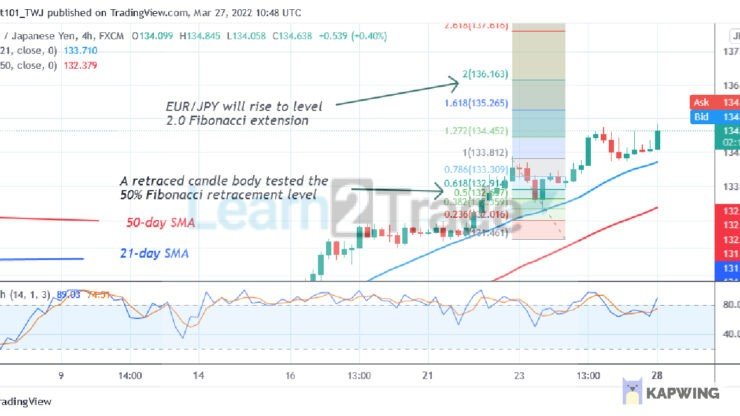 EUR/JPY – 4 Hour Chart
4-Hour Chart Indicators Reading
The pair is above the 80% range of the daily stochastic. EUR/JPY has reached the overbought region of the market. It appears the pair is likely to reach level 136.16. The moving averages are sloping upward indicating the uptrend.
General Outlook for EUR/JPY
EUR/JPY is in an upward move and may further rise to level 136.16. The downtrend will resume if the index fails to break level 134.74.Source: https://learn2.trade
-
LITECOIN BREAKS ABOVE PREVIOUS HIGHS, MAY FACE REJECTION AT $140
Key Highlights
LTC price revisits the resistance at $140
LTC/USD reaches an overbought region
Litecoin (LTC) Current Statistics
The current price: $120.91
Market Capitalization: $10,156,071,004
Trading Volume: $1,041,826,323
Major supply zones: $200, $220, $240
Major demand zones: $100, $80, $60
Litecoin (LTC) Price Analysis March 22, 2022
Litecoin’s (LTC) price is trading above the moving averages but may face rejection at $140. The cryptocurrency is trading in the overbought region of the market. Buyers are attempting to push the altcoin to the high of $140. On the upside, if price breaks the $140 resistance, Litecoin will rise to either $150 or $160 price levels. Conversely, if the altcoin faces rejection, the market will decline and resume a range-bound move between $115 and $140 price levels. In the overbought region, a further upward move is doubtful as sellers emerge to push prices down.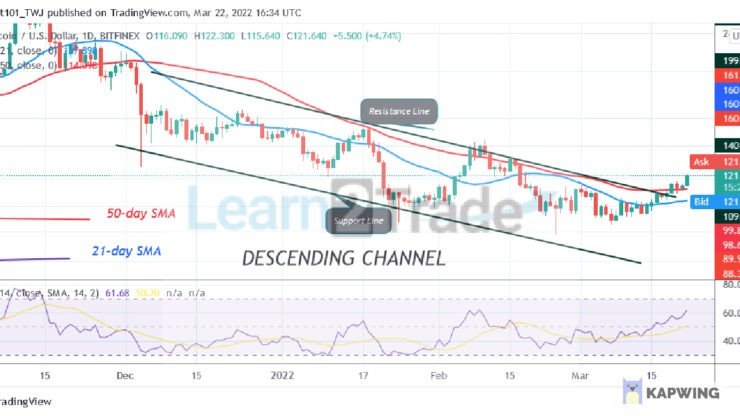 LTC/USD – Daily Chart
Litecoin (LTC) Technical Indicators Reading
The altcoin is at level 61 of the Relative Strength Index for period 14. It indicates that the altcoin is in the uptrend zone and capable of a further upward move. The crypto’s price is above the moving average which ensures further upward movement of the cryptocurrency. Litecoin is above 80% area of the daily stochastic. It indicates that the market has reached an overbought region as sellers emerge to push prices.
Conclusion
On the 4- hour chart, Litecoin is making an upward move but may face rejection at $140. The uptrend has reached the overbought region of the market. Meanwhile, on March 20 uptrend; a retraced candle body tested the 38.2% Fibonacci retracement level. The retracement suggests that LTC will rise to level 2.618 Fibonacci extension or level $135.02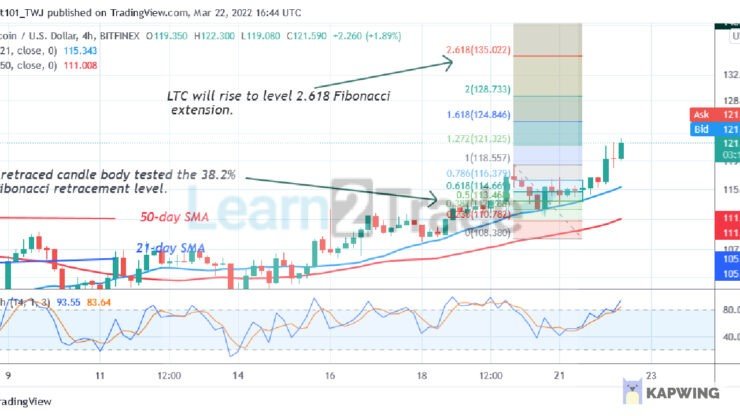 LTC/USD – 4 Hour Chart
Source: https://learn2.trade
-
CARDANO (ADA/USD) PRICE MAY BOUNCE AT SUPPORT LEVEL OF $0.75
ADA Price Analysis – March 22
In case there is an increase in the bulls’ momentum, $1.01 resistance level may be penetrated upside, then, price may increase further to $1.26 and $1.61 resistance levels. Bearish movement may commence towards the support levels at $0.75, $0.70 and $0.60 provided $1.01 level holds
ADA/USD Market
Key Levels:
Resistance levels: $1.01, $1.26, $1.61
Support levels: $0.75, $0.70, $0.60
ADA/USD Long-term Trend: Ranging
ADA/USD is ranging on the daily chart. The momentum of the bulls and that of the bears has been very low in the daily chart. This has led to the ranging of the price within the resistance level of $1.01 and support level of $0.75. It seems the bulls are trying to gain more pressure towards the resistance level of $1.01. Price may increase further as the bulls are preparing to dominate the market.
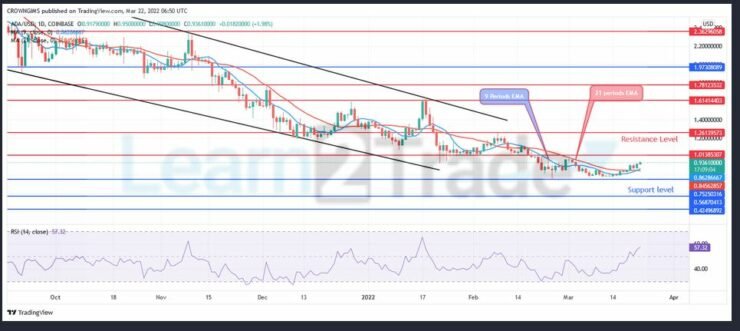
Cardano is trading above the 9 periods EMA and the 21 periods EMA, as an evidence of an increase in the bulls’ pressure. In case there is an increase in the bulls’ momentum, $1.01 resistance level may be penetrated upside, then, price may increase further to $1.26 and $1.61 resistance levels. Bearish movement may commence towards the support levels at $0.75, $0.70 and $0.60 provided $1.01 level holds. The technical indicator Relative Strength Indicator is at 57 levels with the signal line pointing up indicate buy signal.
ADA/USD Medium-term Trend: Ranging
Cardano is on the ranging movement in the 4-hour chart. The support level of $0.75 holds and the bearish momentum could not break down the mentioned support level. The bulls’ momentum is gradually increasing towards the resistance level $1.01. Cardano market is currently experiencing a ranging movement within the $1.01 resistance level and $0.75 support level. The coin is awaiting a breakout.
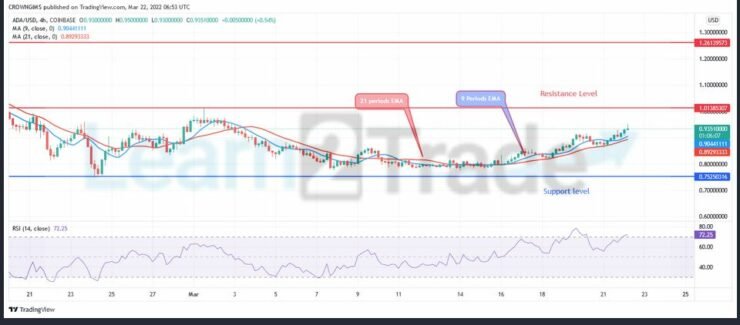
The price is trading above the 9 periods EMA and 21 periods EMA as a sign of increase of bulls’ momentum. The relative strength index period 14 is at 72 levels and the signal line exhibiting bullish direction.
Source: https://learn2.trade
Insights from Learn2.trade
in Market News & Analysis
Posted
8 Things I Wish People Had Told Me About Being A Trader
Not everyone will be happy for you.
 People will always ask for your latest tip.
 Strangers will think you’re a gambler.
The tall poppy syndrome is alive and well. Be careful who you share your dreams with, especially early on in your trading career. A dream is the most fragile when it is first birthed.
Trading sounds glamourous, but it isn’t.
The best traders follow the same routines day in and day out. This is less ‘Wolf of Wall Street’ and more ‘Groundhog Day’.
Never mind the discipline required to develop your short list of buys. Disregard the fact that most of those won’t even be the winners you were hoping they’d be. Your friends just want to know the name of the stock that is going to the moon on a one-way trip – and they feel sure that you know and you’re not willing to share.
Your friends and family will think you’re unemployed.
Full-time traders look like they don’t have jobs, so they’re asked the most unreasonable favours e.g. Can you drive my son into the city on Wednesday at 4.30pm? Goodness me… just because I don’t LOOK like I’m working doesn’t mean I’m NOT working.
You’ll be hit with some complete fallacies and expected to agree with people who have zero knowledge about what you actually do. “But trading is like gambling, isn’t it?” “You have to be really lucky to get a big win”. “My neighbour’s cousin bet big on crazycrypto and bought it when it was $1.00.” You will be subjected to these STUPID comments. Get ready for it.
You’ll be wrong more times than you ever imagined (but still make a good return).
The greatest trading group in the world – The Turtles, only win thirty five percent of the time. It’s how much you make each time you win that counts (and keeping your losses small).
This may be your next friendship group.
When I started trading, I had no idea that I’d have so much in common with such a diverse group of like-minded people all striving to perfect a high-performance endeavour.
Civilians will think you’re mad.
And because we are such a tight-knit group – those outside our group will never really relate with the calculated risks we take and the way we live our lives. They’ll never make the choices we made to excel and live life on our own terms.
Author: Louise Bedford
Source: https://learn2.trade/8-things-i-wish-people-had-told-me-about-being-a-trader