
Welcome to the new Traders Laboratory! Please bear with us as we finish the migration over the next few days. If you find any issues, want to leave feedback, get in touch with us, or offer suggestions please post to the Support forum here.


momentom
-
Content Count
147 -
Joined
-
Last visited
Posts posted by momentom
-
-
The thing that kills martingale is you are risking big to make small. Also, the distribution of the losses in a live sample WILL put you out of business when the row of losses is long enough - and it will be eventually.
-
What I really want is UPVOL and DNVOL on DAX and ESTX50. May have to try and build it in MultiCharts.
Thanks
-
Have a look at the INDICATOR section in the NT forum. There is a ton of programming of indicators there that people have contributed translating from TS and esIG
-
I am a Tradestation user!Thanks
Mark
Tradestation is really cr*p for MP. All but one of the sMP solutions do not have the functionality of easily splitting and merging profiles and showing volume profiles (which to me is critical to using MP for trading). The one "good" one is a bit clunky and is expensive- http://www.sirtrade.com/market.htm
The best TS solution I know of is to use the TS data into Ninjatrader which is FREE if you only use it to chart and to buy the MP add-on for about $250 one time cost.
-
Are there any equivalents to UpVol, DoenVol, Tick or Trin for the German Stock Market?
Tx
-
Walter, welcome to my world. I used to sleep 8+ hours a night. I fall asleep as my head hits the pillow. I wake up between 4 and 5 am, no matter what time I go to bed (which is usually 10pm). Started 4 years or so ago.
Scary info James.
-
Have you tried Enthios room on MIRC? Its more like real time setup calls. He posts screenshots on his blog with remarks and its free.I know Enthios' . He uses stochastics to time trades at VAH, VAL and VPOC I think. Good idea. Thanks
-
I'm looking at Market Profile Chat/Training Rooms.
So far, I've listed Balancetraqder, JPJ Trading and IOMT. Does anyone know of any more. I'll provide some feedback here after I've looked at each of them.
-
Just a heads up --This is "pirate software" not authorized by CBOT (license holder/owner of MP).
This means that the developer, who is a "one man shop" working out of Isreal, is taking a chance that he will not be "shut down" by the CBOT.
The CBOT requires a licensing fee for each user. So caution flag is out --before paying someone in Isreal for software that is risking being shut down.
There is a Volume Profile, works real great, not Market Profile but TPO - CBOT can't complain - there are a number of add-ins USA based - using the same TPO or similar description to avoid being in conflict with CBOT. Just look at Ensign. Totally disagree with your post. I'ma happy user.
-
Yes, all - tough reading. Dalton is a lot clearer.
-
I use both. If you want the charting platform use TS otherwise I would use IB
-
I am reliably informed by my daughter that VLCplayer can be downloaded for free and will play it Brown, so if what you are trying is not suitable, just google it or
-
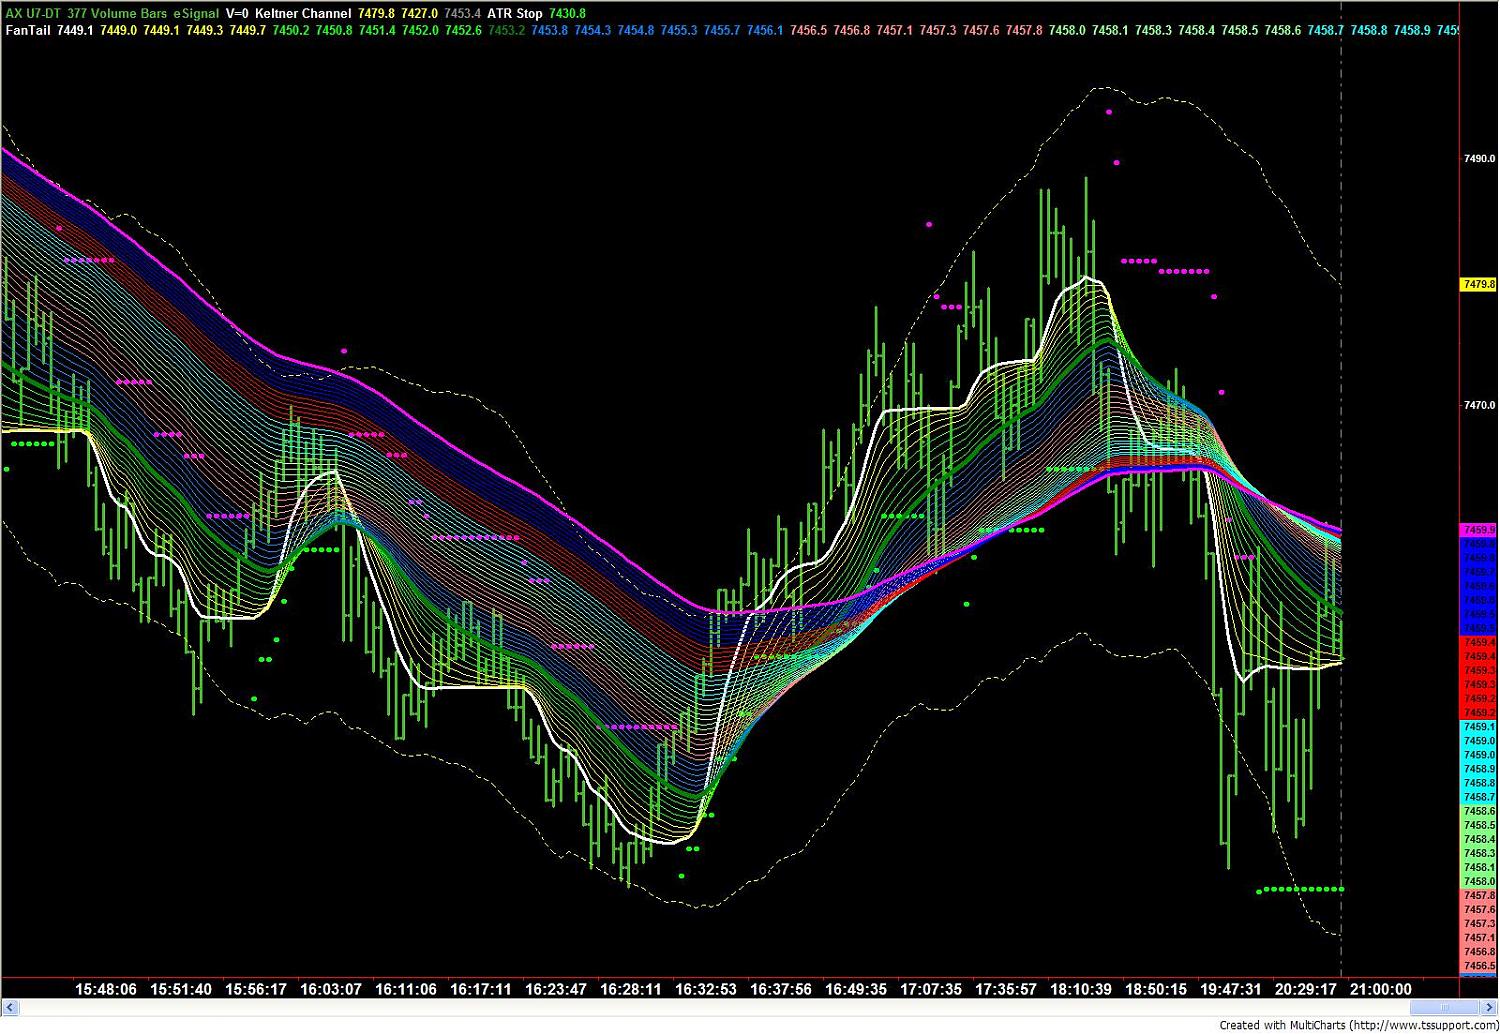
Here is what I finally settled on. Its The eld that Blu created imported into MultiCharts. I'm content with the horizontal line. The dotted lines is the ATR stop.
I am currently using it (with a few other things) to trade the DAX off this 377 volume chart. If Walter opens a non FX thread for the rainbow, I'll be happy to share - don't want to contaminate this one. Thanks again Walter, its a great addition to my toolbox.

-
Good posts dogpile.
I started to use ATR trailing stops because I needed something that would adjust to market conditions.
The ATR stop, by its very nature, adjusts to the volatility of the market.
The use of the inputs 10 and 3 may be a bit arbitrary although the logic is that calculating ATR over 10 bars is short enough to reflect current market conditions but long enough to give a "fair" picture. I keep the stop away by 3 ATRs because I find it far enough away to not be stopped olut unnecessarily most of the time yet close enough to get me out early enough at the end of a move. You might want to try numbers between 2 and 4 ( say every 0.25) if 3 doesn't suit. I'd be wary of over optimisation.
-
I'm confused we went from ATR 10/3 to 10*3?Say the ATR of the last 10 periods was 100 for simplicities sake, then the stop would be at -30 100/3. You wouldn't have it 10*3 cause that would make a ATR of 100 a 300 point stop. Wouldnt the 10*3 be a your first profit target and 10/3 your first stop?
Guys, back in the post I spoke about an ATR calculated over 10 bars, then taking that number and mutiplying it by 3 as Brown did. I called this the 10/3 ATR as shorthand, 10 and 3 being the input parameters of the ATR Trailing Stop.
Brown then clculated an ATR of 10 periods. I then agreed and said:
Quote:
If you are long then your trailing stop is current price minus 4.875. As the market moves up, trail stop is recalculated after each bar and moved up - never down. The opposite for shorts of course.
Unquote
Nick there was never a calculation of 10 divided by 3 - this would always be 3.333333
Hope this clears it up.
-
Bare with me if you will - I put a 10 ATR on my ES chart now. The value is 1.625. That x3 = 4.875.Now, what does that specific number tell me?
Again, sorry for the simple question but I've never gotten into ATR and would like to see how it operates as a trailing stop function.
If you are long then your trailing stop is current price minus 4.875. As the market moves up, trail stop is recalculated after each bar and moved up - never down. The opposite for shorts of course.
Is this OK?
-
momentom - I've never done much with the ATR. Could you explain further what you use here and how it's used. When I threw what I found on MultiCharts (Study > Average True Range) I was given the option for the ATRLength and AlertLength. I assume the Alert is just some sort of alert when a certain level is reached. And the default setting is a line at the bottom of the chart, similar to a stochastics type line.Just curious how you use this for trailing stop purposes as I am always looking to improve on this part of my trading.
I calculate the ATR over 10 periods which gives me a number. I then multiply that by 3 and my stop gets racheted as price moves. Stop can get closer to price but never moves further away. I don't have an indicator I can share as its part of a set of indicators written professionally for a group of us, but it shouldn't be too hard to code. You made need the Tradestation function ATRcalc
-
Exits have always been the most problamatic for me.
Ever since I came off the floor over 15 years ago I have been trying to stay in trades longer. my traders dna seems to be that of a scalper but I hate paying 25% of my profits to my clearer.
I found something that works. I put a basic trailing stop based on the old 10 period 3 Average True Range behind my position. It only kicks in after I am a "bit" in profit so I don't get shaken from the trees by a wiggle. I then manage the trade by exiting parts of the position based on my trading plan but use the ATR as my drop dead stop.
10/3 ATR is good because it takes the volatility of the last 10 bars as its basis. Some people don't use anything but the ATR to manage the trade.
I fiddled with the numbers of the ATR but 10/3 (which is pretty standard stuff) seems to be the best for me.
Hope this helps
-
Here's a template I did for Ninjatrader Fantail. It uses NT studies that are there and creates the Rainbow. Let me know please if you find any anomalies.
-
These exits are quite difficult but very important.
Your small sample size does look good but I'm not confident in THE EXIT until I see at least 100 trades on each of, say, 4 different pairs.
I had a look at THE EXIT on less correlated non FX markets and it did not work well as many markets move sideways on the 1 minute after the break and you would be stopped out just before the real move began. Perhaps looking at non FX is a mistake and perhaps THE EXIT is OK with only FX. The entry methodology is so nice with any market and I, for myself, would like to see a generic exit that also works with any market. I think Guppy had some that may be worth looking at. I will on the weekend.
-
Thanks zAt least no one is telling me off for saying "8 period ADX" is actually 15 period ema, not yet anyway.
Are you saying that each line of the rainbow is an ema that has been smoothed by a 15 period ema?
-
MomentumWhich lines are the least use to you, the narrower yellow side or the wider magenta side?
I find I need them ALL now. The overall "visuality" (if that's a word) really tells me all I need to know about momentum. I am less informed when I have fewer lines. Having said that, the yellower side tells me less. Walter's epiphany about the horizontal is the icing on the cake to stay out.
-
ztraderIf you do go to a pro, ask for just the 3 main lines, MA1=Black, MA12=Dark Green and MA49=Magenta. MT4 will only do 8 lines. I am inclined to think the rainbow serves little purpose, but more lines could be added in later if needed.
Good of you to offer.
.
PYenner, you are right in one way about needing only 3 lines. I deleted most of the rainbow and left just those three when I first looked at this - I believed the screen was too cluttered. However, I quickly returned to the full rainbow as I found that I was able to "see" better when the fan opened and closed. But maybe that's just me.
-
I will have to agree with you momentom on the implemetation of a little more tolerance like taking a slower ema for closing positions... actually thats the idea here to make some interaction about this issues...and I would love to hear what results some manual backtesting would give you... obvioulsy my scalper exit is really that... its a quick scalp...I am working on a paralel aproach that will be 100% aimed for scalpers but I think I want to finish presenting all this before getting into that, even opening a diferent thread for that scalping variation will be more organized...
Thanks for interacting momentom... had you seen any setup this evening ? cheers Walter.
I'm afraid my traderDNA is stronger than I am and I have jumped to your parrallel approach and am scalping the DAX with this method using 1 minute and 15 second charts. I'll add in what I find once you have started the new scalping thread so as not to polute this one. Going REALLY great so far.
DAX and EuroDJ50 Market Internals and Indices
in Market News & Analysis
Posted
NY Stock Exchange has a number of indices that reflect whether more shares are being bought or sold. This gives you an idea of whether the pressure is up or down. In eSignal they are $VOLD, $UVOL, $DVOL
If you track $UVOL-$DVOL on a chart you can see whether the "market" is red or green. Would be useful to see this on the German markets.