
Welcome to the new Traders Laboratory! Please bear with us as we finish the migration over the next few days. If you find any issues, want to leave feedback, get in touch with us, or offer suggestions please post to the Support forum here.


momentom
-
Content Count
147 -
Joined
-
Last visited
Posts posted by momentom
-
-
Jerry, how do you handle the period when the VWAP is switching between above and below the PVP? Do you stand aside or anticipate what you believe will happen? Thanks!
-
Does the TF future lead the cash index or the other way around? I see the russel future following the emini future.
TIA
-
I want some programming done on a paid basis for MultiCharts.
I am looking for someone with deep skills to use on a continuing basis.
Please PM me with contact details.
Thanks
-
Have you guys measured the effect of a lot of the range moving to the European time zone and earlier? Many of the best trades are now outside RTH.
-
I'm running windows 7. Hated Vista. W7 is a great improvement in both speed and less annoyance. Your old firewall does not work with W7 and there are no new ones that I have found, that do so am using W7 native firewall so far.
-
Trading for a tick successfully was only possible on the trading floor. We could read the microscopic order flow. No Chance to do it electronically as you have no edge for a tick with a reasonable stop. With a larger stop, the losses will eat up any number of 1 ticks.
Electronically, you can trade order flow but you need to stretch it for more than 1 tick to be overall profitable..
-
The only way I csan imagine this happening is that if its a Stop LIMIT and there are not enough lots on affer at your LIMIT. Regular Stop orders MUST be filled at the market when the Stop is elected.
-
BillM,
I was one of the early members of CompuTrac where Jim was a member too. I haven't looked at the formula for years, but now that volume is available intraday it must be useful again. Do you need the formula or are you looking for a coded indicator. If the fomer, I'll try and find my old CompuTrac papers.
-
I changed the account name I use in eSignal and cannot connect IRT to DataManager. Can' find where to change the esignal user name in IRT as it really does not need to authenticate.
Its Sunday so can't getresponse from linnsoft.
Anyone know where I make this change?
TIA
-
I haven't traded from the Oz timezone since 2003 and am looking at going back.
What futures indices full time traders trade now days and on what exchanges? Which brokers for these are suggested (apart from IB of course}.
I'm after first hand experience to add to the research I've done.
TIA
-
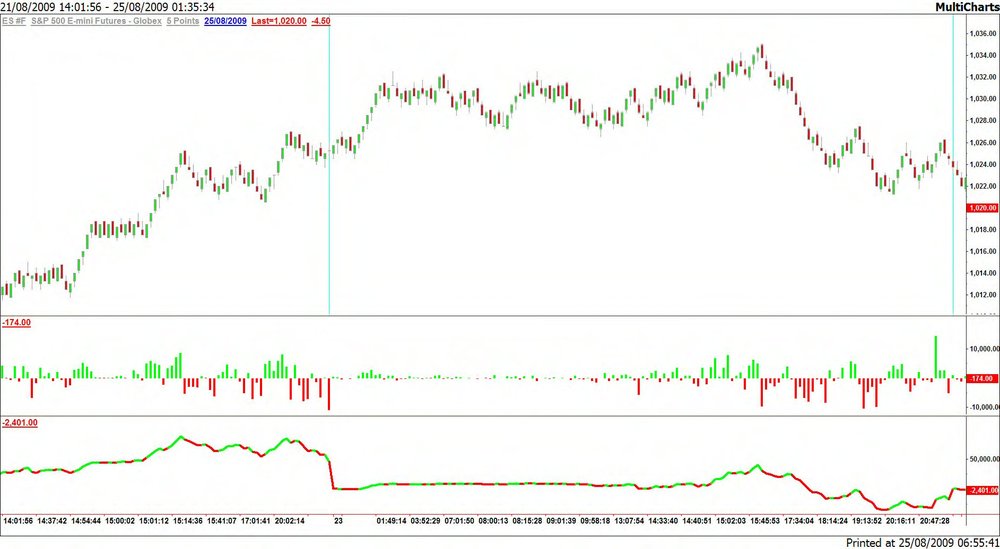
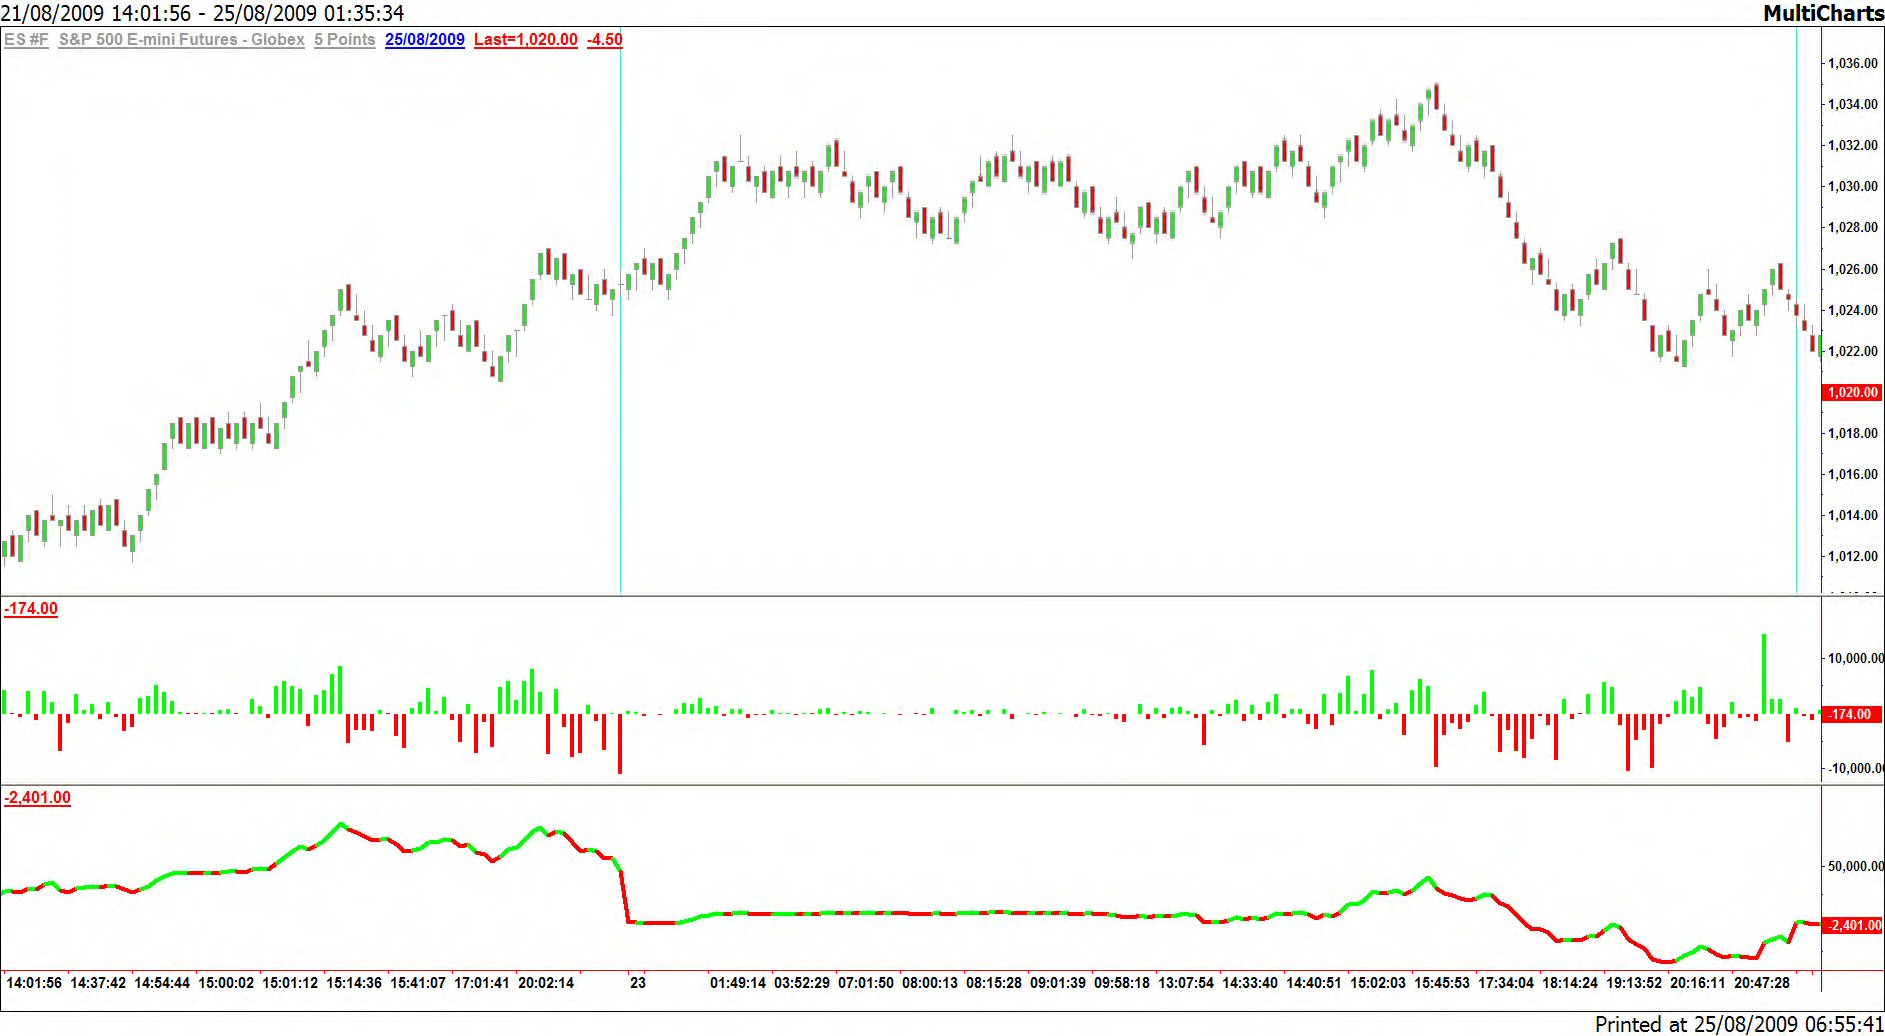
Thanks for everyone's help.
Attached chart shows 5 point Range bar chart of ES #F (24 hour) with Volume Breakdown and under that Cumulative Volume Delta. This is in Multicharts and loads historically if TRADE VOLUME is selected.
-
if d <> d[1] then begin...if (Time[1] <= yourRTH and Time > yourRTH) thenMyVol = 0;
etc
Thanks, that did it.
-
In MultiCharts, upticks-downticks and the symbol set to TRADE VOLUME gives you the volume breakout indicator that I can load historically. I'm now trying to get the cumulative VB.
-
No, I didn't. There is nothing in the expression that resets the number to zero at the end of the RTH session. I want to start from zero every "new" day after RTH.
-
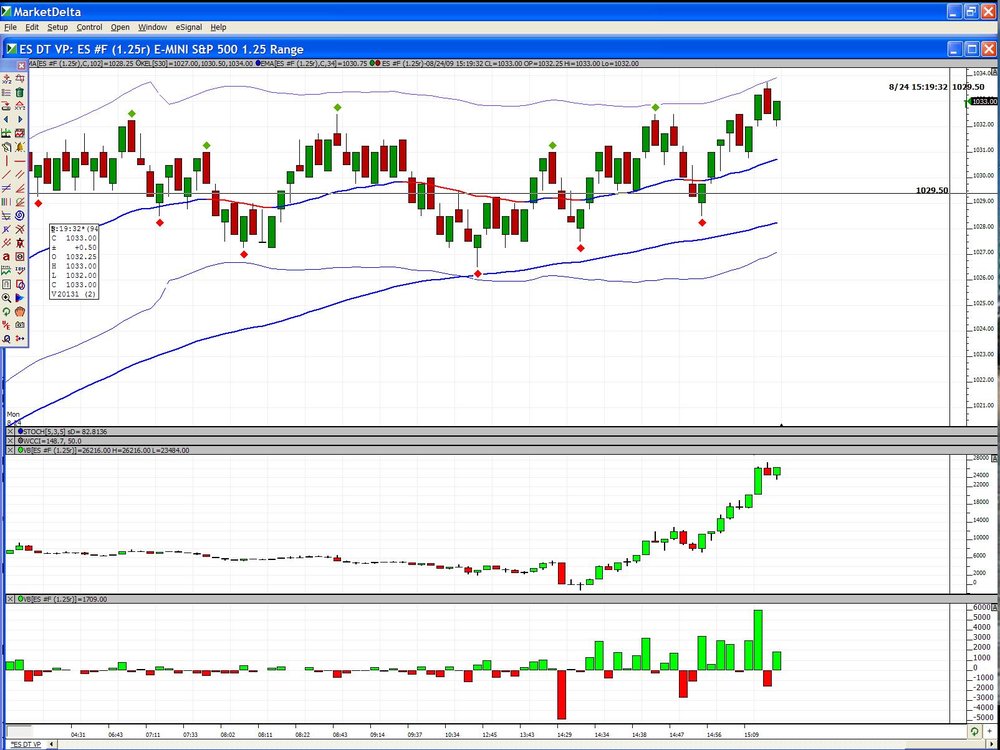
I trade of range bars, say 5 ticks:
I've attached what it looks like on market delta.
The bottom pane is the raw data: Upticks minus downticks,
second from bottom is the cumulative total of the value of each bar's uptick-downtick volume.
I hope I was clear.
Thanks
-
I wrote a little easylanguage study to track volume:
Vars: MyVol(0);
MyVol = Upticks-DownTicks;
Plot1(MyVol, "VB");
If MyVol > 0 Then setPlotcolor(1,GREEN);
If MyVol < 0 Then Setplotcolor(1,RED);
So far so good.
Now I would like to make it CUMULATIVE for the trading day, trading day be the day starting at the close of the previous RTH session.
Somehow I can't get my head to the next stage. Any ideas?
TIA
-
Is it really possible to use easylanguage with OEC? I just tried looking on their website but could not find any redference to it. Anyone got a link? I'm looking for easylanguage capability linked with charttrading.
TIA
-
RR, sadly the non U.S. exchanges don't provide the same transparency as the U.S. and I haven't found TRIN, TICK etc for UK or German markets. Having said that, you could construct your own advance decline fairly easily if you use a charting package such as Multicharts that hs the ability to gather and massage the info.
Finally, you may do what some people do - during RTH, use the tick and trin from the U.S. to trade the ESTX50. not perfect but you may want to give it a look.
-
You don't have to re-invent the wheel. This was done a few years ago and I think you'll find it on the old woodiescciclub.com site or their forum. It allowed you to choose over what number of bars you want to define the angle and the degrees of the angle for alerts etc was also chooseable (if there is such a word).
-
many thanks Tams. i guess I was thinking too complicated.
-
I use MultiCharts.
I need to create a trigger from a change in direction of a MA line. I use an expression such as:
If MA > MA[1] and if High crosses above MA then BUYthis bar at close
but that is a condition. How can I make it so that
If MA changes direction from down to up BUY this bar at close;
TIA
-
I have some code that places text onto my MultiCharts screen as signals. I want to make the text BOLD. I looked in the TS EL books and there seems to be every text command except that one. Anyone have a clue?
TIA
-
Interesting idea. Let's make a decision based upon the opinion of a group of people of whom probably 90% are using those tools to lose money.
-
Issue I had with AMP was there is no one in the office until just before the US markets open. Is that still the case? DAX position and no one in the office was scary. Otherwise great service.

Looking for ESignal Programmer
in Coding Forum
Posted
I'm looking for an eSignal programmer with experience creating automated strategies as well as knowing C#.