
Welcome to the new Traders Laboratory! Please bear with us as we finish the migration over the next few days. If you find any issues, want to leave feedback, get in touch with us, or offer suggestions please post to the Support forum here.


SunTrader
-
Content Count
1015 -
Joined
-
Last visited
Posts posted by SunTrader
-
-
Gold remains bullish. It has been bullish for years.Such a comedian. :haha:
Yeah its still above the price it was FOUR YEARS AGO.
But bullish while in a bear trend of lower lows and lower highs - no such thing.
Keep hoping and wishing and holding your breath.
Though I think might be better if you looked at a chart every once and awhile before posting any more bullish nonsense.
-
Sometimes the obvious happens. Mostly not.
-
I wouldn't call a $20 or even a $40 drop fierce.
$50 or $100 is more like fierce price movement.
And if then price gets down to previous double bottom at $1180 something very fierce might happen.
-
.. seven see prices down ...
Looks like they were the only ones with their thinking caps on.
-
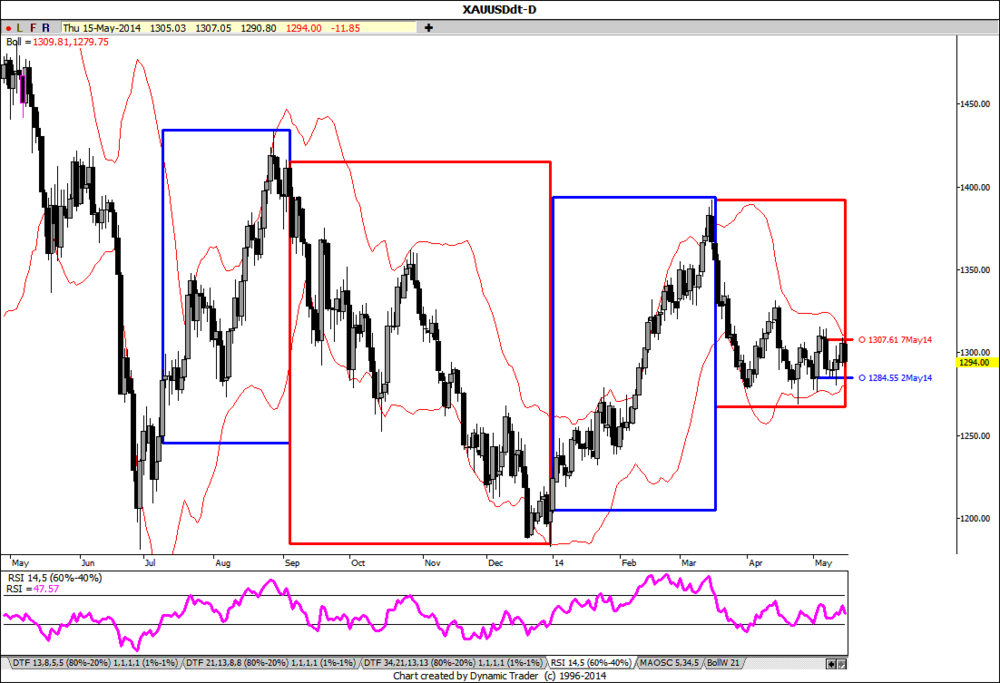
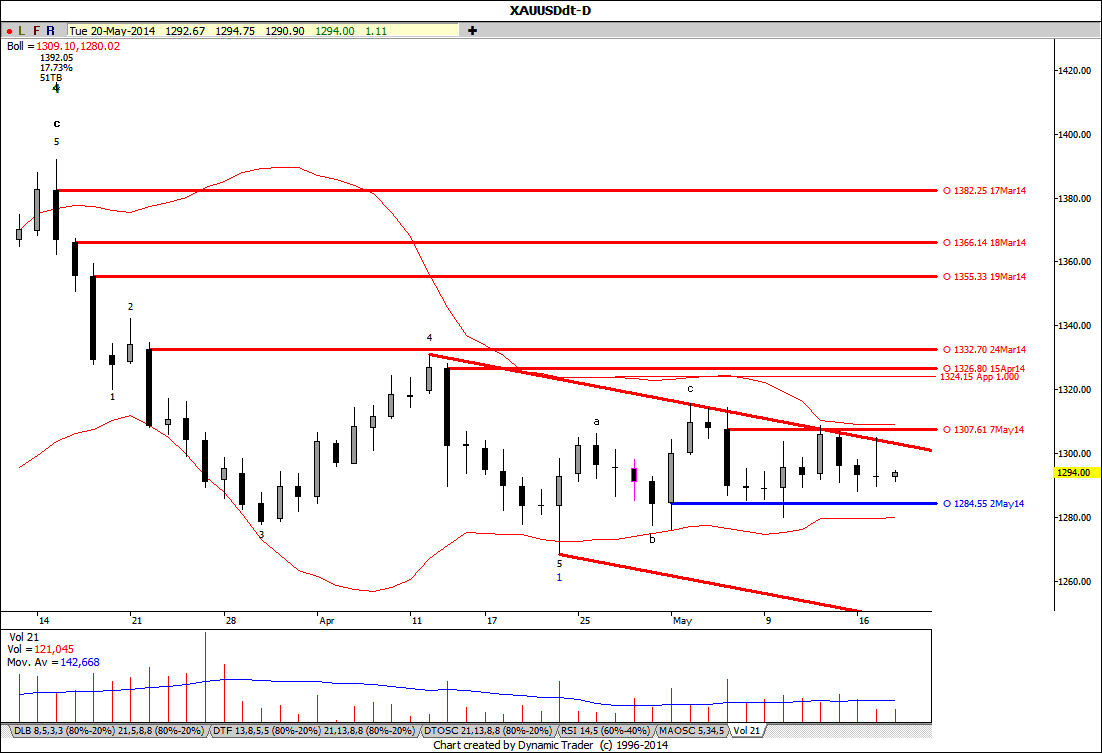
More buying was present at 1275 level on May 2nd than next swing low May 12th so it could weaken next time price hits it a 3rd time???
But support I see starts at 1285 (1284.55) and resistance at 1308 (1307.61) :

-
you don't think USA bubble is about to burst too do you? or maybe you think USA is not in a bubble?Anything is possible but no I do not think the U.S. is in a bubble at the moment.
Many American waist line are at bubble stage though.
-
just buy the physical metals...no worry about leverage...im right ...not wrong..time will prove me out within 5 years probally within 2.Broken clocks are also right twice a day.
You got to understand that when something is so obvious it is obviously wrong.
The stimulus hasn't created inflation. Here, in Europe, in Japan and everywhere else.
And the world has gotten better and better at living with uncertainties.
At some point, who really knows when, gold will have a bull market again.
Until then I will continue to trade it, whichever direction it goes.
In the meantime I have better uses for my money than buying it.
-
LOL...so he was off a year or two...in the macro scheme of things that is not much...soon...things will flip....then we will have some fun with you.....you will see:rofl::rofl::rofl:And when it does flip I will be long but the great Gary whatshisname will still be wrong.
BTW I admire your persistence in being continuously wrong as well.
You must have a bottomless trading account balance.
-
Well one year almost gone without a doubling.
Ahhh make that without much movement up or down.
-
China is no longer a bubble expanding.
Only the clueless don't realize it's a bubble which has now burst.
-
Almost a year later - no stock market crash AND no gold bull market.
And I still think Gary who??????????
-
Sounds good! On a daily chart what position would you take on gold?You ask this but then say to someone else price is above a 89 sma on monthly chart so market is bullish.
Why should that matter?
If that isn't good enough move out to a quarterly, or a yearly or a decade and then you could always make the sma longer ... and longer again. :doh:
BTW also why 89 anyway, on a monthly basis this equates to 7.42 years.
89 on a daily chart it at least equates to around 1/3 of a year.
Nonetheless maybe the attached chart might make clear what the actual present, tradable trend is. Note I only use RSI indicator to help identify trend. In uptrend RSI should stay above 40, in downtrend RSI should stay below 60.
-
I'm not Bullish.
I'm not Bearish.
I'm price-ish!
-
Ok.
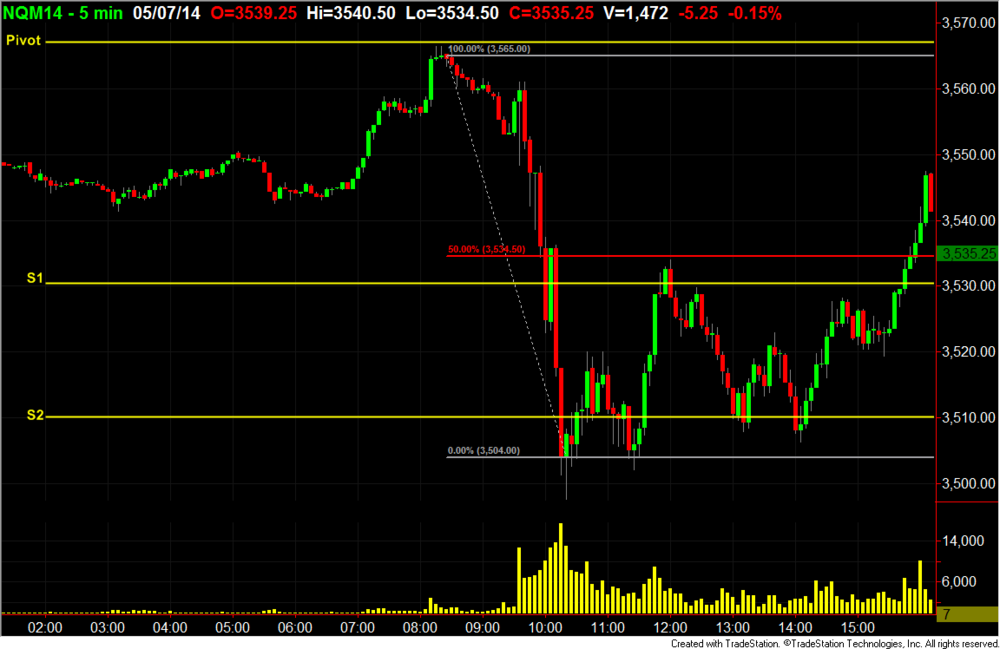
15 minute bar at noon was a pinbar too if that means anything.
Opened and closed just below 3530
-
If hinge at 30 is 3534 reversal high at 12 noon than it looks to me it reversed after making 50% retracement. Note on my chart I truncate levels if price trades in same area for consecutive bars like the top 4 bars from 8:10-8:30am, and also the bottom with the long wicks at 10:15-10:20am.
-
Gold set for weekly drop on funds selling ahead of U.S. data (Fri May 2, 2014)... by 1006 GMT, ranging in the narrowest trade for four months. It was down about 1.4 percent for the week.
...
Then later in the day proceeded to close basically unchanged for the week on one of the widest range days of the year.
Timing is everything - and with the news most times it is not new news but old news.
-
Went back randomly (clicked page 24 - 1st post on top) and found this from last August.
"PS GOLD IS BULLISH AND THE ES IS THE MOST BEARISH IT HAS BEEN THIS YEAR"
:doh:
-
Weekly chart shows still got one more wave down to go:
-
-
Gold prices are restricted by $1330 - $1335 resistance zone while Silver seems capped by 20.60 level for the near term.Agree if Gold reaches but in the meantime Thursday/Friday's double top 1324 is current resistance which I think will hold as daily ranges and volumes have been shrinking.
Meantime Silver, which is a proxy for the health of the world economy has been stuck in a tight range for two weeks now, held down by BRN of $20 with only a couple of spikes above it, and looking ready to roll over.
-
Fibonacci retracement levels have been around for quite some time, but accurate are they? Do you think they are valid levels because they simply work from a mathematical standpoint or are they accurate because the vast amount of traders that base their trades as well as analysis on them?Neither. They are accurate, some of the time, when other factors are in sync.
Such as time and cycles (both price and time) , OB or OS conditions, momentum and patterns.
-
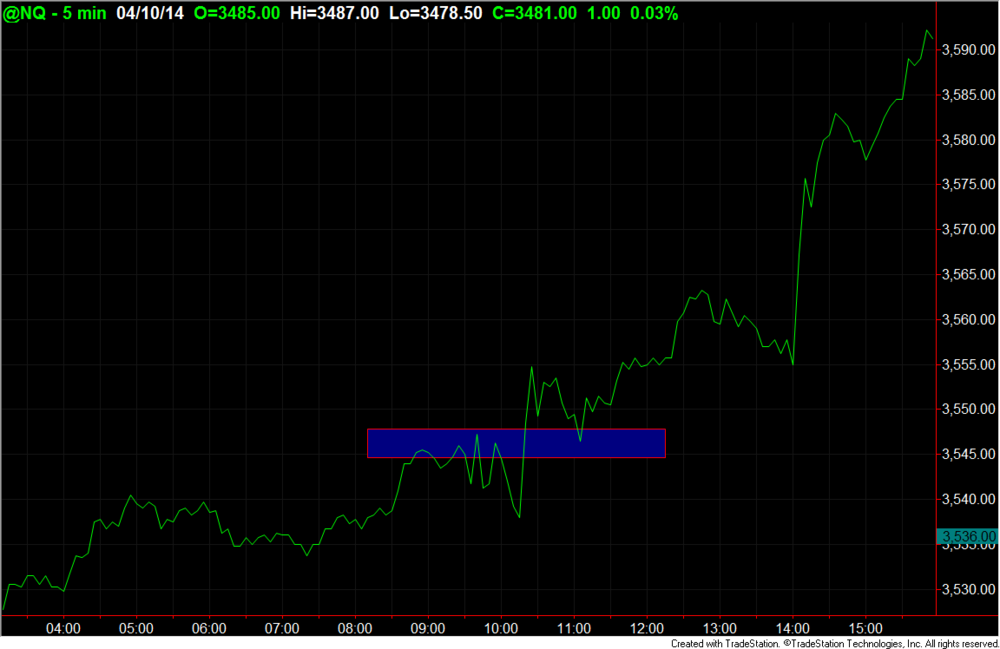
I very rarely trade NQ so this is all 20/20 hindsight but another explanation why price didn't go lower might become clear looking at this closing price 5min line chart:
-
First of all, thanks for participating. What I meant was that the fact why the market (NQ) did not go anywhere today could be explained via fear.I mean, those who are betting on price to fall (bears) did not commit (sold) more and did not drive prices down. The question is then, why, what were they afraid of. They might be waiting for FOMC and they are not going to commit their funds until they have that information or afraid of something else, I am not sure what it was therefore the post.
In the other hand, those who are betting on price to rise (bulls) did not commit either, at least until 11:00, what are they afraid of, why dont they commit and join the party.
At 10:15 one can see a strong move to the upside when prices reach 35, what was that, why shorts just covered so fast, why buyers rushed in and paid the ask. What were they afraid of.
That is what the post is about.
The bears did try to take price down. Operative words did try.
If there were more of them or just more size behind those selling they would have succeeded. Since they didn't bulls took it as a sign of weakness or just plain bought more than the bears could sell into. Supply/demand 101.
10:15am did not take out previous swing low which was still 7 points higher than the previous close.
-
It's fantastic if you are a permabull or fond of wearing tinfoil hats maybe.
For instance: "Almost every week it is possible to illustrate the appearance of a large number of contracts shorting gold at times of day when trading is thin."
Ok well then illustrate it.
Showing charts and price movement around fed announcements times shows .....price movement around fed announcement times. All markets move then, so?
Price isn't going the way they think it should. It never does. It goes the way supply and demand says it should. And right now there isn't the demand to make it go higher. Plain and simple. But they would rather have someone to blame for their incorrect analysis.
Brilliant!


Gold Bullish or Bearish
in Market News & Analysis
Posted
Isn't it "wait till next year"?
Or 2016 or ....