
Welcome to the new Traders Laboratory! Please bear with us as we finish the migration over the next few days. If you find any issues, want to leave feedback, get in touch with us, or offer suggestions please post to the Support forum here.

suriNotes
-
Content Count
166 -
Joined
-
Last visited
-
Days Won
1
Posts posted by suriNotes
-
-
Hi Taq,
Yes, it is a Inverse Dragon setup. Thanks for posting 240m chart.
No need to have 5% minimum for the Dragon legs. Dragon setup
is one of the variation of Double Tops/Bottoms. Very rarely
DT and DB's have perfect bottoms/tops.
Here is another take on the same @ZG 240m chart. It is
Trader Vic's 2B Top (Irregular Top/Bottom) with
Entry/Stop/Targets.
Regards,
Suri
-
Here are two charts of Gold...
1. Inv. H&S Chart (LT?) with Bullish ABC & Targets (from Jun. 5th)
2. Current ABC Bearish Pattern with Price/Time Cycle
Regards,
Suri
-
Some of the other charts during WW setup (H&S, ABC Bearish calls) for above @ES 610T
Regards,
Suri
-
@ES (610T) Wolfe Wave on June 11th...
regards,
Suri

-
Excellent Article on Fear by Price Headley..
Regards,
Suri
-
Pappo is correct with his assessment of Pattern logic and coding/testing patterns.
In my experience, patterns do have excellent reliability with great repeatable logic.
Many successful traders have implemented patterns/code logic to take advantage of them.
Most pattern success or failure depends on knowing the pattern logic with market
context and knowing how/where they are forming. Without market context logic,
testing patterns is a futile exercise. Programmers tend to miss this logic when testing
patterns. Also, individual mastering of patterns requires thorough market knowledge
and experience and mastery may be limited to just few patterns. Coding patterns may be
more difficult for even most seasoned programmers too.
Excellent trading ideas are discarded due to poor coding and poor back-testing methods.
I have seen this many times in my career as many brilliant programmers with great ideas
but with little or no trading knowledge discard their concepts as not profitable due to
novice back-testing methods/results. Also, each trading platform have various trade
execution logic and hence many Automated Trading Systems back/forward testing results
suffer from wrong/poor execution methods.
Here is an example of a recent Bloomberg Article where TA was slandered.
"Stock Charts Fail Forecast Test in Complete S&P Miss (Update3)" by Michael Tsang and Eric Martin
Stock Charts Fail Forecast Test in Complete S&P Miss (Update3) - Bloomberg.com
Tsang and Martin (journalists) with little TA and no real trading/investing/programming
experience published an article and slandered the TA and indicators due to their wrong
back-testing results... Bloomberg published the article as it was written by their journalists.
Many TA experts (Murphy, McClellen et. al.) have written their concern to Bloomberg.
The editors at Bloomberg have softly admitted but sadly it was never removed.
Regards,
Suri
-
SENSEX Chart Update..
Regards,
Suri
-
Hi ephi144,
Yes, you can build tools based on Tick Counts...
The count itself can be obtained by UpTicks & DownTicks.
Here is an article I discussed some Intrabar Execution tools
using Time & Tick Counts etc. (Stocks and Commodities Magazine, July 2008)
Regards,
Suri
For tradestation:is there a way to create an indicator based on tick count?
i would like to create and indicator based on tick counts so that
there are 3 MAs being drawn on a chart but they are based on tickcounts.
-
Other over-lay tools (graphics tools) I use
to measure Screen Angles, distances, pixels etc..
MB-RULER: MB-Ruler - the triangular screen ruler
Screen Ruler:A Screen Ruler
Regards,
Suri
-
Here is my version of BarNumber Scale ELD posted on TS Forums (from 2005)
https://www.tradestation.com/Discussions/Topic.aspx?Topic_ID=35089
Regards,
Suri
-
Hi Taz,
Thanks for your post...
I am not a big follower of Cycle theories, but
I noticed the symmetry of swings and thought
it was an interesting find....
JM Hurst talks about 40-period cycle (and others) to describe trends
in his book "The Profit Magic of Stock Transaction Timing"
and 1/2 cycle (20 period) lengths to find targets/patterns etc.
Regards,
Suri
Suri, what's the deal with 41 days? Looks interesting, but is there any rhyme or reason to a 41 day cycle?Tx, Taz
-
NSE NIFTY INDEX Chart
Regards,
Suri

-
ES 41-day Cycle chart...
Regards,
Suri
-
Here is SENSEX charts... Monthly and Daily charts.
Possible resistance soon??
Regards,
Suri
-
Hi taq,
Good work!! I do think your WW chart is correct.
I have access to EOD data for some stocks from India..
But do not have intraday data for BSE/NSE stocks
to plot in TS.
Your second chart also looks good. AB=CD pattern completion
may not mean automatic reversal...
It does require Price-Action (LLs) and some pivotal action
from 'D' level to signal a reversal.
Thanks for your posts.
Regards,
Suri
have a look at the chart is probable target zones are correct? -
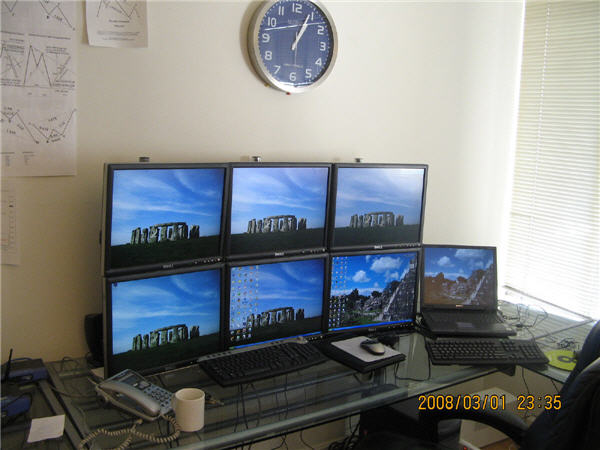
Trading PC:
Dell 20" (6) monitors... Dell 3.4 GHz, XPP, 4 GB, nVidia nvs400,TS
Data Server:
Dell 22" (2) Monitors.. Dell 3.2 Ghz, XPP, 2 GB, SQL, ColdFusion
Laptop
SONY Vaio.. 2.6 GHz, 1GB...
Regards,
Suri
-
Hi,
There is a simple trick (in TS) using Plot commands...
If you convert the number to a String, it will plot the value in
StatusLine like in this chart and it will NOT plot line on chart...
(Add Analysis Technique display from Format Window for StatusLine)
Pl. see the code below and the chart images.
Regards,
Suri
//ADX Modified
inputs: Length(14), ADXCriteria(20);
variables: ADXValue(0), adxColor(0);
//Begin ADX Code
ADXValue = ADX(Length);
if ADXValue < ADXCriteria then
adxColor = DARKGREEN
else adxColor=RED;
Plot1("ADX: "+ numtoStr(ADXValue,2),"ADXVal",adxColor);
-
Thanks Waveslider..
I'll check out WWs again.
Regards,
Suri
-
Great advice provided by others...
As Soultrader said, with your current situation, trading may NOT be
a great option. Scared money NEVER makes money in Trading.
Without proper mindset and preparation, imagine how devastated
you would be if you lose your capital in next few weeks to months
and how tough it would be to get back. Don't underestimate Failure...
Trading career is one of the few careers where success rate is very small
and could be elusive for a very long time. Trading career is also one of the
toughest as it demands you to be in your best of mind and body every
single day to succeed. There are other careers which are far better than
trading career and may offer better security and life. Very smart and
successful people (in other areas) are drawn to trading world, but few
realize quickly trading may not be their best bet and move on to other
rewarding ventures. Evaluate yourself first and see if trading really fits
you and your overall goal.
Take a year or two and learn the basics, build a plan, method or system
with some solid analysis... More importantly work on yourself, your goals
and how you will achieve them. No one mastered the markets without
mastering themselves first. Education plays a big role and psychology plays
even bigger role in your success. Write a journal (honest) of all of your
progress and see in a year or two if you do want to venture Trading. Start
slow and build confidence in yourself and your method/system first!!
Wish you the best!!
Regards,
Suri
-
Here is a better chart of @ES Symmetry...
Key Symmetry in this chart is XA and DT legs Symmetry (29 bars)
and 205 pts at Key Ratios (76%)
Regards,
Suri
-
than what would be the probable target for the same?Hi taq,
Thank you for your post...
Before I can answer your question of 'where is the probable target',
I will address if a Pattern is considered complete and if so, how to
compute the targets etc. Computing Targets is the easy part

From Scott Carney's Book(s): Harmonic Trading of the Financial Markets,
Harmonic levels in reversal zones define critical levels from where the
dominant trend may change. A Potential Reversal Zone (PRZ) is defined as
convergence of at least three or more Harmonic levels from the pattern.
Strong reversal price-action and formation of pivots supported with cycles
or Moving Averages etc. could signal completion of the pattern and
potential reversal in its major trend. (See the SENSEX chart with reversal rules...)
Also note, patterns also fail and prices reversed from the PRZs also fail to signal
the reversal of trends (some pattern failures are more powerful than patterns).
In the SENSEX chart (potential Bearish Crab) presented here, the PRZ
is defined as price reaching three or more critical harmonic ratios (of XA, AB, CD legs)
near a key MA (200 sma). So far the pattern did not indicate
any completion signals. Also no clear indications if the price
will reverse from PRZ (Lower-Lows, Pivoting action etc.) or
any key pivot is made from the PRZ.
Once a reversal is made, you can use Fib. Retracement tool
to compute the Targets. Potential Targets would be 0.38CD level
and 0.62CD to 0.786CD levels... If these target levels also
coinciding with prior SwingHigh/lows or MAs, they may act as
further support/resistance areas. Your risk of this short-trade
may be highest level of the Pivot (D) + few points.
So, from the current chart pattern, if pattern is complete and if price
reverses from current (11000) levels, the first target may be near
10070 level and second target may be 9300 levels.
Hope that answers your question.
Regards,
Suri
-
Bombay's SENSEX Bearish Crab pattern chart (near 200-SMA).
and ABC Bullish Pattern charts...
Regards,
Suri

-
Minoo,
Good Analysis...
Here is Symmetry chart of @ES.
Also see Rising Wedge pattern...
Regards,
Suri
-
Harmonic Patterns..
Regards,
Suri


Gold Chart!!
in Technical Analysis
Posted
Hi Taq,
Thank you for your post.
2B Targets are prior Swing Lows/Highs before the pattern
emerged and its distance ratios.
To my knowledge books from Scott Carney, Carolyn Borden,
Robert Miner, Larry Pesavento and Bryce Gilmore offered
timing analysis/projections theories. There may be others and
if I remember I will post again.
Regards,
Suri