Welcome to the new Traders Laboratory! Please bear with us as we finish the migration over the next few days. If you find any issues, want to leave feedback, get in touch with us, or offer suggestions please post to the Support forum here.
-
Content Count
166 -
Joined
-
Last visited
-
Days Won
1
Posts posted by suriNotes
-
-
Several years ago I read a book by Dr. Ned Gandevani "How To Become A Successful Trader: The Trading Personality Profile: Your Key to Maximizing Your Profit With Any System". In this book he addresses the problem of 'Why Can't You Pull The Trigger". I think it is important to figure out what type of trader you are and act accordingly. There is also a Trading Personality Profile test in the book, which identifies trader-types... He may have other services and books but I have only read the above book and recommended to others.
Regards,
Suri
PS: I do not know Dr. Gandevani and never corresponded with him or his business.
-
-
NIce one Suri,Can you see what it was in the pattern that made it work? What are your observations?
Hi Waveslider,
Thanks for your post/comments.
I am sure you already know I ONLY trade Patterns. I focus mainly from a broader perspective of looking if a Pattern is Reversal or Continuous first. I consider WolfeWave as a Reversal pattern. So, the rules for reversal patterns must fit into the pattern to confirm. As part of my reversal rules, I look for price-action within the pattern formation until it provides a trade-trigger or fails the pattern. This concept is part of my 'Market Context' analysis. I know every trader has (should have) their own theory of 'Market Context' in analyzing Patterns or Setups.
When I am analyzing Stocks I look for patterns mainly in Daily Charts (at EOD) and look the first hour and the last hour price-action and see where and how price opened and where and how price closed. This Open/Close price-action must confirm underlying Pattern form, size and direction for the pattern to succeed. Looking at Daily Open/Closes raises 'Gap' theory. I do not trade GAPS but I like the GAP formations inside the pattern I am analyzing to confirm the validity of the pattern and direction. So, in a nut-shell, I like to see GAP Ups in a Bullish Pattern and vice-versa in Bearish Patterns. As part of this GAP theory, in a bullish pattern, if a bearish gap (downside) forms, I like to see it fill the SAME DAY. This confirms underlying Bullish Pattern and vice-versa for Bearish patterns. Case in point is: Recent SPX action from Sep. 2010. Most down-gaps are closed by EOD as the underlying strength is Bullish.
Another commonly known theory of Bullish patterns is Prices must show Higher-Highs and Higher-Lows with price divergence in momentum based indicators (if any). Also, the inner patterns (Patterns within Patterns) and its price-action must be bullish. Here is an article I wrote on this topic ("Patterns within Patterns"), published Nov. 2010 in TRADERS' magazine.
http://www.surinotes.com/Tradestation/articles/SuriDuddella_PatternsWithinPatterns_Nov2010.pdf
Analysis of ISRG chart...
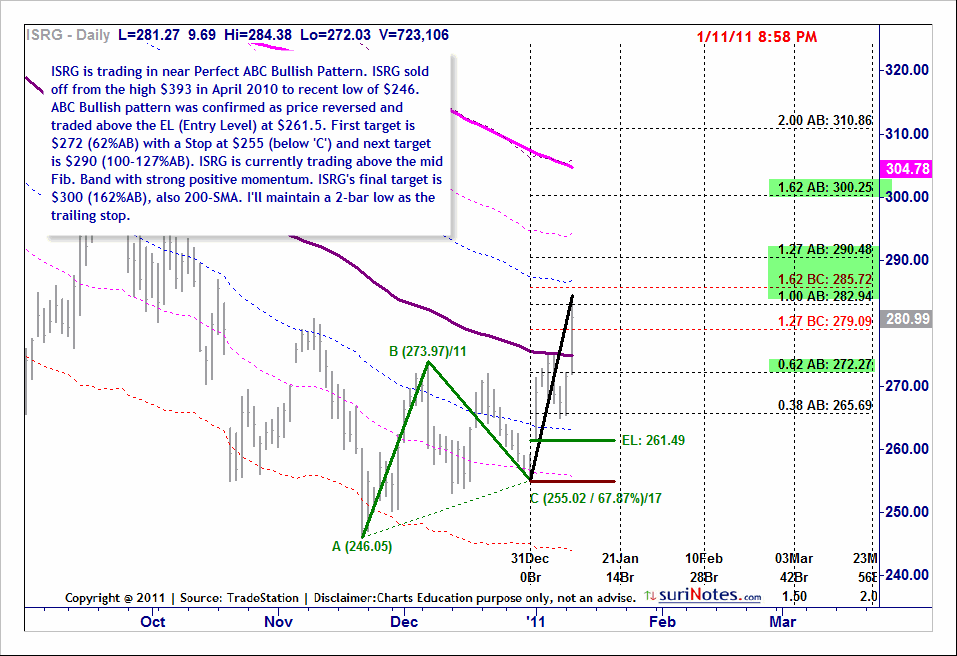
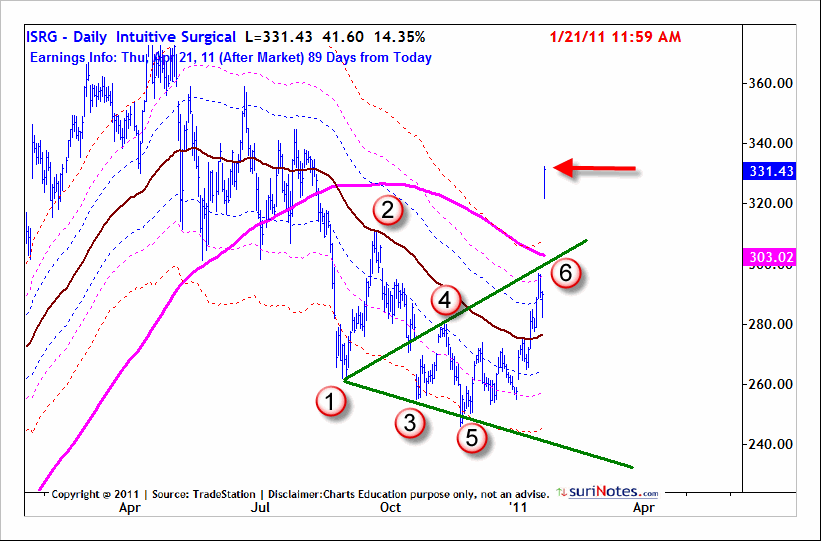
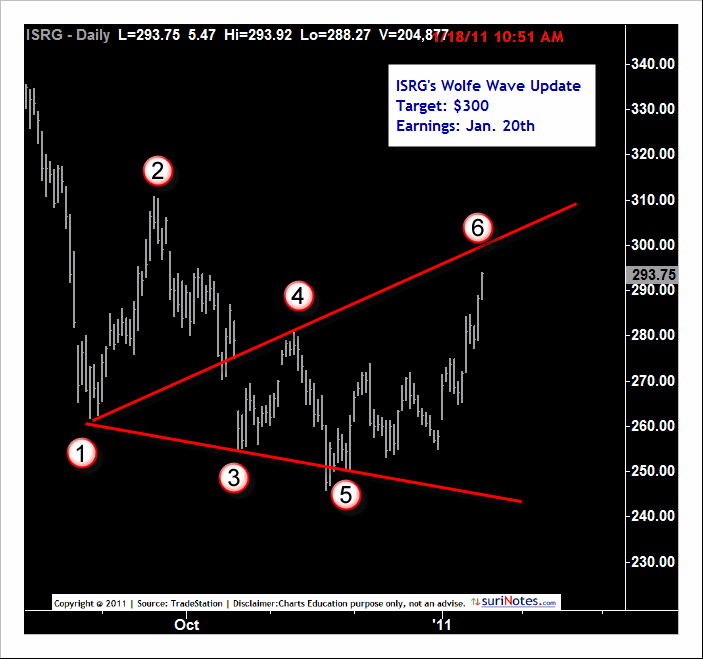
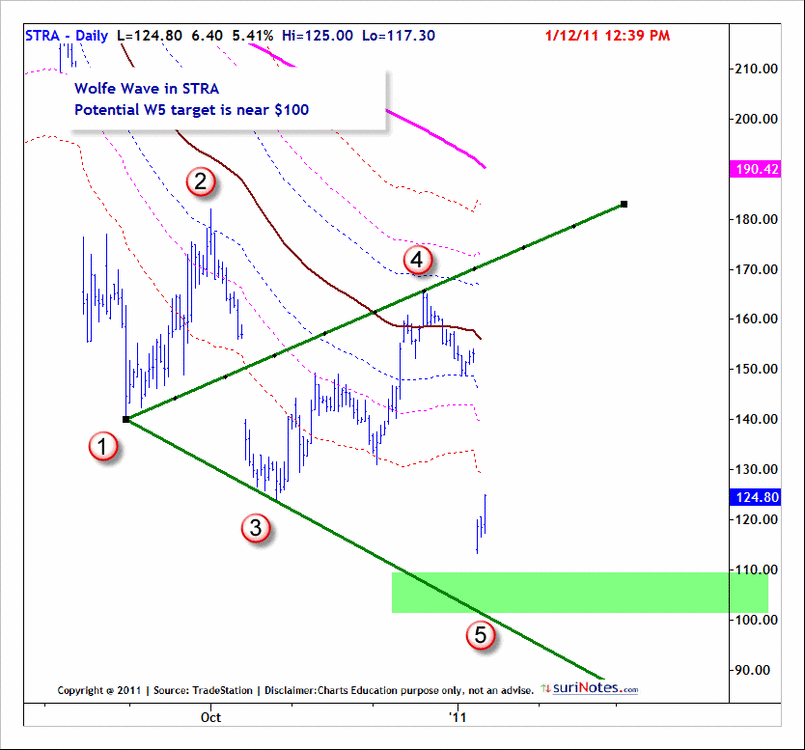
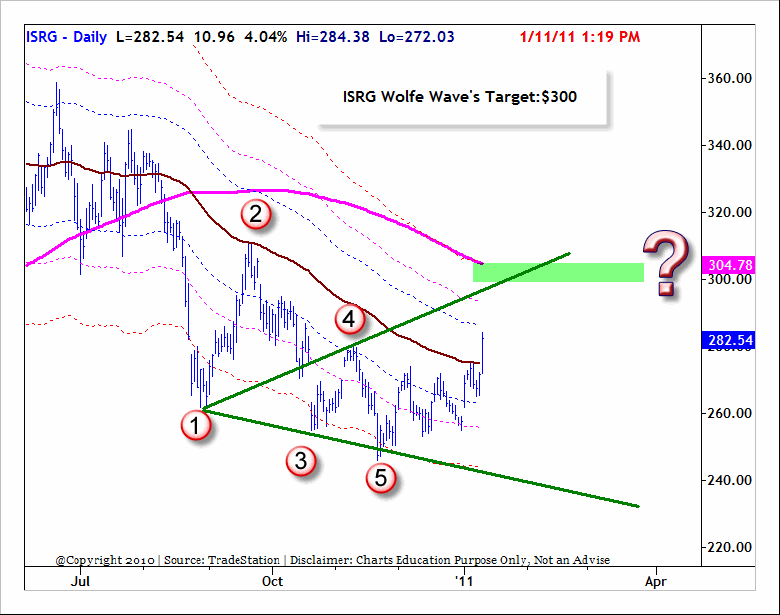
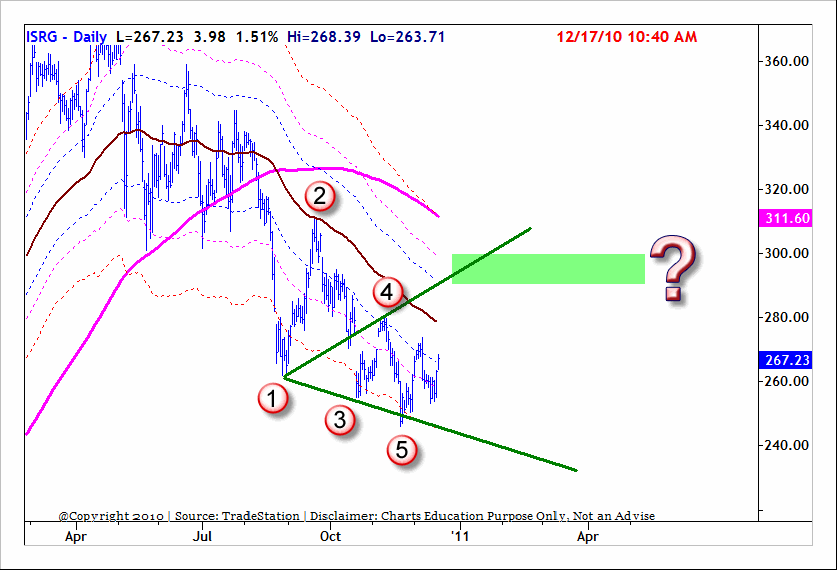
In the ISRG pattern, the Wolfe Wave pattern is NOT quite visible for me until Dec.10th or so, as ISRG made lower-lows in its previous failed attempts to signal a bottom. But once ISRG made a higher-low on Dec. 17th (around $240, my first post on TL about ISRG WW), I thought it has a potential of WW and now I am interested to watch its price action to confirm a Reversal for me to trade. So, I look for HHs and HLs in the trends and most bearish PA failed within the setup. And many days I watched ISRG's Daily and First Hour and Last Hour Price-Action for a clear sign to trigger a trade. At this time there was a near-perfect ABC Bullish price-action (see my Chart) indicating both Wolfe Wave and ABC Setup. Finally, the signal came on Jan. 03, as ISRG Gapped Up and posted a wide-range bar (almost a Breakout) with a Higher-Low at $269. At this point, there are two things certain... It is bottomed out and it has ABC Bullish pattern and Wolfe-Wave pattern with bullish Gap/and potential Breakout from the consolidation. This Gap provides a key support area (for STOPs). Most days after that price-action was clearly evident. Now, setting up targets was easy as UpperTrendline of WW (almost coinciding with 200-SMA) around $300 along with ABC's (162%AB) target: $300. The stops are trailed after entry. On Jan. 20th, ISRG announced great earnings (with their strong da Vinci Robot sales) and ISRG gapped open $40+ to complete WW as it traded at a high of $334 on Jan. 21st.
Regards,
Suri
ISRG analysis from Jan. 11, 2011.
-
-
-
-
-
JBahn,You may find your best path is ‘off the ranch’ in content not specifically for traders. PM me if you want suggestions. hth. All the best.
zdo
I have read many psychology/motivation books which are not directly related to trading and I think they are great...
Few books from my memory:
'Maxwell Maltz' books ...still have his book on Audio CDs.
Recently I read a book "Confidence: How Winning Streaks and Losing Streaks Begin and End" by Rosabeth Moss Kanter, which is excellent.
The Predictors: How a Band of Maverick Physicists Used Chaos Theory to Trade Their Way to a Fortune on Wall Street by Thomas Bass ... Fun read
When Genius Failed: The Rise and Fall of Long Term Capital Management by Roger Lowenstein
Who Moved My Cheese?: An Amazing Way to Deal with Change in Your Work and in Your Life by Spencer Johnson and Kenneth Blanchard.. Excellent book for every one.
Regards,
Suri
-
zdo has good book examples... I remember reading few books from that list.
Few years ago, I liked this book "How to Become A Successful Trader" by Dr. Ned Gandevani. He profiles trader types using some tests.. I recommended this book to few of my friends... some hated it and some liked it. I liked it and thought it had practical ideas. I also know Dr. Gandevani has new books but I have not read them.
Regards,
Suri
-
I'm a beginner and wanted to start with a 5k account and I was interested in getting info. on which stocks are good for day trading with a 5k account plus 5k margin = 10kI'm trying to stay away from penny stocks and was looking for a stock that has high volume, high daily price action and not too expensive..
I am trying to learn things now, by using a virtual trading platform and some a little shared knowledge from more experienced and successful traders would be welcomed.
Hi,
Sorry to disappoint you but 5K is very small amount to DayTrade Stocks. You do need at least initial capital of $25K to get 4x margin and avoid the Pattern Day Trader Status.
I do NOT daytrade Stocks as it is not worth the reward/risk ratios it offers for the effort (for me). I like SwingTrading Stocks and think there is much more money to be made in Swing Trading Stocks using 1-5 days or more holding periods or through Options. I DO daytrade Emini Futures and think it is NOT worth SwingTrading Futures for the risk it involves.
But when I did daytrade Stocks few years ago, I traded stocks which are liquid stocks (at least 1M shares of 10-day Avg. Volume), have good range (Stocks which moved at least $1 avg. 21-day range) and high-beta stocks (min. 1. or 1.5).
Do your daily research and make a small list of stocks to trade. Trade stocks based on Patterns/Setups and avoid Event Based Stocks (Earnings, Upgrades/DownGrades, News, Rumors, Gaps, Tips etc.). Also, you have to know the list of stocks, setups with their Entries/Exits you going to trade/watch before the Opening Bell...
Here is the Scan in TradeStation with the above criteria from NASDAQ stocks >$10.
Good luck and Happy Holidays!!!
Regards,
Suri
-
HelloI am looking for some books on psychology and was hoping for some suggestions.
I was a hedge fund trader for 3 years and just recently began trading my own account. Although I am profitable I run into a lot of head wind when it comes to my though processes during the day. Among my major problems are adjusting my stops after the fact and cutting winners way too early. These are problems that are just beginning to manifesting since I find trading my personal money a much more difficult game than trading OPM. Fear and Greed in a trader...imagine that:-)
Anyways, I just finished Mark Douglas' "Trading in the Zone". I think the book did a good job at helping me realize the basis of some of my problems, however I found the book a bit long-winded and lacking in content when it comes to actually dealing with my problems.
I am hoping to get some suggestions for other books you may have read that have helped you.
Thanks in advance
Cheers - Brian
I like Dr. Ari Kiev's books. They are more practical and offer great insight into the traders Psychology. I also like Rooth Barrons Roosvelt and Dr. Steenbarger books and his Blog.
Regards,
Suri
-
-
Have you tried to trade these?I have. My experience was neutral. I made some money and lost some money. I traded them mainly in a small currency account. I didn't find them to be profitable so I stopped.
I forgot the guy's name who was nice enough to code the patterns in MT4 (something with a Z). The indicator was really nice, but It wasn't adding anything over time.
It could have been me too. I am not one to blindly allow a trade to stay on simply because its a pattern that sometimes works.
Regards,
MM
*** This is a response I posted to a user in another forum to a similar question **
Hi MM,
Thanks for your question.
I have been trading X5-Harmonic Patterns (ABCs, Gartleys..) and other Geometric Patterns (Triangles, Rect. Channels etc..) all my trading career of 15+ yrs. Complex patterns like Harmonic Patterns are difficult to detect with naked eye (at least the proper ones which follow their rules) and even more difficult to code/backtest. Building rules to trade patterns successfully is another challenge.
The reliability of any pattern or indicator is subject to it's structure, market phase, type of filters applied and user's experience... I would rate Harmonic Patterns as the 50-60% reliable overall but with the right market context (filters, phases), I would think their reliability increases to 70-75%. There are other patterns which may be little more reliable than X5 patterns, but Harmonic patterns are my bread-butter setups. Also note there are NO perfect patterns and all patterns fail. I have built my own theory of Market Context and other supporting tools with filtering mechanisms to trade them when opportunities present. Harmonic patterns are also part of many other patterns like simple H&S, DB/DT, Triangles and Complex patterns like Wolfe Waves and Elliott Waves.
Harmonic patterns appear in all instruments and in all time-frames. This is at least my nth generation algorithm (wrote from scratch each time) I am attempting to write X5 (all Gartley variations) patterns in the last 5-6 years. I think this time I may have the best algorithm. Once I complete I will attempt to write more filter logic. I wrote Auto ABC Pattern detection few years ago and currently I use it for my trading (intraday and EOD). The key is to detect these patterns with absolutely no-delays. Now I have achieved that with both ABC and X5 Harmonic algorithms. They also generate auto Entry, Stop and Target levels for each setup.
Hope I answered your question.
HAPPY HOLIDAYS!!!
Regards,
Suri
-
-
In Wolfe wave, there are NO requirements of P3, and P5 smaller than P1 in a bearish wave. As a matter of fact, often times, P5 will 'overshoot' higher than P3, making the 'short' even sweeter going from P5 to Target. And there's no such term called SwingPoint in Wolfe wave, at least not from Bill.It's evident from Bill's website that the true Wolfe wave technique is VERY different from what you see from the Internet. From my personal experience, taking class from Bill is the best investment I've made. Lots of hard work from your own, of course, in order to master the technique. Real charts are rarely text book style, being able to spot one in real time, be it 5 min, days or months, is the real challenge. Plus the external 'Uncle Ben' factor make analysis very difficult.
Hi nandv,
Thanks for your response.
Seems like you have good knowledge of Wolfe Waves and I am trying to clarify what I read and what I know. I have also not taken Bill Wolfe's course/class so I cannot compare what Bill Wolfe says and what others say. But I am sure you agree that every pattern must have clear *RULES* on how to identify and how to trade. From 'StreetSmarts' book (Larry Connors and Linda Raschke), the rules clearly say multiple times in Chapter 15 titled WOLFEWAVES that P3 must be Lower than P1 and P5 must form on/below the Trendline connecting P1 and P3 (vice-versa for bullish/bearish), suggesting P5 is at least at the same level as P3 or Lower than P3. My research on Wolfe Wave says P1 cannot be arbitrary, it must be at least a minor (minimum strength of 2) SwingHigh or SwingLow. Also, P1 to P2 must have symmetry with P3 to P4 both in Price and Time. I do agree with the rules from Larry Connors/Linda Raschke's book as they clearly define proper channels and action/reaction lines to trade.
As you say the rules from Bill Wolfe are different from rules published else-where, please educate me on his rules to identify the WW pattern.
Regards,
Suri
-
Hi nandv,
I am no expert in Wolfe Waves. I am trying to understand your charts on posts #593 and #594. Doesn't P3 and P5 should be lower than P1? Also P1 should be at least a minor SwingPoint? Both charts in posts #593 and #594 show P3 > P1 and P1 is not a SwingPoint.
Pl. explain.
Regards,
Suri
-
TradeStation 9.0 provides Workbook access to write and read from MS Excel. No additional DLLs needed.
Look for What's new on TradeStation 9.0 and some tutorial videos about Excel integration.
Regards,
Suri
-
Every year I attend TradersExpo in Las Vegas and New York cities. But this year I could not attend TradersExpo in Las Vegas as I was attending/presenting at the World of Trading 2010 conference in Frankfurt, Germany (from Nov. 16-20). They had same dates as TradersExpo (Nov. 18-20) at Las Vegas. I presented two seminars (100m) and four small presentations (20m) for TradeStation Group at WOT 2010. WOT was excellent. My trip and seminars were sponsored by TradeStation and TRADERS' media GmbH.
Here is the list of Speakers/Topics at WOT 2010:
http://www.wot-messe.de/seminare/index
I think WOT 2010 was well attended and well organized. Only three US companies (that I know of) were present at the WOT (TradeStation, FXCM and VectorVest) and about 40-50 companies from Europe participated. Most of the European companies at the show were FX related and few European banks/investment houses. I tried to attend few seminars but most of them are in German and I do not know any German. But from the looks of it some of them were well received.
My purpose of visiting the TradersExpos is to meet speakers, friends, acquaintances and network with traders/vendors. Expos do offer great education of new products (Hardware/Software), current trends and to keep me abreast of new market concepts and new trading enviroments. Of course cities like New York or Las Vegas offer great outlets for fun/relaxation and act as short and quick get-aways.
After my Germany trip, my wife and I went to Las Vegas on a small vacation (Nov. 23-28) to celebrate our wedding anniversary. On this trip we stayed at the Venetian Resort. Few restaurants we dined: Carnevino (Italian, Mario Batali's), Red 8 (Chinese), Zine (Asian), Wazuzu (Chinese) and Dos Camino (Tex-Mex). Few clubs visited: Lavo, XS and Tao. All restaurants/clubs in Venetian and Wynn resorts. We saw few shows: Le Reve at Wynn, Criss Angels' Believe at Luxor and Zumanity (Cirque du Soleil) at NewYork NewYork. We also took a half a day trip to the Hoover Dam. My favorite restaurant on this trip: Red 8 and favorite Show: Believe. We did NYNY's roller coaster ride and my wife went to Stratosphere's Big Shot ride (vertical drop). The best part of the Vegas trip: We gambled very little and enjoyed the relaxation/shows/food.
Regards,
Suri
-
-
Very nice collection of colorful butterflies.Is there any pracical use for them appart from the artistic value?
Gabe
Hi Gabe,
Thanks for your comments.
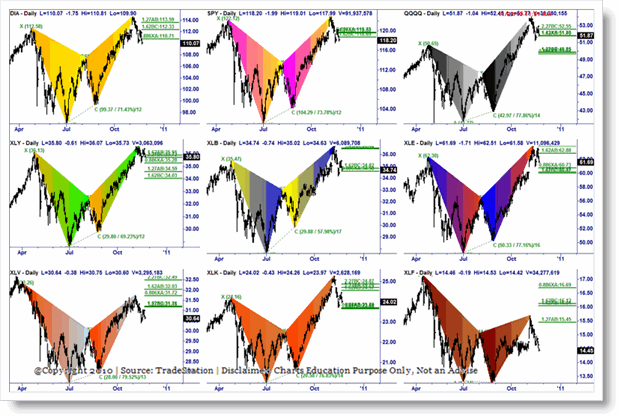
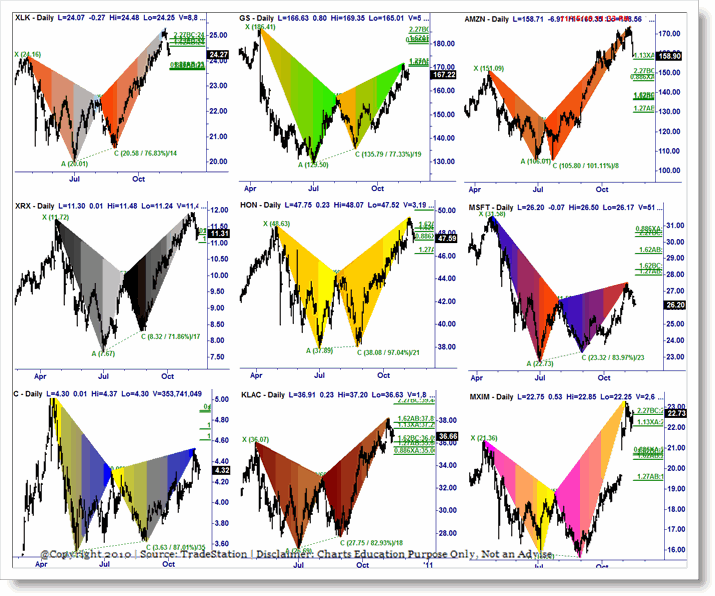
Butterflies are part of Harmonic Patterns. When point 'D' (current) is traded in the key reversal zone (see the right side of each chart showing Potential Reversal Price Clusters), it signals close the longs or sell short. Butterflies (all X5 patterns) also have ABC patterns embedded. So, I trade both CD (long setup:bullish) and Shorts from D levels when other market context agrees... The other Harmonic Patterns are Gartley, Crab, and Bat setups. If you are not familiar with the Harmonic Patterns, search for Scott Carney and his work (I think his work is the most brilliant !!).
I posted the collage to show the phenomena exhibiting the confluence of Butterflies in Tech and Financial stocks. Yes, Butterflies are Colorful...
Regards,
Suri
-
-
Thanks Sir,If possible an example would be appreciated.
Here What I understand from differnet readings & your points.Correct me if I am wrong.
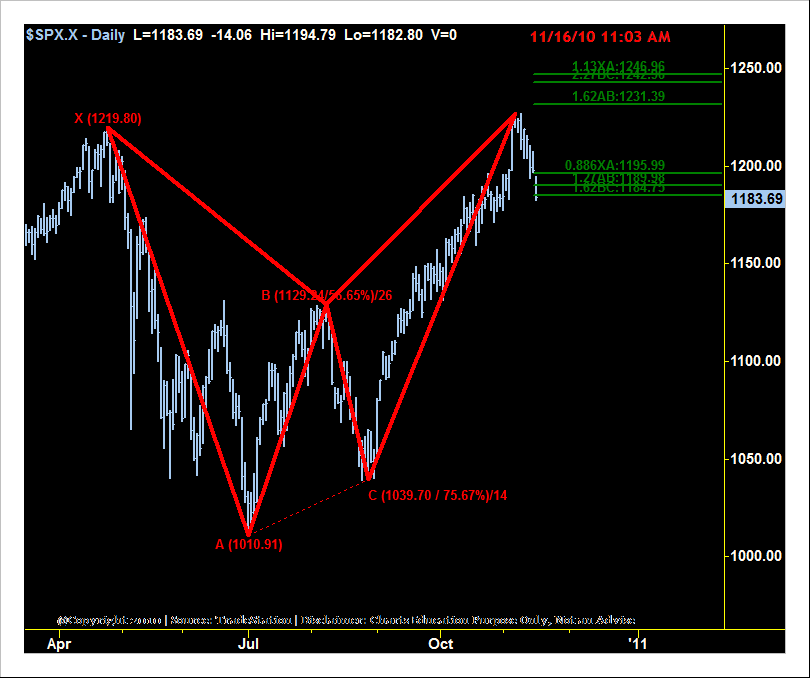
For 5-point structure XABCD, X & A has to be major Swing High/Low & B & C intermediate SH/SL , Point D can be intermediate SH/SL (in gartley & bat) or Major SH/SL (in butterfly or crab).
Regards,
TAQ
Hi TAQ,
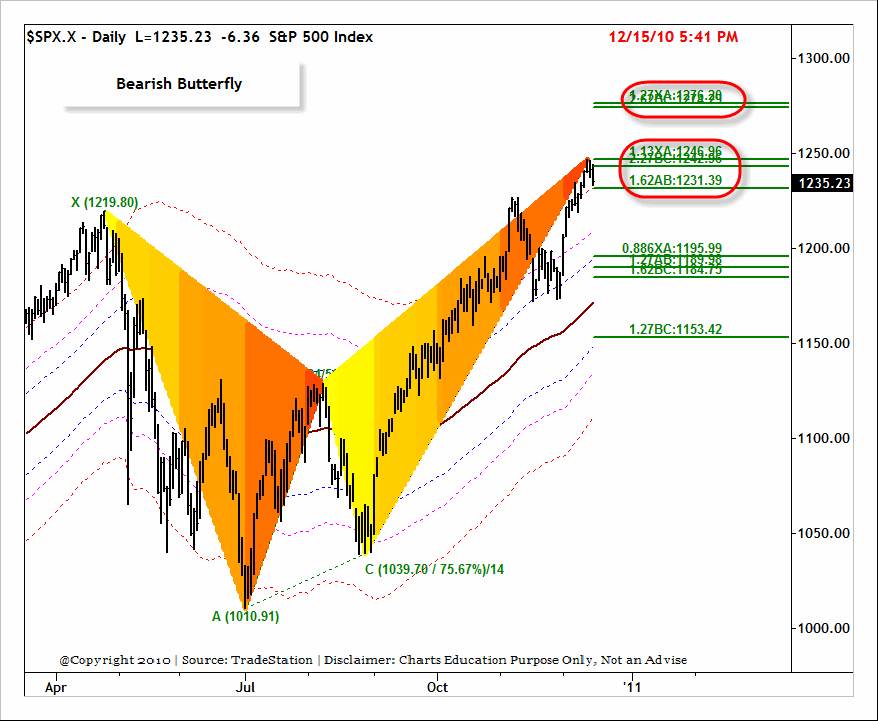
Here is the SPX chart with X5 marked.
Regards,
Suri
-
Hi Taq,
Thanks for your post.
You can't have a Major SwingHigh Pivot followed by another Major SwingHigh Pivot without having a Major SwingLow Pivot between them. All the Pivots between Major SwingHigh Pivot and Major SwingLow Pivots are considered Intermediate Pivots.
Regards,
Suri
-
Hello Suri Sir,Thanks for the charts .
I would like to know your view on this bearish butterfly?? Can we consider it a valid one, price made a double top here but still PA is not strong enough in this PRZ.
[if you don't mind I am using your chart to make my point ]
I am also adding one more chart with andrew's median line.
Let us see how it will unfold.
Regards,
TAQ
Hi TAQ,
Thanks for your post and re-drawing Bearish Butterfly pattern.
I like your Pitchfork/Median Line drawing too.
Yes, only the short-term trend is signaling potential trend-reversal but both Intermediate and Long
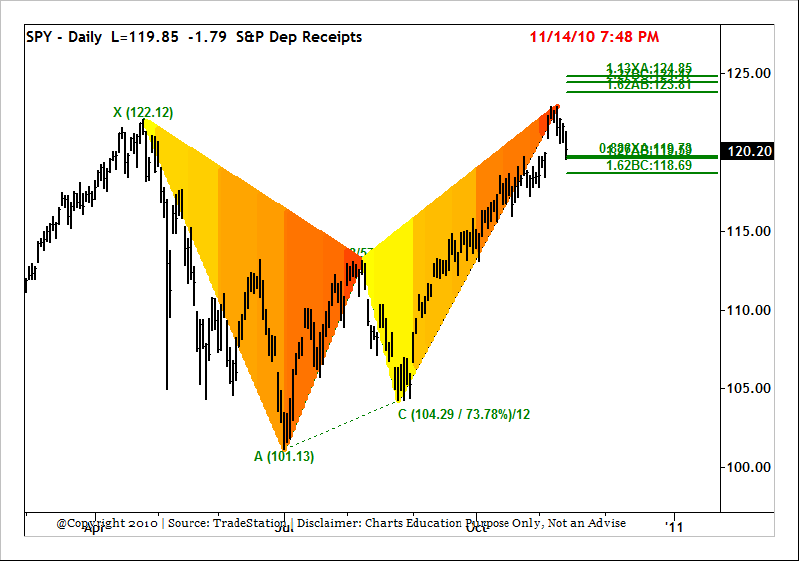
term trends are intact (bullish). Even the short-term trend is not confirmed. For me, if SPX closes below 1183, I would think short-term is reversed to bearish and probably look for shorting or close longs. In SPY, I would look for price to close below 118.5 for trend reversal. My targets in SPX are still near next price cluster 1240-1250.
Regarding your drawing of Bearish Butterfly pattern, I would not fit ratios to draw the pattern. In my view, it is opposite as pattern must show the ratios. If the ratios agree within a defined range, then you conclude as a certain pattern. I never consider intermediate pivots (like your drawing of X pivot) to be a key level part of the Bearish Butterfly pattern.This is the reason I dislike some of the drawings in Wolfe-Wave as some traders draw from an intermediate pivot levels to connect and re-define as Wolfe Wave. But I am no expert in Wolfe Wave either. I always tell myself that there are NO perfect patterns which fit exact ratios in the markets.
Here is the SPY Chart.
Regards,
Suri



APPLE Target: 202$.
in Stocks
Posted
AAPL's Head and Shoulders pattern and its targets.
Regards,
Suri