
Welcome to the new Traders Laboratory! Please bear with us as we finish the migration over the next few days. If you find any issues, want to leave feedback, get in touch with us, or offer suggestions please post to the Support forum here.


3monkeys
-
Content Count
47 -
Joined
-
Last visited
Posts posted by 3monkeys
-
-
Tradestation has blocked that link because is illegal.Try the link now.
Mark Brown. If you are the author and copyright holder, why don't you go after elitetrader (threadid=131234) and jficquette who posted the code?
They are both well known
John Ficquette - San Diego, CA | Facebook
-
It's always disappointing to read comments like 3monkeys. Do you prefer we all vote based on a 30 second tv commercial? I'd much rather have candidates document their views. I'd be happy just to have every citizen read these questions. Did you do so? How would you vote?JHS - the elections don't work because we don't have a good choice. We are always forced to choose between a red and a blue poltician, one who has usually taken a truck load of money from special interest groups. I like the idea of having a citizen representative on the ballot who is not controlled by a party or in debt to special interest groups.TP
I happened to have read the entire questionnaire and the blog written by Tim Cox of Liberty Hill, Texas, the founder of GOOOH and I disagree with a lot of what he stands for, so it is with some consideration that I dismissed his idea behind GOOOH.
The GOOOH site is basically a pledging site for a third party and you join by paying and answering and pledging to the 100+ questions on how you will vote. These 100+ questions were hand picked by Tim Cox and no other inputs are possible. The plan is to have candidates be bound by the way they answered these 100+ questions and they should resign if they break their pledge to the way they answered these questions.
There is nothing wrong with supporting third party candidates. But somehow to suggest that GOOOH is something new and unique that requires special attention and reservation at the polls is ludicrous. To suggest that elections don't work because you can't get support for your third party candidate is kind of pathetic. If you can't make your case as a third party candidate and attract support, you don't deserve a place at the polls.
-
Right. Elections are too hard to participateI've come across a truly interesting site that I'd suggest you consider. It is called GOOOH (for Get Out Of Our House), and pronounced like the word go.They have an intriguing plan to evict the 435 politicians from the U.S. House of Representatives.
Here's the link: GOOOH | Get Out of Our House: A non-partisan political party!

Let's just all fill out a form on line.
... but wait, there is more...the GOOOH questionnaire must be 120 lines long. May be elections are not that hard to participate after all.

-
Please set up custom sessions by Quotemanager (MC 5.5 and above only). You can ask for and receive help if you are a registered MC user on the MC forum at tssupport.com.Hi guys,our indian market starts at 9.55Am and ends at 15.30 pm. when i open , say hourly chart in multicharts it shows barsfirst bar time is 10.55(9.55 to 10.55)
second bar time is 11.55(10.55 to 11.55)
and so on.....
But i want to get the first bar in 5 minutes and the next in hourly bars
i mean like the following.........
first bar 10.00 AM (9.55 to 10.00)
and the following bars one hour each 11,12,13....and so on...........
can anybody help me how to do that in Multicharts.

-
http://www.microsoft.com/security_essentials/
Microsoft on Tuesday introduced its long-awaited consumer security suite Microsoft Security Essentials, a free download that replaces the paid-for OneCare product.Microsoft Security Essentials (MSE), which was previously code-named Morro, provides antivirus, anti-spyware, rootkit protection and other tools to protect systems again malicious attacks. It uses the same technology as Microsoft's Forefront Client Security business product, and runs on Windows XP, Vista, and Windows 7 machines.
The software is available as a free download, with no registration or trial period. However, the software will run Microsoft's Windows Genuine Advantage tool before installing, to check the user's copy of Windows is not counterfeit.
"By making Microsoft Security Essentials easy to get and easy to use, Microsoft hopes to encourage broader adoption of antivirus protection across the consumer audience, which in turn will help increase security across the entire Windows ecosystem," the company said in a statement.
Microsoft will not bundle MSE with Windows, Julia Owen, Microsoft UK's consumer product manager, told ZDNet UK.
"It's a standalone product," she said. "Obviously we work very closely with OEMs [PC manufacturers], and [bundling] could be a possibility, but at the moment we have nothing to announce around that."
-
Big government has always been the response to big failures in big business or military conflicts. After all, no one expects big business to bail out or fight a war for any one - they are in the profit business after all. In the US, it was a string of Republicans and big business bubble in the 20s that brought about the crash of 1929 and subsequent election of FDR and then big government and regulation. The alternative was even greater suffering of the middle and lower economic class.
-
It seems like Fulcrumtrader (AMT4SWA) is marketing his services on this forum. Those who are interested should search for "Inventory Grab Alert 4"
"Inventory Grab Alert 4" - Google Search
On ET threadid=162563&perpage=6&pagenumber=397 there should be a doc file that summarizes the trading style. You can decide if it suits you.
amt notes - cumulative volume delta.doc
-
I also would not mind knowing how to just reverse direction instead of exiting the trade.nWhat you want to do to reverse is to use Sell Short (or SellShort, same function), ie., ..... SellShort next bar at Market;
Order VerbsBuy: Establish or add to a long position. Any existing short position will be covered entirely before the
long position is established. Two orders are generated.
SellShort or Sell Short: Establish or add to a short position. Any existing long position will be liquidated
entirely before the short position is established. Two orders are generated.
Sell: Liquidates a long position only. Can never establishes a short position.
BuyToCover or Buy To Cover: Cover a short position only.
You are trying to implement EL strategy using a platform that is not 100% EL compatible. I don't know what kind of support OEcry gives to strategy development, but all these questions are covered in the TS support forum, tutorial and documentation. The problem you are facing is how compatible is OEcry to TS EL strategy coding?
Here are some references to look at. Unfortunately, many other online tutorials and the TS forum are only accessible to Tradestation registered users.
Tradestation and TS Support combined Knowledgebase:
http://www.tssupport.com/support/base/
Getting Started with Easylanguage:
https://www.tradestation.com/support/books/pdf/EL_Getting_Started.pdf
EasyLanguage Reference Guide:
https://www.tradestation.com/support/books/pdf/EL_Ref_Guide.pdf
TradeStation EasyLanguage Extension Software Development Kit:
http://www.tradestation.com/Support/Books/pdf/EasyLanguage_Extension_SDK.pdf
The essential EasyLanguage programming guide
https://www.tradestation.com/support/books/pdf/EL_Essentials.pdf
---> At least, get the following two files, then make a shortcut to them in your quicklaunch bar.
The EasyLanguage Functions & Reserved Words Reference:
https://www.tradestation.com/support/books/pdf/EL_FunctionsAndReservedWords_Ref.pdf
Multicharts User Guide:
http://www.tssupport.com/multicharts/tutorials/multicharts.pdf
Also see:
-
If you never lose why do you want to be an IB? and don't you do have the ability to say no to MBtrading? Why do you send out some indicators only after donations if you don't need the 'donations' and you never lose?
TheRumpledOne- Ignore TheRumpledOne
modified 9/18/2008 4:29:56 AM
To Avery (TheRumpledOne):
I have given you the benefit of the doubt. I believed all you wanted to do was help even as you tried to post links to your IB business and after it was known that you accept "donations" for unreleased indicators. I didn't judge, I just asked that you remove your links which was deemed as spam and keep your side businesses off our site. You fought me for a while on the links, but you eventually agreed. But you continued to be sly, using the signature as an promotion for ECN brokers (which is related to your IB broker-MB Trading) and your indicators. During this period, you bombarded every single thread, with links in all of your posts in the signature leading back to your thread. Because of the abuse of the signature by you and others, I had it removed. Then you still put up links at the bottom of your posts to go back to your threads. Could you make your intentions any more obvious?
And it's obvious that your intent is promote your indicators for "donation" and Introducing Broker business. You can argue against it, but we've been on the net for while. We've seen a lot and we know better. It just went on for so long because I gave you the benefit of the doubt. That's my fault and I apologize to the community because ever since you've been on this forum, regardless of how many people you may have helped, the bad has outweighed the good as you've fought us, disrupted the forums with arguments and bombarded threads with your oversize font and images (again clear promotion techniques) which ruins my beautiful site and the hard work of my designers! The final straw was multiple accusations of threats to other users.
And now I have to edit a statement I made on an earlier post. The internet is free and open.....to an extent. And that extent is when you abuse and take advantage of the liberties given to you. And it's clear by your behavior that you were trying to take advantage of the years of hard work the BabyPips.com team put into this site.
This is unacceptable to us and you, Avery (TheRumpleOne and any other usernames you may use), are no longer welcome to BabyPips .com. Any attempts to sign up as other usernames will be quickly deleted and banned.
I know many may disagree with this decision, but the decision stands. We are a private company and we will run it as we see fit for the betterment of our site and our community members.
This is where we part ways Avery. Take care and good luck in your endeavors.
-
You need to talk to this guy. He had a plan with other people's money as well.
 $OPM$
$OPM$ -
Please search for forexgrail for more information on the free xls spreadsheet. Tom Yeomans was the original author but has written a new version for fee.
1. Make sure MT4 DDE is enable under tools.
2. Make sure Excel Eurotool is enable under tools.
-
Slab, This is usually a swinghighbar, swinglowbar level plots. You can find more answers by searching this (eg. "swing high low") and the TS forum for the indicator you seek.
For example, the following was contributed by John Mc. on the TS forum.
plot a line (or a series of points) at the swing high price and the swing low price until the next swing high and swing low happens and then start plotting from that price at where it happened
-
-
That is a problem with MC. Even if you got a good datafeed, MC is problematic. TS is a better alternative IMO.(I'm lost database after MultiCharts crash )
)Please help.
-
-
Competition is always good. Why was there even a CME CBOT merger in the first place?
NEW YORK (AP) -- CME Group Inc.'s stock slipped Monday after a group of banks and trading firms said they plan to launch their own futures exchange to try to garner cheaper commissions.
Late Friday, 12 financial institutions including Merrill Lynch & Co., Citigroup Inc., and Bank of America Corp. unveiled a plan for an electronic trading exchange. Initially, the exchange will host trading of futures contracts linked to U.S. Treasury bonds and then branch into new products later next year.
CME Shares Slip on Rival ExchangeMonday December 24, 5:13 pm ET
Shares of CME Group Slip As Banks Plan to Launch Rival Exchange to Squeeze Commissions
NEW YORK (AP) -- CME Group Inc.'s stock slipped Monday after a group of banks and trading firms said they plan to launch their own futures exchange to try to garner cheaper commissions.
Late Friday, 12 financial institutions including Merrill Lynch & Co., Citigroup Inc., and Bank of America Corp. unveiled a plan for an electronic trading exchange. Initially, the exchange will host trading of futures contracts linked to U.S. Treasury bonds and then branch into new products later next year.
The foray clearly intends to muscle in on CME Group's terrain. CME Group, which operates the Chicago Mercantile Exchange and the Chicago Board of Trade, handles almost all trading of Treasury futures, analysts said.
CME Group's shares slipped $16.75, or 2.4 percent, to close at $694 Monday.
The concern is that this rival exchange -- which will be powered by eSpeed's electronic platform -- will charge cheaper rates for facilitating trades and steal market share, forcing CME Group to cut its commissions or lose dominance.
This is not the first time CME Group has faced an incursion into its Treasury futures trading business. ESpeed's Cantor Exchange in 1999, BrokerTec in 2001, and Eurex U.S. in 2004 all tried to loosen CME's stranglehold on this product but all failed.
The futility of these efforts shows how difficult it is to cultivate the customers, trading volume and liquidity needed to run a viable exchange hosting Treasury trading, said Wachovia Capital Markets analyst Jonathan Casteleyn.
While Eurex U.S. put a small dent in CME's Treasury business, the exchange cut prices about 20 percent to protect its turf and then raised prices again once the Eurex threat was extinguished, Casteleyn noted.
Further, CME's Treasury trading is protected by an even wider moat than it was two years ago. When Eurex's Treasury trading launched, CME Group hosted trading of 2 million Treasury contracts a day. That amount has since doubled.
"It is unlikely to have more success than past attempts," Goldman Sachs analyst Daniel Harris wrote in a client note, referring to the startup exchange.
-
http://www.tradingsuccess.com/bs-construction.pdfI didn't see where on his blog he explains how he creates his buy zones. Anyone have more info?Ray didn't named the system 'BS' :doh: for nothing.
CHAPTER 5
FORMULAS FOR CONSTRUCTING
1
[b]BARROS SWING [/b]CONSTRUCTION
The smallest swing in any timeframe is the 1 period. In the [b]BS[/b] these are drawn differently
to the other swings in the same timeframe.
1-Period Swings
To draw a 1-period swing start at an extreme low or high. For the purposes of this
illustration, let’s assume we start from a low.
FIGURE 1 Dow Jones Industrial, Cash, Daily
In the chart above, let’s say we start the swing on Mar 12th, from the low we draw the line
its high and continue to do so until Fri Mar 21st. On Monday we have a low below the
previous day’s low. Accordingly we draw the line down from the high of Fri to the low of
Monday and continue to do so until we get a day where the high exceeds the previous
day’s high. At that point we draw the line up and so on.
Inside days are ignored.
For outside day’s the drawing of the line is delayed until the day following the outside
day – if the high of the outside is exceeded, we draw the line up; if the low is exceeded
we draw the line down.
CHAPTER 5
FORMULAS FOR CONSTRUCTING
2
Periods Greater Than 1
3-period: Using the same data. We start from the low and turn the line up when:
we exceed the highest high of the past 3 days (including today) + 10% of
the adjacent 1-period swing
FIGURE 2 Dow Jones Industrials, Cash, Daily
In Figure 2, the magenta lines represent 1-period swings. At the completion of trading on
Wed Mar 12th, the 3-d line will turn up on breach of highest high of the past 3 days (incl.
Today) viz, 7739.4 + 60 (10% of the 1 period swing which was 600.35 points).
The line will continue up until the market takes out a low that is the lowest low of the past
3 days +10% of the adjacent 1-period swing.
Reverse to turn the line down.
5-period: The same principles apply except that the filter used is 10% of the
adjacent 3-period swing and the line turns when the 5-period extreme is exceeded + 10%
of the adjacent 3-period swing.
Note that this means that for every timeframe, we first need to calculate the 1-period
swing irrespective of the swing size we are considering.
CHAPTER 5
FORMULAS FOR CONSTRUCTING
3
ADDITIONAL RULES
To circumvent the situation where the market fails to move sufficiently to turn the line
because it fails to reach the filter, there are two additional rules.
1) The swings (except for the 3-d) represent 1-p swings of high timeframes e.g.
the 5-daily swing represented the 1-period weekly. Hence any time we turn
the 1-period weekly line, the 5-d line must also turn.
At the end of this chapter, I have outlined the various relationships.
2) For a down swing, the price at which the line turns up can move down but
not up; in an up swing, the price at which the line turns down can move up
but not down.
e.g. Let’s says the line has been going up and we are looking to turn the line
down. The lowest low of the past 5 days is 100 and the 10% filter is 10. The price at
which the line would turn would be (100 –10) = 90
The next day the market moves down and gets to 97. In other words it exceeds
the low at 100 but fails to reach the low minus the filter price at 90. The question is:
at what price would the line now turn?
Because of this rule the price remains frozen at 90; otherwise it would be 97 – 10 =
87.
PERIOD RELATIONSHIPS
DAILY DATA
05-d = 1-p weekly
18d= 1-p monthly
WEEKLY DATA
13-W = 1-P QUARTERLY
MONTHLY
12-M = 1 PERIOD YEARLY
30-M = 1 PERIOD 2.5 YEARS
60m = 1 PERIOD 5-YEARLY
-
NT6x will likely not install if you don't already have Dot Net 2.0. Your problem is probably more database related, try re installing MDAC : http://www.microsoft.com/downloads/details.aspx?FamilyID=6c050fe3-c795-4b7d-b037-185d0506396c&displaylang=endot NET thing. Never heard of it.NT6x is not the most stable of programs (be prepared for crashes and freezes) and until recently the support and development has not been up to par with their competitors (ie TS). It is not free for trading unless you get it with a deal with some IBs (introducing brokers). Admittedly, what you get for free in simulation trading and charting is a good deal.
-
Not an expert TS programmer here, but I think what you are asking is a little complicated with TS EL. Here is a similar example of drawing trendline on a subgraph:
https://www.tradestation.com/Discussions/Topic.aspx?Topic_ID=69608
there are two primary issues. First, the TrendLines Automatic indicator is hard coded to use price data. These references will need to be replaced with references to your MyRSI calculations. Second, trendlines cannot be drawn on a subgraph without price data. Thus, you have to go through a somewhat tedious process of inserting a symbol into the desired subgraph, changing its color to the subgraph's background color and fixing the subgraph's scale to matchA simple solution may be to use the Opentick NYSE feed ($1/month) of ^ADDIFFN into the free for charting Ninjatrader and plot the regression channel. Please note that the Opentick feed is not always reliable, but neither is the Adv-Decl line.
One more advantage is that you could see the candles for the Adv-Decl line, which is useful for some traders.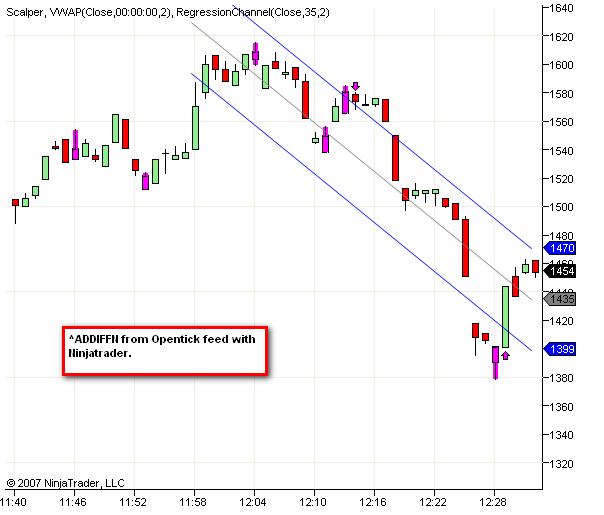
-
In an act of "creative imitation" (or is it "imitative creationism"
), Hubert Senter of TTM will also release a proprietary TS indicator called ... TTM Delta Divergence in early November, 2007. This indicator is looking for:Current Low or New Low.Histogram represent the difference between the volume traded at or above the ask and the volume traded at or below the bid.
Aggressive buyers at the Low.
Aggressive sellers at the High.
Real-time Only
Let it run a little first {in usage}
Here is a link to a swf video describing this indicator : http://www.divshare.com/download/2532690-421
Those wishing to write the code for this may read up on a real time bid ask price action indicator called TickMoneyFlow here: https://www.tradestation.com/Discussions/Topic.aspx?Topic_ID=68788&Page=2 which may be another source of "creative imitation" for TTM.
{TickMoneyFlow indicator from TS forum. D=68788&Page=2
The CurrentAsk/CurrentBid function returns the current real-time inside Ask/Bid for the last bar on the chart, for use in a chart window.
CurrentAsk/CurrentBid cannot reference historical Ask/Bid data, and returns the Close of the bar for all historical bars in a chart. Keep in mind that symbols that do not trade directly will report 0; (e.g. Market Index Symbols).
}
Inputs: Length1(500),Length2(100);
Vars:	IntrabarPersist TickFlag(0),
	IntrabarPersist OldPrice(0),
	IntrabarPersist TMF(0),
	IntrabarPersist NewTickVol(0),
	IntrabarPersist MyBarVolume(0);

if BarNumber >= 1 then
begin
NewTickVol = Ticks - MyBarVolume;
MyBarVolume = MyBarVolume + NewTickVol;
if (C>=CurrentAsk) then begin
	TMF=TMF + (C * NewTickVol);
	TickFlag = 1;
end;
if (C<=CurrentBid) then begin
	TMF=TMF - (C * NewTickVol);
	TickFlag = 2;
end;
if (C<CurrentAsk and C>CurrentBid) and C>OldPrice then TMF=TMF + (C*NewTickVol);
if (C<CurrentAsk and C>CurrentBid) and C<OldPrice then TMF=TMF - (C*NewTickVol);
if (C<CurrentAsk and C>CurrentBid) and C=OldPrice and TickFlag = 1 then TMF=TMF + (C*NewTickVol);
if (C<CurrentAsk and C>CurrentBid) and C=OldPrice and TickFlag = 2 then TMF=TMF - (C*NewTickVol);
OldPrice = C;
if BarStatus(1) = 2 then MyBarVolume = 0;
end;
Plot1(TMF, "TMF");
Plot2(LinearRegValue(Plot1,Length1,0));
Plot3(LinearRegValue(Plot1,Length2,0));
Using Cycle Polynomials
in Technical Analysis
Posted
You mean something like the Hurst bands?
Gold rounding top
ES going parabolic
Both projections are probably wrong.