
Welcome to the new Traders Laboratory! Please bear with us as we finish the migration over the next few days. If you find any issues, want to leave feedback, get in touch with us, or offer suggestions please post to the Support forum here.

MrPaul
-
Content Count
373 -
Joined
-
Last visited
Posts posted by MrPaul
-
-
I trade Gold from 7:20cst to around 8:15cst using the same strategies as I do on the indices.
-
Thanks guys for your feedback. So I assume none of you are using his pivot moving average crossover indicator, etc. explained in his second book and thus not using any of the systems (or variations) described in the second book.Fred
His second book dwarfs his first book in quality. I can at least attest to that fact. But the book is $80 retail.
I actually have one of his setups with the COMAS MA's displayed in "my photos"
-
What about the issue of poistion size?
I would consider someone taking 3-4 ticks 3-4 times on 20-30 lots a scalper.
-
I vote for a campfire re-open
I can't seem to get along with that tradingroom software:(
-
"look you guys, do not get intellectual in these markets, JUST TRADE THEM...........IF you guys were not bond traders you would be driving a truck" --- William Simonlmao best quote yet imo...

-
The only way to win is to be in the game
Just in case anyone missed that...
-
Soul,
I find that to be a good trade imo, I went long the ER2 inside a similar setup and took some profits before price declined. The selloff was mainly due (at least in the big S&P) to institutional sell stops being taken out.
-
Cool thread, I have three I write down at the top of my daily notes each day.
"Trade what you see, not what you think" - Vadym Graifer
"Focus on the setup, not the result" - John Carter
"Everybody gets what they want from the markets..." - Ed Seykota
-
I'm surprised no one has brought up the issue of position sizing with regard to type of setup. I have about 5 setups I play that range from high probability to extremely high probability. My contract size will be completely dependent on the setup at hand.
In my opinion it is disadvantageous to initiate a set number of contracts across a series of day types (low volume/high volume, trending/ranging etc.) and trade setups.
For instance capitulation volume into an area of support that formed a very bullish candle pattern would warrant a high number of contracts. On the other hand a counter-trend profit taking scalp would warrant a much smaller position size (due to the lesser degree of probability).
What also makes a very big difference is whether you are trading off of market structure or your P/L. If you trade (focus on) your P/L you will exit too soon, if you trade off market structure the contract size does not matter.
-
I voted consistent:cool:
-
To add to what has already been mentioned...
A good book for gap fade plays is:
Amazon.com: Mastering the Trade (McGraw-Hill Trader's Edge): Books: John F. Carter
If you are looking to play continuation gaps on individual stocks look here:
Trader-X...views from a distorted mind.
-
This may help clear things up. I originally mentioned the core holdings index after looking through a stocktiming.com report on China/the S&P/ and the core holdings index
In hindsight they were spot on...
The point was divergence and non-accumulation, not so much this leads that etc.
Hope that helps
-
Hey everyone
I came across this website and I have to say I'm impressed with the breadth of daily pivot data, you can find anything from 2-Year T-Note's to the Mini-Dow and Lean Hogs.
A good bookmark for sure...
Pivot Point Analysis for FOREX, CBOT, NASDAQ, NYBOT, NYSE, and more
-
Welcome to the forums
-
Welcome to the forums Blowfish!
-
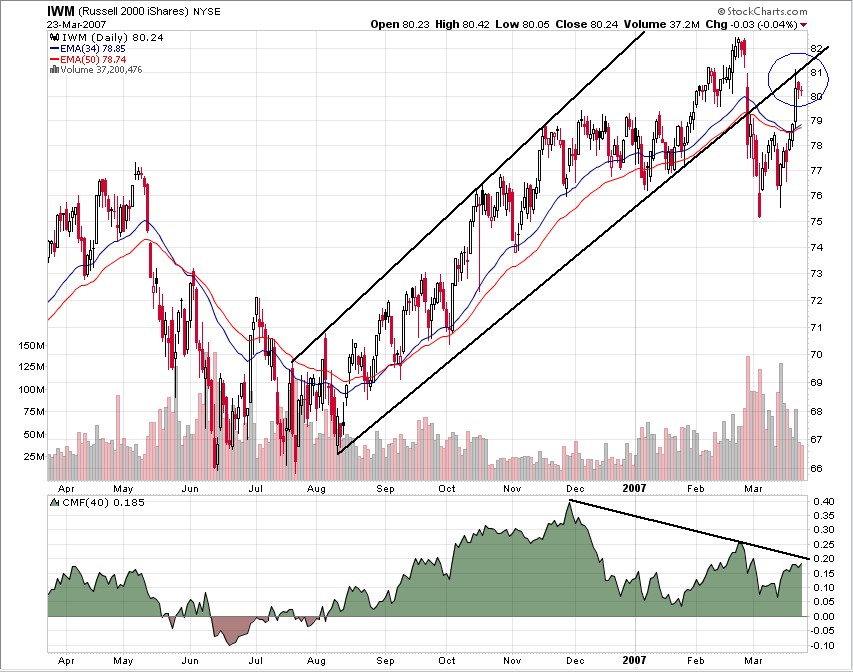
The next week's price action will be very important for the Russell. The chart below shows that we have begun to test the bottom trend line and the is a divergence in Money Flow.
-
WeiWei,
Nice write up. The 80/20 rule is also called The Pareto principle. The Pareto principle can help with time management as well. Richard Koch wrote a pretty good book on the subject entitled The 80/20 Principle.
Here's a couple links:
Pareto principle - Wikipedia, the free encyclopedia
-
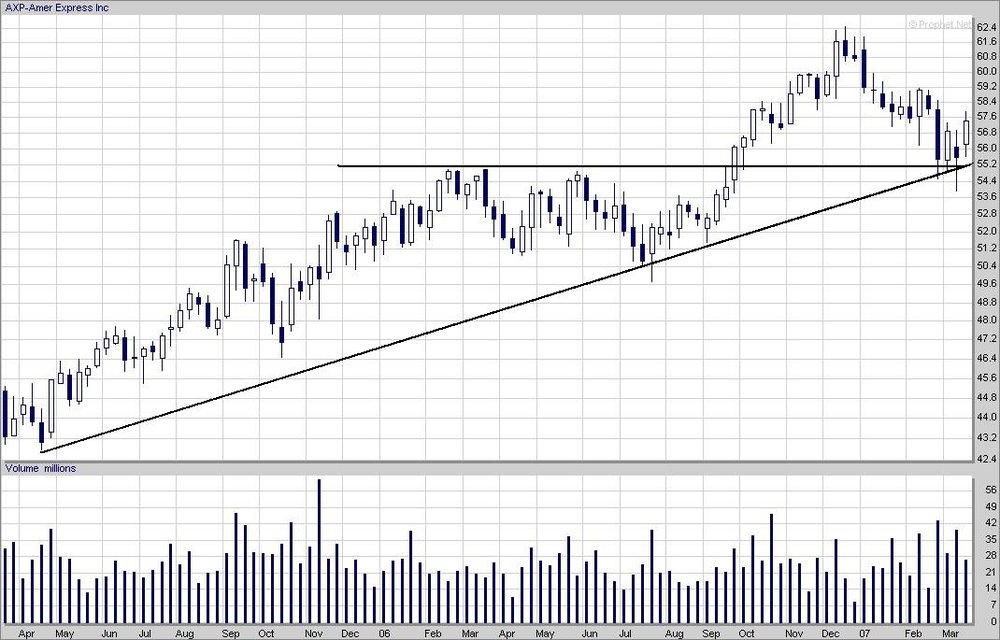
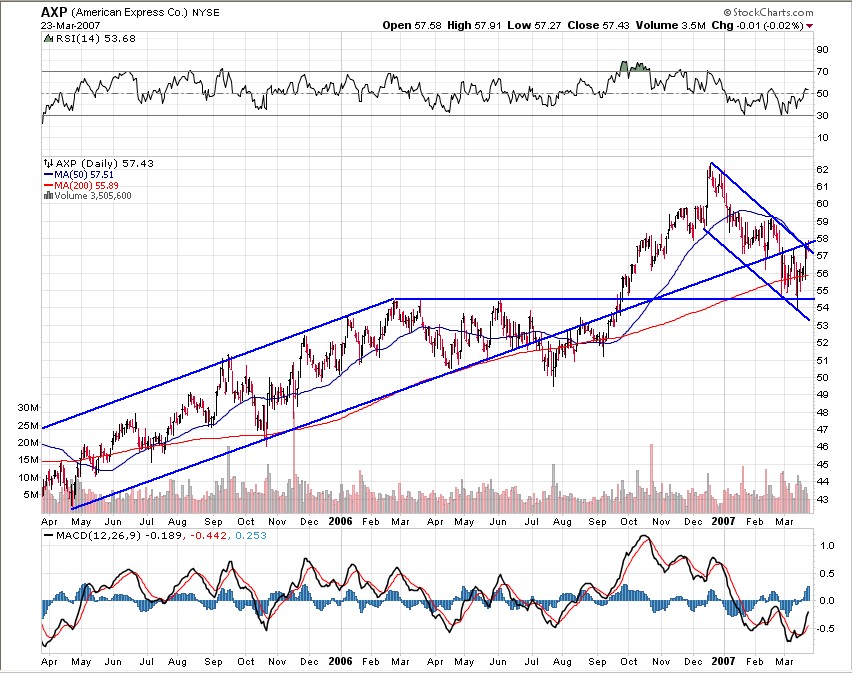
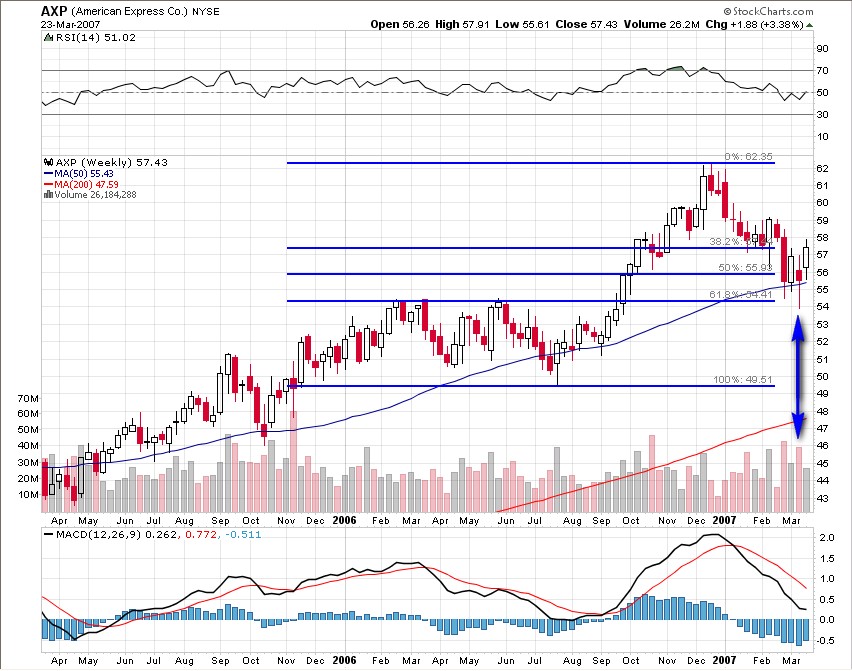
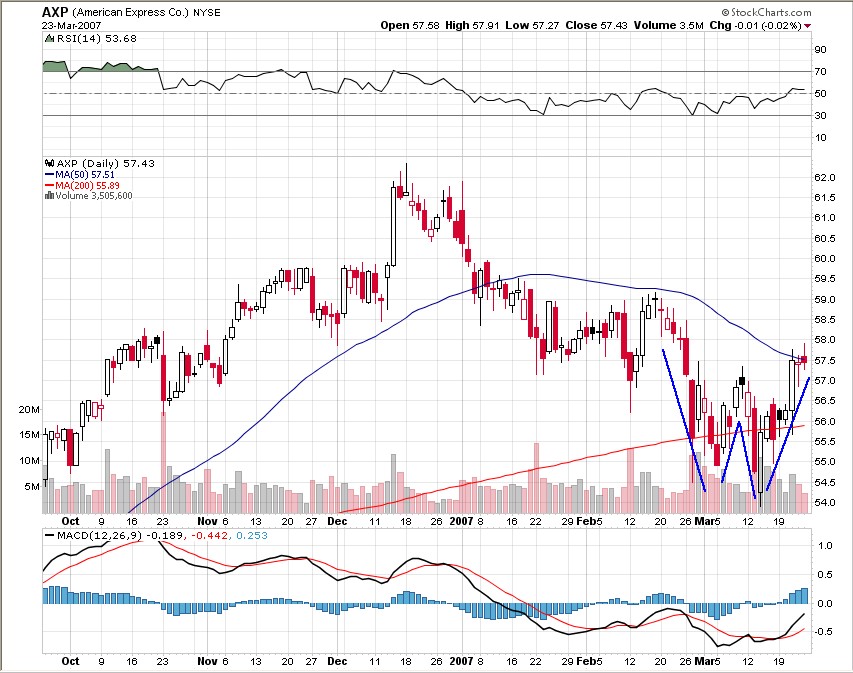
Here are some daily and weekly timeframe charts of AXP. I like to find stocks that have been beaten down and are due for a turnaround...
-
A couple of my fav's and a Honda concept...


-
Mr Paul I would like to learn how I can take does global numbers and from where..... thanks Walter.Thanks brownsfan. I started using a 1500v chart but still need my handy 5min chart next to it.Also, Paul excellent post. How do you usually check the average volume. Through your charts? Or do you get the data from the cme? Thanks
I get the numbers through Interactive Brokers
-
MrPaul - I'm curious to what "sustainable smooth volume flow" is...Just Institutional contribution throughout the session. For instance today's session volume was 180,400ish on the day. I documented in my notes that @ 9:25am CST we only had a volume level of 39.854, on a day where there is a flow of Institutional Volume that is price move sustaining we would see 2 to 3 times that (on the ER2). Today we basically were playing a game of ping pong, the volume wasn't smooth it was often jerky and intermittent leading to unsustainable price moves.
Perhaps I should have just said Institutional volume flow, but I read the term "sustainable volume flow" somewhere and it kinda stuck in my head

-
I'd like to thank Soultrader and staff/originating traders for putting together a fantastic site. It is a true learning environment for a newbe like me. I posted my first chart in the chat and will contribute more as soon I have some consistence in my strategy.btrader
btrader,
Welcome to the site! Glad to have ya' here
-
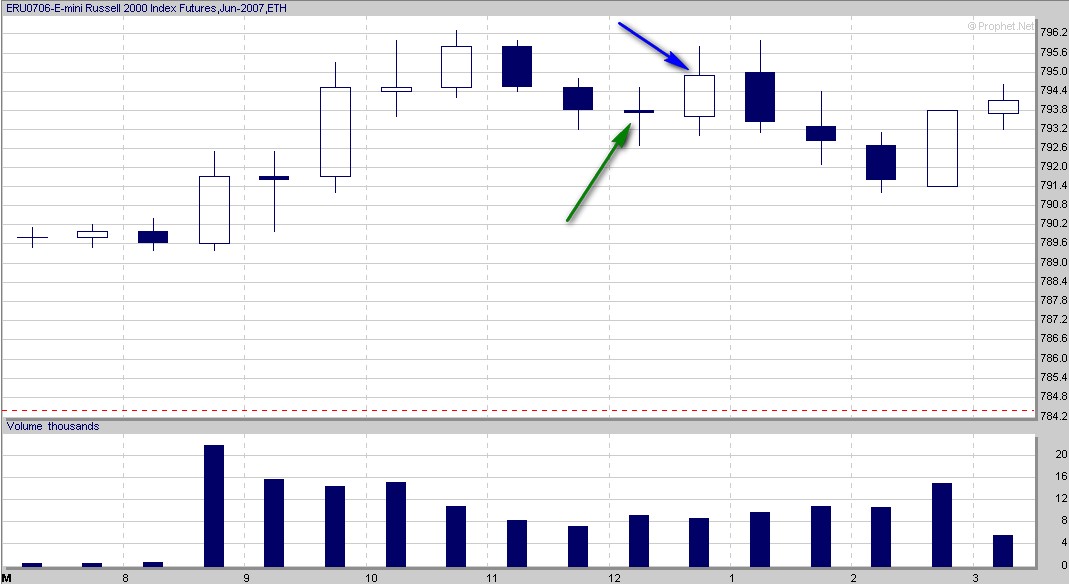
While I planned only to create a post when there was a valid Candle signal for the day I wanted to make this post about when not to trade. Even if there is a valid candlestick trigger, there are instances where it is better to stand aside. Or better yet maybe we should get down to defining what a valid Candle signal is?...
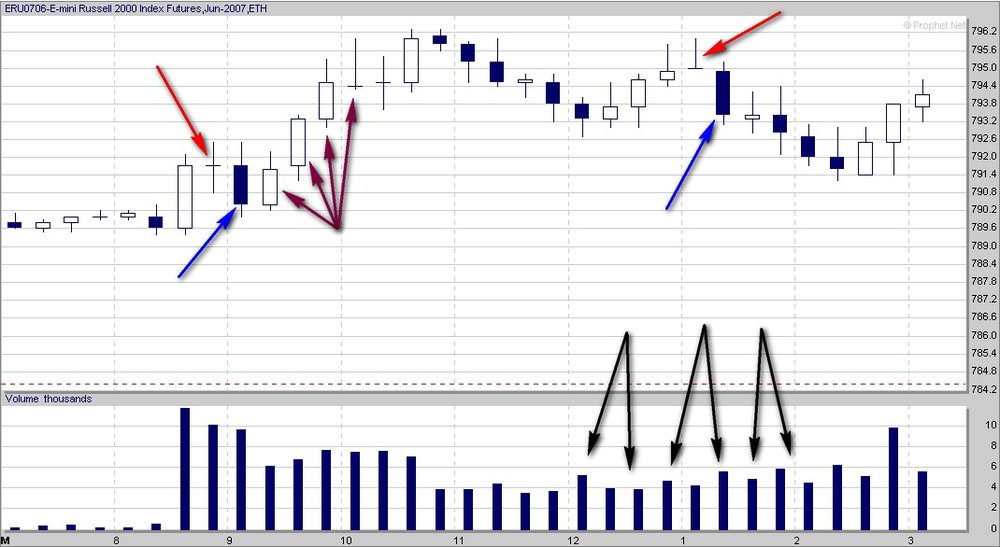
First Chart May 19th 2007 ER2 15min
As we can see in this chart Price gapped up and formed a doji 45 minutes into the trading day(red arrow) and was confirmed with a close below it shortly after(blue arrow). This is a classic textbook example of a signal to go short, we have a doji displaying indecision amongst us traders and the next bar displays outright bearish sentiment by closing below it, what a classic trade! Well, not quite...What a still chart cannot give you is the markets subtleties, those meta communications that are essential to understand if Candlestick analysis is to be applied correctly. If one was to witness the market live they could say that there was a lack of sustainable smooth volume flow.
This is important, Knowing your edge is only half the equation. The real mastery of an edge is knowing when Not to apply it. When looking at Candles from a supply/demand complex it is essential that there is sustaining volume flow. That is what carries momentum within the market so that you can exploit an edge.
Someone may point out the fact that there was a Gravestone Doji that formed later in the day(red arrow) and price did in fact verify that candle by closing below it(blue arrow) and even trading about a point lower before reversing! But that really doesn't mean much to me, volume had left the building(black arrows) and there was no momentum present...
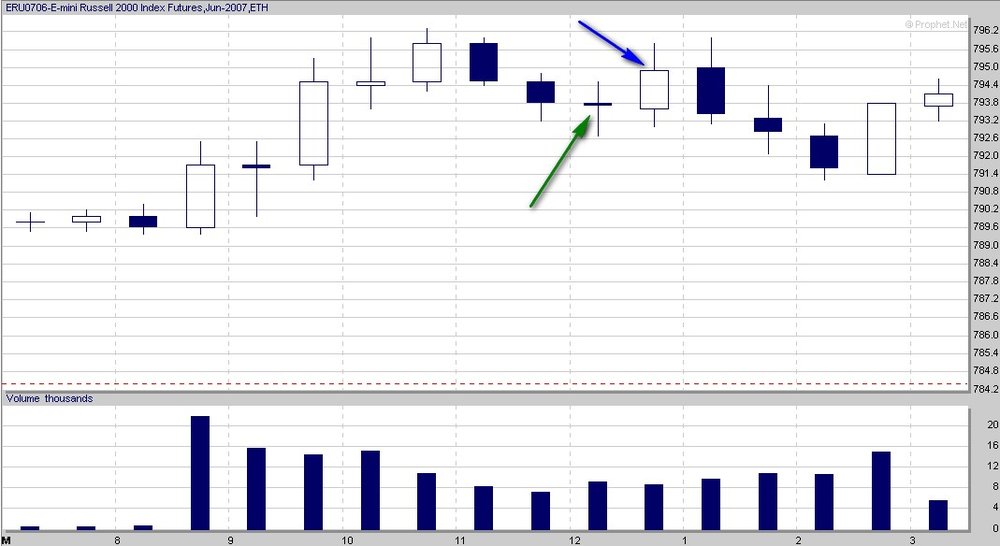
Second chart May 19th 2007 ER2 30min
Here's another example on a higher time frame of a Candlestick trade signal gone bad. We have a nice friendly "hey how are ya, hows the wife n' kids?" pullback forming an indecisive Doji with a higher close on the next candle .Boy those 15min charts sure are deceiving, but not the ole 30min thats where the big guns hang out and a valid candle signal to go long there is the ticket even if there is low volume, look it's a pullback too, what a classic!...Not Quite.
I Hope this helps out!
I have included a rare picture of one of the disgruntled low volume Candles from today, obviously you don't want to be taking signals from these guys...
-
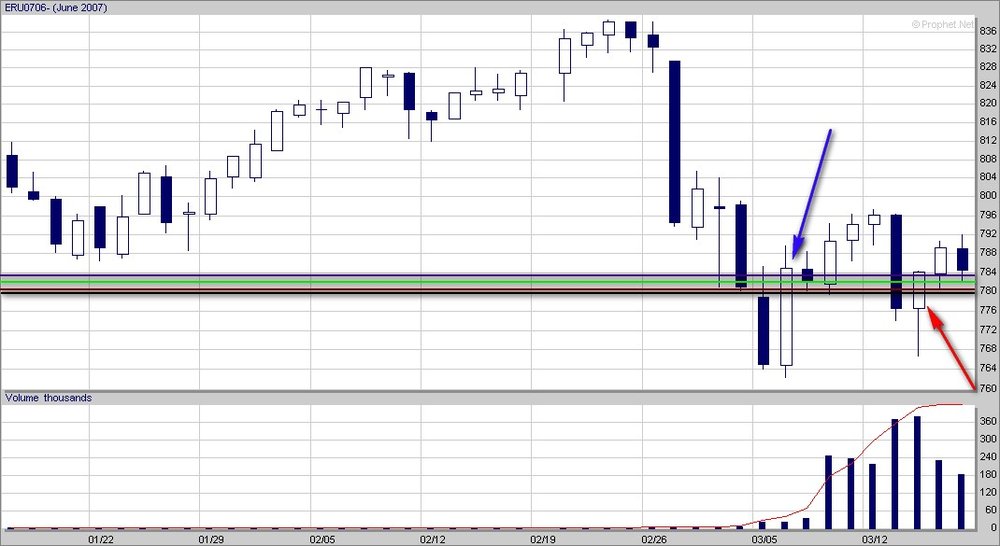
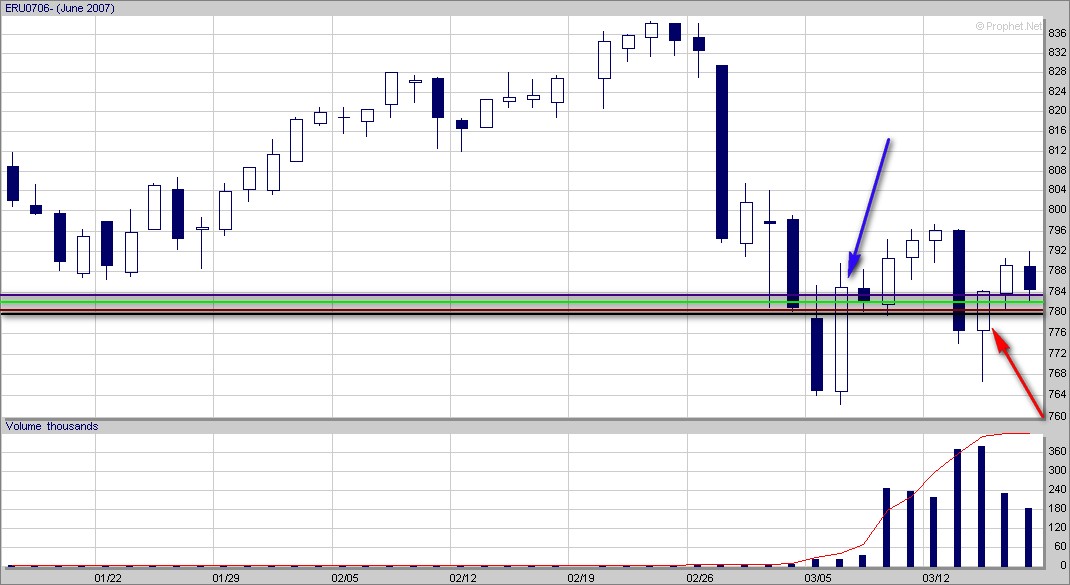
Hey everyone just wanted to post up a chart of the daily ER2 for a heads up on Monday.
We do not have any economic reports or chatter scheduled Monday so we could see some technical trading.
Daily ER2 chart for Monday March 19th
We see here on the daily time frame that price has tested the low area after the sell-off a couple weeks back. In that area we see a bullish engulfing (blue arrow) followed with a hammer (red arrow) on the test.
What make this area interesting for Monday is that we have a cluster of support levels across different time frames. We have The daily S1(black line), Monthly S1(dark red line), Previous Days Low(Light Green line) and the Weekly Pivot(purple line). This is significant, there are traders from different time frames with different objectives that could be support or resisting that level.
This cluster could leave us a temporary support to bounce up or if price trades lower a temporary resistance level for the day.
What I'll be looking for tomorrow is demand rising near that level or lots of supply coming in after that level is traded.


Introduce Yourself Here - Don't Be Shy!!
in Beginners Forum
Posted
Welcome to the site