
Welcome to the new Traders Laboratory! Please bear with us as we finish the migration over the next few days. If you find any issues, want to leave feedback, get in touch with us, or offer suggestions please post to the Support forum here.


BlowFish
-
Content Count
3308 -
Joined
-
Last visited
Posts posted by BlowFish
-
-
Tim's Book is good and the old medianline site was excellent. I'm not sure everything got transferred over but he had loads of interesting charts trades and discussions. I still have a folder somewhere with prints of all the charts he posted. I he has had personal issues recently but in the past he has been extraordinarily generous with his time and knowledge.
Gordon at http://www.pitchforkprimer.com/ is good to. If you want to learn it more or less as Andrews taught it, he's your man. He will give as much of his time as you need to get each point.
Abnother pretty good source of pitchfork stuff is Mikula's "The Best Trendline Methods of Alan Andrews." http://www.mikulaforecasting.com/books/aabook.htm
I spent quite a long time (close to a year I guess) studying pitchforks and they certainly have merit. I prefer to use simple trend lines and channels at the moment. (A regular trend channel is identical to a modified Shiff pitchfork for those that are interested). Every now and then if the price action looks like it warrants it I'll throw a regular pitchfork on.
Oh I guess I should mention Jim Kane too he's really a Fibonacci guy (one of the best, imo again) He wrote a book "Kane Trading On: Median line and Fibonacci Synergy". http://www.kanetrading.com/books/books.html Its kind of different to 'mainstream' but interesting none the less. There are probably pre-requisite books of his too. I bought the boxed set of the whole lot and did not regret it. Actually I did not regret any of the above purchases.
Sometimes I scare myself how much time and money I have spent learning this trading lark....If i think a method has merit I tend to try and track down everything that has ever been published about it. Doesn't necessarily help with my trading but I have a keen interest in the whole arena.
-
Notouch do you find Ninja solid? I had read a few posts here and there saying version 6 was quite flakey?
I am particularly interested in adjusting stops and targets through the charts that sounds cool in the extreme.
Finally what's the performance like? I remember beta testing NT when it was a simple (very simple) order entry helper even then it seemed to add a small but noticeable delay to things.
I was looking for an excuse to try it again but wanted 'solid slick and fast'. (I'm also considering Neoticker for another look).
-
P.S. While we are talking about this minutiae I haven't lost sight of your main comment about the WRB being the big clue.
-
The second type of action described under that description (low volume) is quite different to the first (high volume). I think its very important to distinguish what's going in each case. Actually I would not normally refer to them as 'upthrusts' the latter (low volume) ones I would call a test despite being upwards.
The first essentially shows that sellers have entered the market in strength. You would normally see this after a solid rise. The second shows that the buyers have withdrawn from the market. You can see this after an up move but it is far more common at the end of a small correction or testing an area where demand had previously appeared to the left. They are quite different in characteristic and will be seen in quite different contexts usually. This is one of the areas where the book could really be clearer imo.
If you look at the 10 min chart every stair step down (including the one before the two we have been discussing) has its end marked by bars similar to this second type of bar. (though slightly lower closes differentiate them). They do open low go up and close low however. If you watch it in real time it is even more clear you can see the buyers just disappear.
Actually there is a much broader principle at play here 'stuff' can happen broadly in one of two ways buyers withdrawing or sellers entering. The former tends to happen in corrective moves. This was one of the early things that I had difficulty with in the early days when the book had just been published. I scratched my head thinking why can this occur on high volume or low volume until it occurred to me that it was distinctly different behaviour.
Hope I am not being a pain....I feel there is still useful stuff coming out of this
 Its helping me anyway.
Cheers.
-
What you will discover in the next thread, is a new paradigm about stop loss placement and trade management.
Other HUPs will come into play between the entry point and the profit target which will play an important role in the momentum of the trade. We will discuss these in a later thread.
Really looking forward to these missing pieces of the puzzle. (and getting hold of/writing some indicators so I can follow along properly).
-
feel free to help out at the Tradestation forum site for this:https://www.tradestation.com/Discussions/Topic.aspx?Topic_ID=66875&SearchTerm=VWAP&txtExactMatch=
Sadly I don't have access there any more
 There are some forums that are public still (I think) but that one you need to be logged on for. Perhaps you can keep us informed if there are significant developments (though this might not be the appropriate thread to do it).
 -
While there's many great threads (PP's VSA brought me here in the first place, Several of Walts are great, numerous others spring to mind too) I'd have to put my vote in for Jerry's (JPerl) astounding series on 'Trading with Market Statistics". :bow down: Ive seen (and bought!) far inferior stuff for $$$. Trouble is its up to 5 chapters (threads) now - I guess I should just vote for them all.
Any other result and I say its rigged hehe

-
Nick1984
That's the 'scared money' dilemma. In my own case I started trading US afternoon sessions in the evening (UK time) and then moved to a 4 day working week trading one full day in addition. A couple of independent real estate investments have allowed me to give up my previous job without any real financial pressure on my trading.
To be honest I can not really imagine trading full time under the financial circumstances you mention though I am sure its possible. I guess I am too old and generally risk adverse nowadays. In any case I would want to be consistently profitable week in week out for I guess at least 6 months though by that time I would expect to have more cash from the 6 months profits anyway!
Cheers.
-
I am sure I have seen a Tradestation study that does the PoC as a horizontal line that 'stair steps' when a new level becomes the new highest volume level. This is a great advantage when looking back at historical charts.
Unfortunately for the life of me I can't locate it.
Has anyone got 'pseudo code' (or ESPL would do) for the standard deviation lines. I would be happy to write and post EL code from that and would not have to think too hard about the maths :sleep:lazy:sleep: I know.
-
Tin,
That's a good point. Its the education that takes the hours of blood sweat and tears. Once you are there that is no longer mandatory (though some now choose to continue with the same zeal). I know traders that are happy to take a couple of points out of the market 2,3 or 4 times a week. They have there 'levels' drawn after about 10 minutes and there orders placed 5 minutes after that. After that they are done for the day. Their argument is that the reason they chose this career was for the freedom it offered. Can't fault the logic.
Personally I have done the 18 hour a day stints watching two continents markets studying in slack times eating at the computer, taking a trading book to bed. Its easy to burn out emotionally (as well as financially) and I did more than once. Actually I'm still not sure I'm completely in the clear
. With the benefit of hindsight quality of effort/study is oh so important. Quality over quantity everytime, of course starting out it can be hard to tell. I would often do anything (and everything) to avoid tackling the real issues that I needed to address. I am still prone to allow myself to be distracted and justify it by saying I am 'working' because its trading related.
I'd start with a plan that lays out what you are going to do and how you are going to do it milestones etc. Just as if you where going to start any other business and transition from part time to full time. Do it 'for real' ask your self if someone else gave me this plan would I invest in the venture? If I was the bank would I support it? etc. I'm sure there are loads of places you can get info on writing a good business plan. The 'business' part of a trading plan (including the micro and macro parts of money management) are pretty critical. Actually its probably better to have a business plan with a trading part rather than the other way round.
Cheers.
-
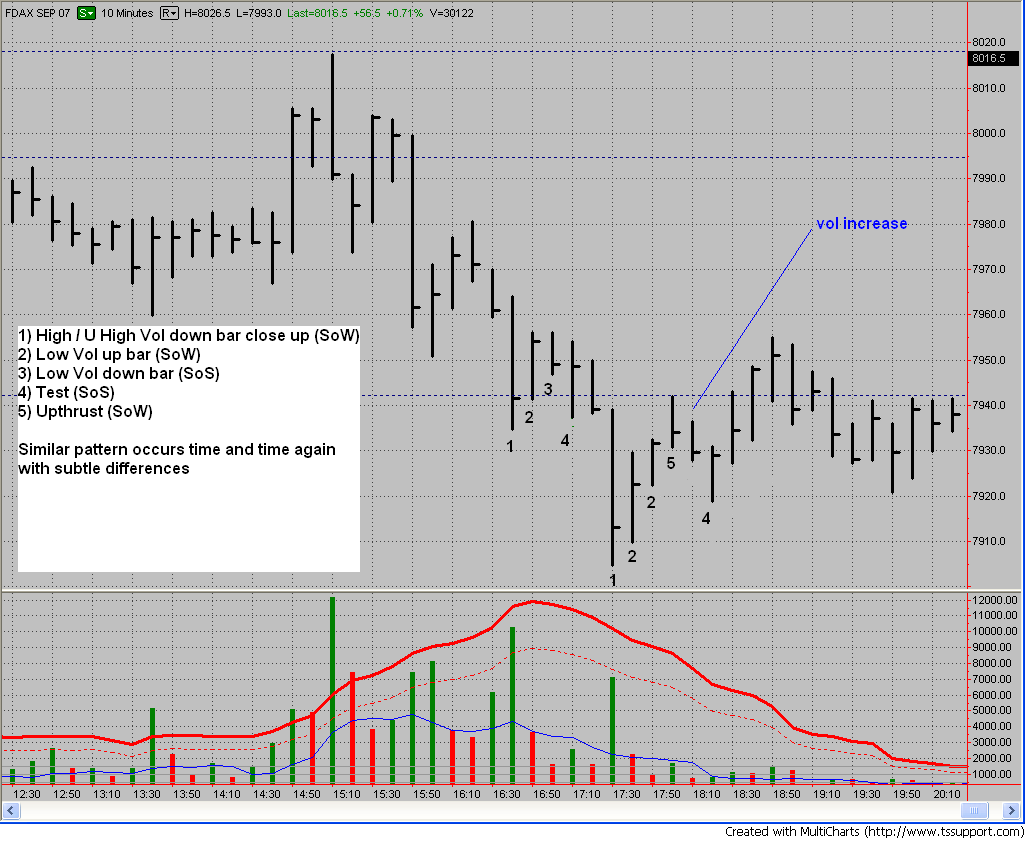
The number #1's are strength that was a mis-annotation I had to do it all again as paint messed it up (OK I messed up -an aside can anyone recomend a good simple annotation proggy?).
I could argue (but won't) that the first 4 is a test it's certainly not a great one - price has moved down into the area of the high volume bar and gone back up. It was on increasing volume though it was much lower relatively.
Bar 5 'upthrust' is testing that exact same area the first 4 was but from the other side. The predominant trend is still down and we would expect the market to test upwards before carrying on down. Price does come off for a couple of bars anyway. As an aside notice the dotted blue line at that exact price...that'll be R1/S1/R2/S2 or some such.
The reason I am hammering this (pardon the pun) is not to be argumentative but to try to improve my understanding. As I said earlier I think one of the key things is gauging whether clearly observable demand entering the market is 'enough' to overcome supply and whether it overcomes it with enough force to terminate the trend (rather than just pause it).
Thanks again PP for your insights.
-
Re annotated 10 minute chart with comments in the image. Second (and real low) seems to have more weakness in that the first one? This general pattern is really typical of 'stair step' trends. The test or volume dry up bar make fantastic continuation entries in a trending (stair step) market.
P.S.
PP missed your longer reply getting to that now. Hindsight is fine (that's contentious) but we have to be extra brutally honest and if there is any doubt or 'fuzziness' assume the worse. Imo it is then pretty valuable. With that in mind I always assume the reverse of what I am trying to prove. Works well for me.

-
OK first off best to ignore the dots over the bar. If you notice there can be potentially two sets of dots over the bar. Which position which end and what colour have significance. The green dots are nothing to do with volume but spread and close! Blue dots are low volume cyan dots are ultra low volume but there position has significance too!
Anyway please ignore them for now as they are a work in progress.
The question still stands and it seams to show VSA 'not working this time'. The pattern of bars, volume, spread etc. is almost identical on the last two pushes down. One results in another leg down one results in turn.
Both have a climax bar with close up (buyers entering). Both have a test a few bars later. This is a sign of strength not weakness. One results in the downtrend ending one does not. On the 10 minute chart I have a simple tick and cross on the test bar which would be a classic go long. On the 3 minute chart I have drawn a yellow horizontal line segment under the two groups of bars.
Let me be clear I am a staunch proponent of VSA but having studied it long and hard (since Williams first edition) I still find this is one of two areas where things are subtle and different.
Cheers
-
Blowfish;Thank you for the charts, please keep them comming. I am sure somebody here will be able to make a comment soon.
I was hoping you might being the resident VSA guru
-
It certainly focuses you on price (which I guess is king). I think it was in that book that he proposes a simple X box reversal system. Doesn't get much easier than that as a basis for a simple trend following system. It's an interesting way to view the market that's for sure.
-
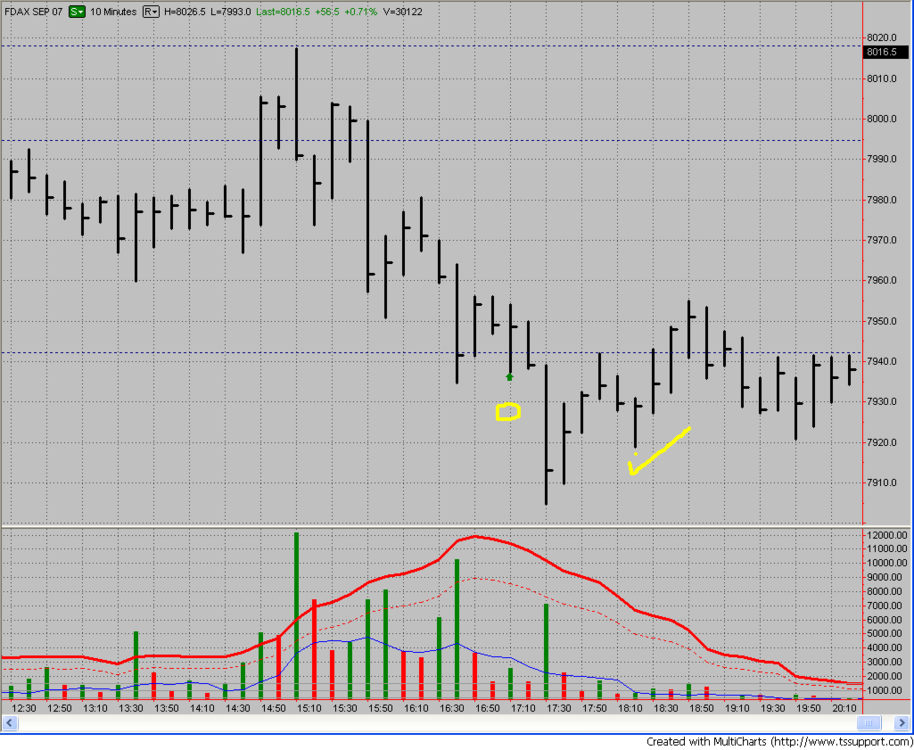
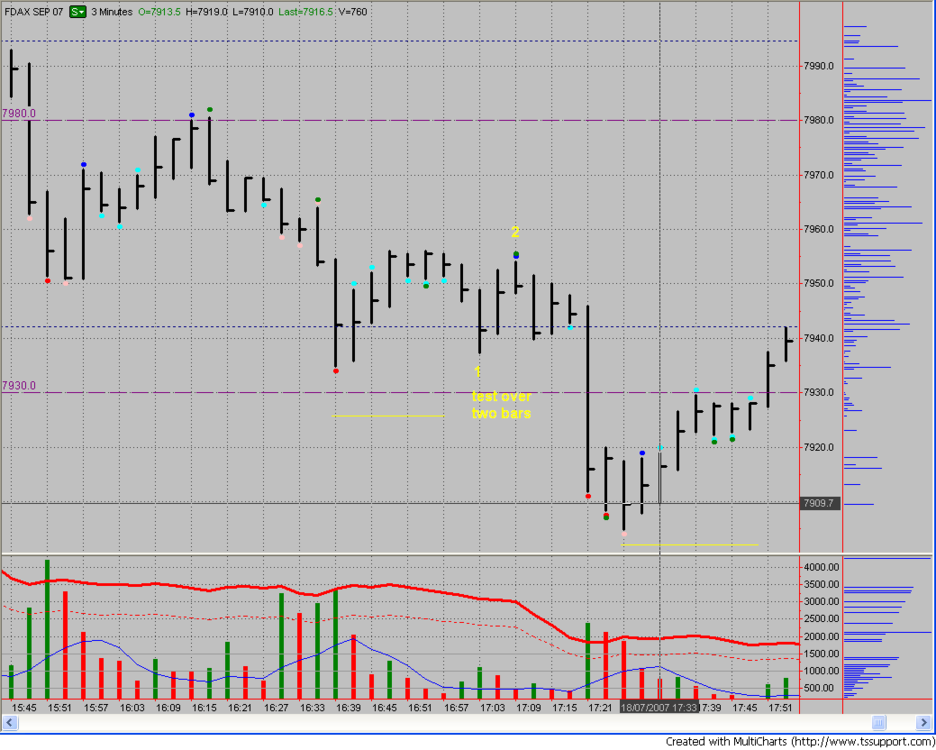
Here are are a couple of charts of the DAX that I have wanted to post for a while. There is a 3 minute and a 10 minute to give a couple of perspectives of the action.
One of the two remaining questions I find I ask myself asking frequently is "was that enough volume to stop the move (rather than just pause it)". The charts show the last two legs of a down move. To me they look very similar.
You have a down move with high volume and then a test of that area over two bars (point 1) on diminished volume. The only small clue is at point 2. Apart from that one bar before the final drop I would say the first 'bottom' looked weakest to me!
I'd really welcome comments as it seems the differences between the two are really subtle. Of course if we could read supply and demand with crystal clarity on every occasion then we would never have losing trades. I believe this is impossible
so it is probably safe to say that it is not possible to read supply and demand with crystal clarity on every occasion!!I've left the charts fairly 'bare' in case people wanted to draw on them.
Cheers.
-
I found it a pretty nice book it actually made me want to incorporate (or even replace!) my charts with P&F. At the time that wasn't appropriate but I'm sure I'll revisit it one day. One of the nice things was that it discusses shorter time frame charts. One of the nice things about P&F is that I think you can probably come up with more disciplined (even mechanical) ways to trade fairly simply.
Cheers,
-
Its most likely a FireFox issue. I cant see how our system would affect that. Its working fine for me in Opera and IE.Certainly didn't mean to suggest it was though there is a subtlety there.
It is definately to do with mime types though I am not exactlys sure what why or how. It seems as some images are being stored as mime type unknown/unknown those where the ones giving me issues.Getting rid of the file described here fixes it
http://kb.mozillazine.org/MimeTypes.rdf this re-set that particular mime type to 'prompt' fro action.
I actually used a more complete document that described re-setting a couple of internal paramaters but I cant find it just now.
I also installed a Firefox add on called mime edit though I dont think this is strictly neccassary. You can however achieve the same effect with this without deleting the associates file.
Cheers.
-
I have a couple of books on PF
http://www.amazon.com/Definitive-Guide-Point-Figure/dp/1897597630
Is arguably the best. It is also probably the most up to date.
There is a 'classic' but its name escapes me and I am not by the library right now but I though the one linked covered everything the other did and then went a wee bit further.
-
OK kinda fixed it. Suspecting it was to do with mime types I downloaded a FF plugin called Mime edit.
I set unknown/unknown to always ask and its fine! I suspect you can do it with FF's hidden config stuff but as I cant even remember to get in there I didn't explore that.
I wonder if it was another plugin that messed things up. My hunch is 'flash got'.
-
Thing is its not all .PNG's which is why I wondered if its an incorrectly set MIME type or something? Drives me potty :mad: or I wouldn't bother mentioning it.
-
Hi I am tearing my hair out as some images like the one attached to this thread
http://www.traderslaboratory.com/forums/34/vsa-volume-spread-analysis-1369-30.html#post15283
just refuse to 'open' for me...a dialogue box always pops up asking where I wanna save the image. Other sites (and sometimes .PNG images here) offer the choice of what I want to do.
I do not have an entry for .PNG in tools>options>content>manage file types in Firefox so should be prompted each time.
Cheers.
I wonder if it might be something to do with the board incorrectly tagging the Mime type but am no expert in that area.
-
___Snip___
When you really, truly, deeply, madly and honestly believe that trading is simply a game of probability everything in your brain changes and you are on the road to "entraining" succcessful synaptic strategies.
___Snip___
Doctor Janice
The problem comes (I suspect) even if you 'truly madly deeply' believe this at ever concious level - and - even if work diligently to ingrain it into your subconscious. Many of us still have this basic 'protection' mechanism that things it is helping us. Very interesting concept that money is the last great taboo, it is no wonder that if trading has stripped large portions of money away from us that the subconscious believes it is helping by protecting us from the market. Of course it usually gets us in late or out early in its effort to reduce our exposure.
As yet I have not found a truly effective way to re-train those subconcious 'protection' mechanisms.
-
Its a long time since I had Neoticker but one of there selling points is if you have a fast machine and good bandwidth you can build your own indexes in realtime (I never did that!) In theory thre is no reason why you could not do that for the delta of an index.
Neoticker is a prety fine product if you are doing 'heavy duty' indicators, coding and/or system based stuff. To be honest my style is pretty discretionary (how is price behaving around S/R) I still keep looking for excuses to buy a copy of NT though (I only leased before).
Cheers.


New MP Software for Ninjatrader
in Market Profile
Posted
Ahh OK thanks, guess I should give it a try. Something really appeals about entering an order with fixed point emergency stop and target, then dragging the stop to the last swing high on the chart and maybe adjusting the target to the other side of a trend channel. That sounds like coolness in the extreme.
I'm kinda interested in how user studies work in ninja too. One of tradestations huge advantages is easy language. Chances are there is a public domain study or some code you can modify for most of what you might want to do.
I'm currently using Multicharts but am disapointed with how numerous things are still 'rough'.