
Welcome to the new Traders Laboratory! Please bear with us as we finish the migration over the next few days. If you find any issues, want to leave feedback, get in touch with us, or offer suggestions please post to the Support forum here.

januson
-
Content Count
107 -
Joined
-
Last visited
Posts posted by januson
-
-
I'm having a hard time trying to figure out what there in reality will happen when the currency crisis occurs.
My scenario and thinking is based in my heavy investments in XAU/USD, i live in Denmark and my investment currency is DKK.
What will happen if the XAU/USD over time, lets say 2-4 years, rose another 1000% and the currency crisis was topping.. meaning that my own currency was near death like some of the major currencies, US, UK pound etc.
I dont get it :crap: , will my money be lost down the drain together with the USD and my gold forex was just a dream :missy:
Should I exchange my investment currency to another? and which one?
-
Bardata needs an open, high, low, close, volume and timestamp before it is can be drawn like a bar, I'm sure you know the concept from OHLC.
A tick is just a price, volume and timestamp. But as I mentioned if you've 2 or more ticks then it can be expressed as bardata!! (all bar data is aggregated tick data)
-
Bardata needs an open, high, low and close and timestamp before it is can be drawn like a bar, I'm sure you know the concept from OHLC.
A tick is just a price, volume and timestamp. But as I mentioned if you've 2 or more ticks then it can be expressed as bardata!! (all bar data is aggregated tick data)
-
anybody know good book about tick barA tick can't be modelled into a bar, but a bar will consist of 2 or more ticks.
-
I just copied the script into PL-editor and pressed F3
{ jtHMA strategy }
inputs: price(Close), jthmaLength( 21 ), upColour(Blue), downColour(Red);
variables: Avg(0), colour(0);

Avg = jthma( price, jthmaLength ) ;

if Avg > Avg[1] then colour = upColour;
if Avg < Avg[1] then colour = downColour;

{buy sell Criteria}

if colour[1] <> colour then
if colour = upColour then
Buy ( "jup" ) next bar at market ;

if colour[1] <> colour then
if colour = downColour then
sell ( "jdn" ) next bar at market ;
What error message do you get?
-
MultiCharts fully supports EasyLanguage, I haven't found any .eld file which couldn't compile and work with MultiCharts.
Do a search for jtHMA here at TL, I'm sure it's located somewhere - otherwise I'll post a version for you

-
Well I'm not sure what you mean. I mean if you look at discretionary trading from an algo standpoint, the discretionary trader is basically forward testing and optimizing the most powerfull neural network software ever devised..Yes I can agree what that, but only to a certain degree. The human brain is also very complicated and even small insignificant things can affect the outcome in a negative way! Consistency is needed
That is vastly different than if your optimizer tells you to use a 21.22 and 51.054 moving average because its slightly more profitable than a 20 and 50 moving average.
No one should ever built a system that need that kind of optimizing, I think the main reason for this confusement is that the majority of new players at the market are overwhelming these times.
From trying to get into auto trading, I feel that at the retail level we are still stuck in the 90s while there have been huge advances in auto trading in the last 10-15 years. I totally agree with your multi strategy statement, our software should open up to a page that shows the portfolio of strategies and how they interact against real market data and purely random data. Instead we get alot of point and click strategy wizards and useless indicator optimizations.
The Market isn't random
 so why should one ever concentrate on building something at a unrealistic background, besides it would be fun :o
But I agree with you
-
Before one talks about The Holy Grail we need a clear and concise description, can anybody provide that?
I can share some of my thoughts in the meantime...
I believe that much of the money spent in algorithm trading is in developing user-friendly interfaces and also in developing methods for smooth and seamless distribution of large orders. I think it is extremely hard to keep as low profile as possible during distribution, the idea is to influence the market at least possible to obtain the best price.
Likewise the hardware storage costs alot of money - storing tick data can be extremely difficult both in hardware and software.
My guess would be that an individual can build a trading system and store data at a price around $ 100,000, this would cover 20-25 shares divided into 2 different markets. This is very detailed I know, purely estimations build from my experience. Now we can do some math... try to cover 50.000 different equities spanning 20 different markets - and this is only equities, take forex, options etc. Wuaaaaa what a bill
I am 100% sure that these things here cost huge amounts of money:
http://www.microsoft.com/casestudies/casestudy.aspx?casestudyid=4000002610
-
Hi all
Normally I use tick and volume charts in my trading, but I've recently started to look at Points Charts. I wonder why there's so little information and attention to those?
Can somebody tell me pros / cons of using Range Charts, personally I like them, it seems like they filter out the noise and only moves when there actually is some action
-
If you created a system, never did you optmize it at least for the best resolution? 1 minute / 3 minute / 1 hour / 5,000 contracts / 10,000 contracts?No I would never optimize/ curvefit a system, I would however be very careful to choose the right resolution, for instance 5000 contracts instead of 30.000 and so forth, as that would depend at the average volume in the particular equity!
You can't optimize for a bad chosen resolution, resolution adjustments isn't curvefitting, it's something that's necessary to get the swings clear and cut.
Bump:
How is that different than optimization?Optimization is a process that tests different parameter values as indicator input and one (person) can then choose which one that satisfies a certain risk/ reward.
I'm referring to a inside process in the indicator which weights past values and then dynamically chooses the best at the current moment.
-
Parts of this study are dynamic / self-adjustingBut it still needs optimization? And that's exactly the point where the system fails :doh:
Forget about optimization, curvefitting etc. Create a system that looks at different scenarios, weights them and then take the most accurates one at that particular moment in time

-
Let me tease you a little... Would a system only be profitable if you were the first to enter/ exit at the right moment? OR could you wait for others to lead the way?
spcul8r -> Isn't tape reading lagging?
-
Tresor-> What indicator wouldn't be profitable after optimizing? IMHO as soon as an indicator needs optimizing to give proper indications, then the life span of the indicator would turn out to be very short and the worst part, one can allways use an excuse for the incoming failure
An optimal indicator would consist of more than just simple OHLC calculations, but should take previous action into consideration and thereby be build as dynamic as possible, hence adaptive indicators rules
and optimization should be superfluous. But again.. it's just me :missy:
BTW: Just remove the name of the indicator, I'm sure no one can figure out the name
it's a lot easier to share when everybody share -
This is a collection of small and usefull functions from my library. I'll just post them as I write or review old ones
I'm using MultiCharts, but I'm almost sure that TradeStation users can compile them without any problems as both supports EasyLanguage.
***************************
Function: JK_Math_RoundToNearest
Just a small function from my library. I've discovered that RangeBars can give some funny open and closing values that needs to be comformed correct in order to write a pattern recognizer.
//FunctionName: JK_Math_RoundToNearest
//Summary: A small function invented for rounding numbers to nearest precision i.e. round 100.27 to 100.25 or 95.86 to 95.75
//Author: Januson Nov2008, rev.0

//Example: JK_Math_RoundToNearest(100.58, 0.25) -> 100.50

inputs:
	valueToRound(NumericSimple),
	nearestFraction(NumericSimple);


begin

var:
	double PRECISION(10000); //constant


	JK_Math_RoundToNearest = IntPortion(valueToRound) + (round((fracportion(valueToRound)* PRECISION) /(nearestFraction * PRECISION), 0) * (nearestFraction * PRECISION))/PRECISION;

end;
Bump: When I develop indicators I need to have quick and easy access to debug information, i.e. Why is this value that at this point? I therefore insert JK_BarDateTime in the if-then or other points of interest.
Example from indicator:
if condition1 and condition5 then
begin
... yada yada
print(JK_BarDateTime, condition1, valueXX);
end;
I can then use the output window to track debug info quite easily
//FunctionName: JK_BarDateTime
//Summary: A function to convert the EasyLanguage datetime information from current bar
//Author: Januson Oct2008, rev.0

//Example: Print(JK_BarDateTime);

JK_BarDateTime = DateTimeToString(datetojulian(date) + ELTimeToDateTime_s(Time_s)) ;
-
MultiCharts isn't second hand
-
Automated trading strategies is unfortunately soon ruling the market :shocked:
I would also like to hear some estimations regarding how many trades there actually are executed by a computer? A trading algo and some topnotch hardware should fairly easy do a better job than 100 traders. A trading algo doesn't need any sleep either :frustrated:
IMHO, there's so much autotrading going that the most difficult thing is to keep it secret, because the markets need to attract real people with money on thier pockets, otherwise the markets will go nearly nowhere. :boxing:
-
Many people don't realize what a system actually is before they sit down and try to program it. If you can't code it then you'll find yourself strugling with confusion. And that's why so many chooses the dicretionary approach, because a discretionary approach is flexible all the time
-
Hi Head2K
Is it an automated system you're talking about or you sitting there executing the trades according to some signals printed at a chart? Day or intraday?
If your system needs optimizing you should discard it right away! You should however develop a system to a standard stock, i.e. high volume most of the time. Forget about sideways or trending, when you think like that you're allready starting to see problems instead of solutions. If a stock is moving sideways, it just mean no money or at least less money, your system should react to this!!
I don't think one system will work in all markets or market phases.It is a loser coming to talk, allready preparing himself to get ripped of!! (Sorry, but you deserved that
)Whats a system then? A system should certainly work under all market conditions, you've to build the the conditions into your system i.e. don't trade between the first hour, don't trade the last hour or if volume is lower than 40% of normal HALT system, 3 loses in a row in a choppy market HALT or change observation period/ view / whatever.
I don't think the markets are evolving, but I think the people are.... they enter, they trade, they get some experience, they get more experience, they go away of one reason or another.
-
Hi Eric
I'm still waiting for an answer regarding the tick between initiator and fillers.
However I found this one: http://www.nanex.net/NxCore/NxCore.htm
http://www.nanex.net/OPRADirect/OPRADirect.htm
There seems to be a lot information regarding ticks
-
Hi zdo
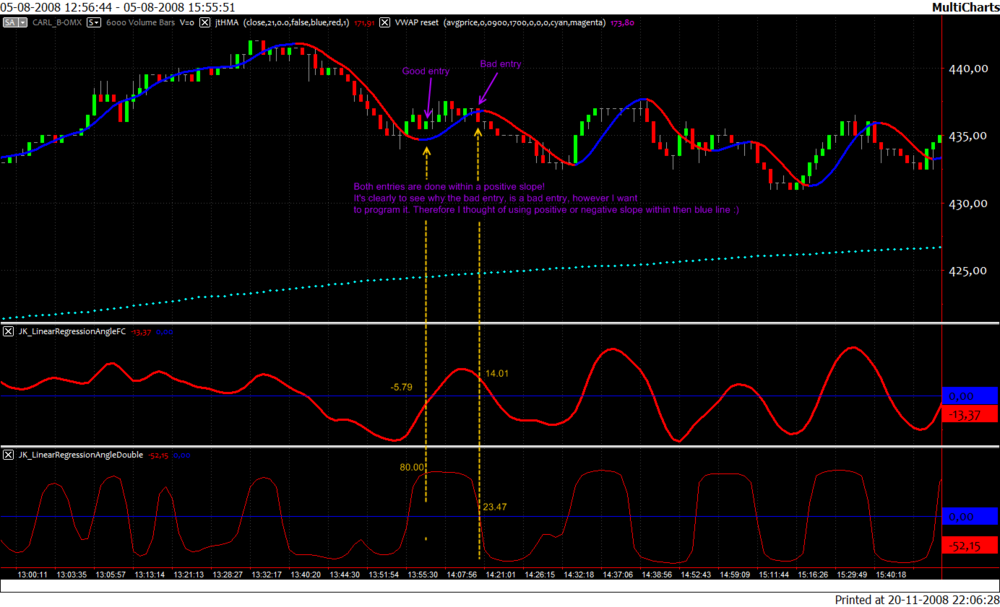
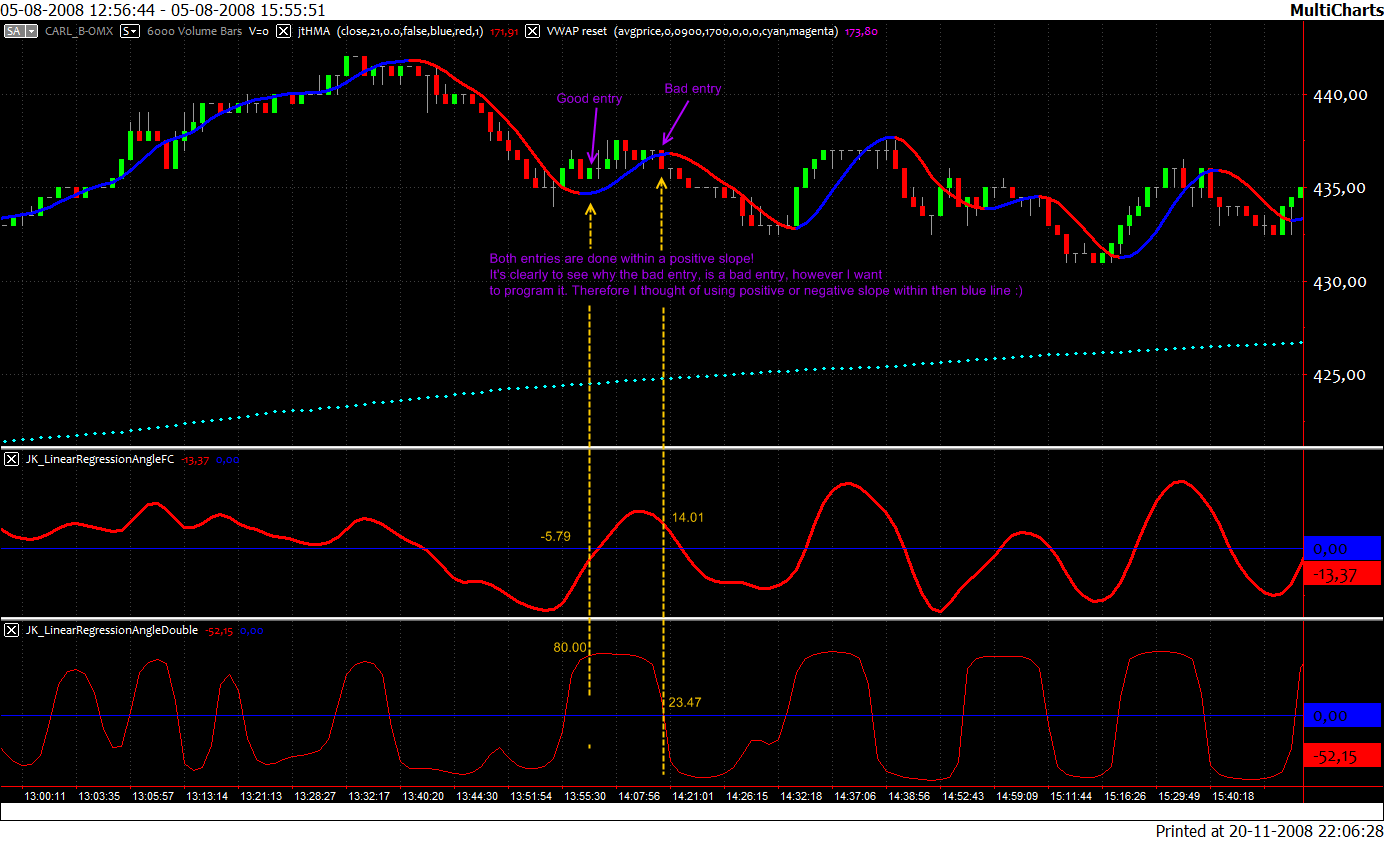
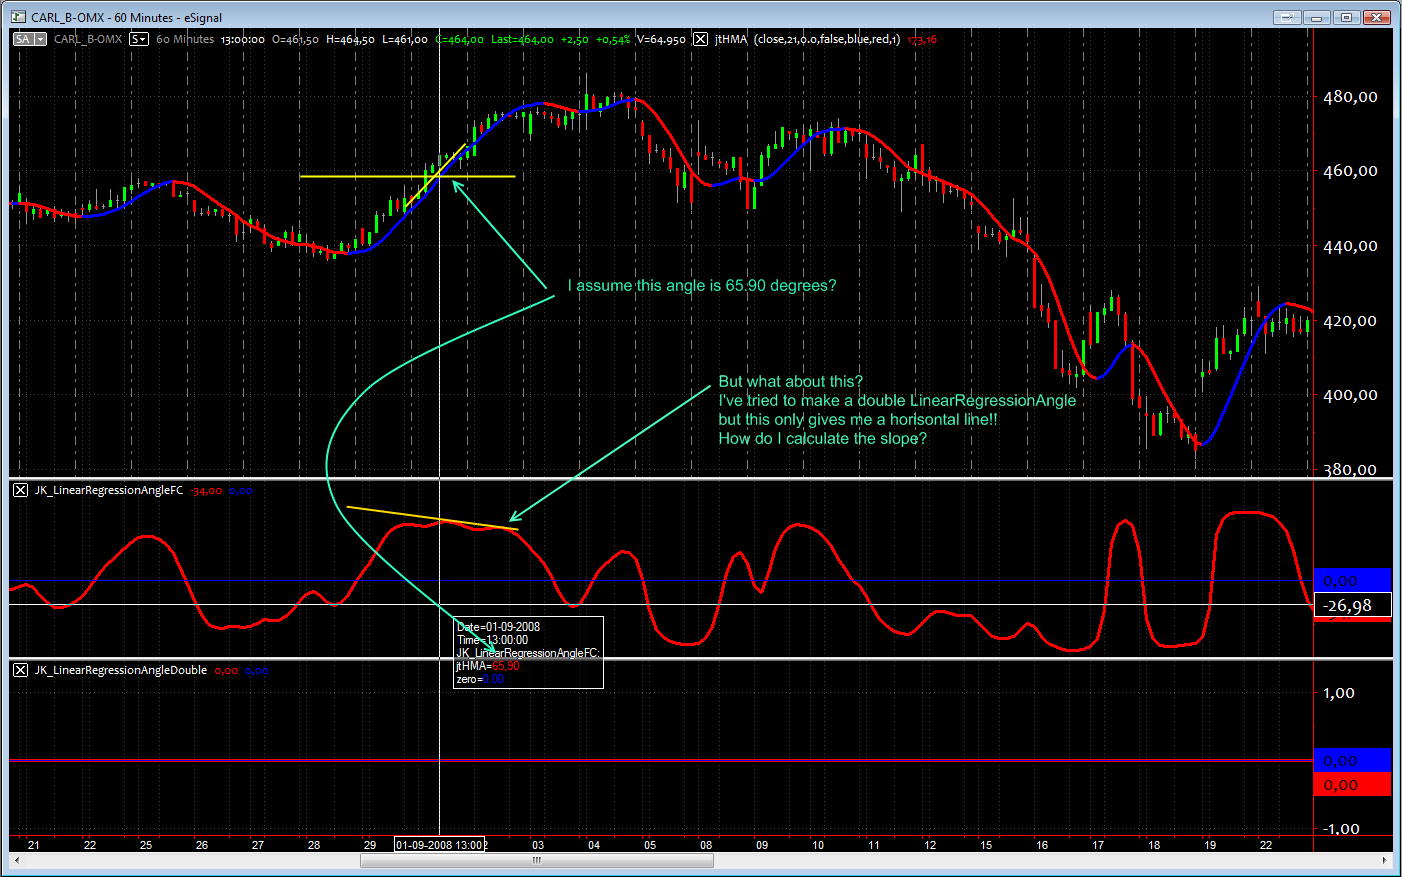
Thank you for your patience, I've created a screenshot, take a look.
As you can see there is a big difference between entering when the slope is negative or postive. And that's exactly what I want to analyze for timing entry and exit.
The double regression is a LinearRegressionAngleFC applied
Value1 = jtHMA(Close, 21);


value2 =  LinearRegAngleFC(value1,4);

value3 = LinearRegAngleFC(value2, 6);

Plot1(value3 , "LRAFC");
plot2(0, "zero");
This is only prototyping
What I wanted to create was an indicator telling me if we are in the beginning of an uptrend or in the end. I was able to get the double regression to work, I think it's the PowerLanguageEditor that sometimes gets buggy!
What do you think about it?
-
yeah , I refer to see as "confirm with eyes"u can clearly see when slope is positive and or negative
Yes okay.. I understand, but I need to program it into an indicator/ strategy
-
i thought you just wanted to know if slope was positive or negative ? You can see tha tjust from looking at the MA. However I guess what your looking for it the exact slope degree at a given point?Sorry to ask...
What do you mean be see? Is it "see"/ "confirm with" as with my eyes?
-
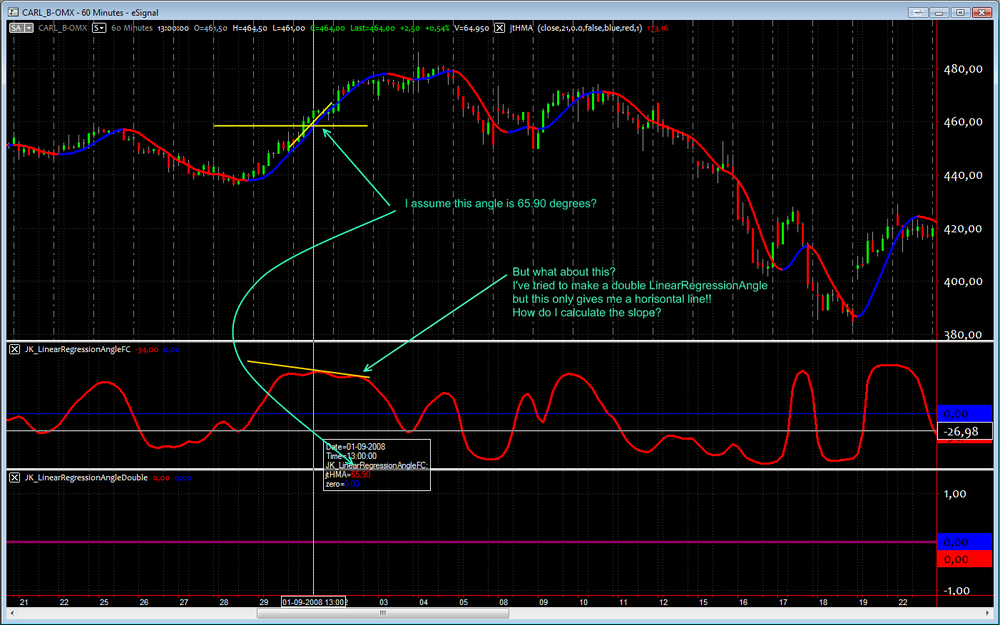
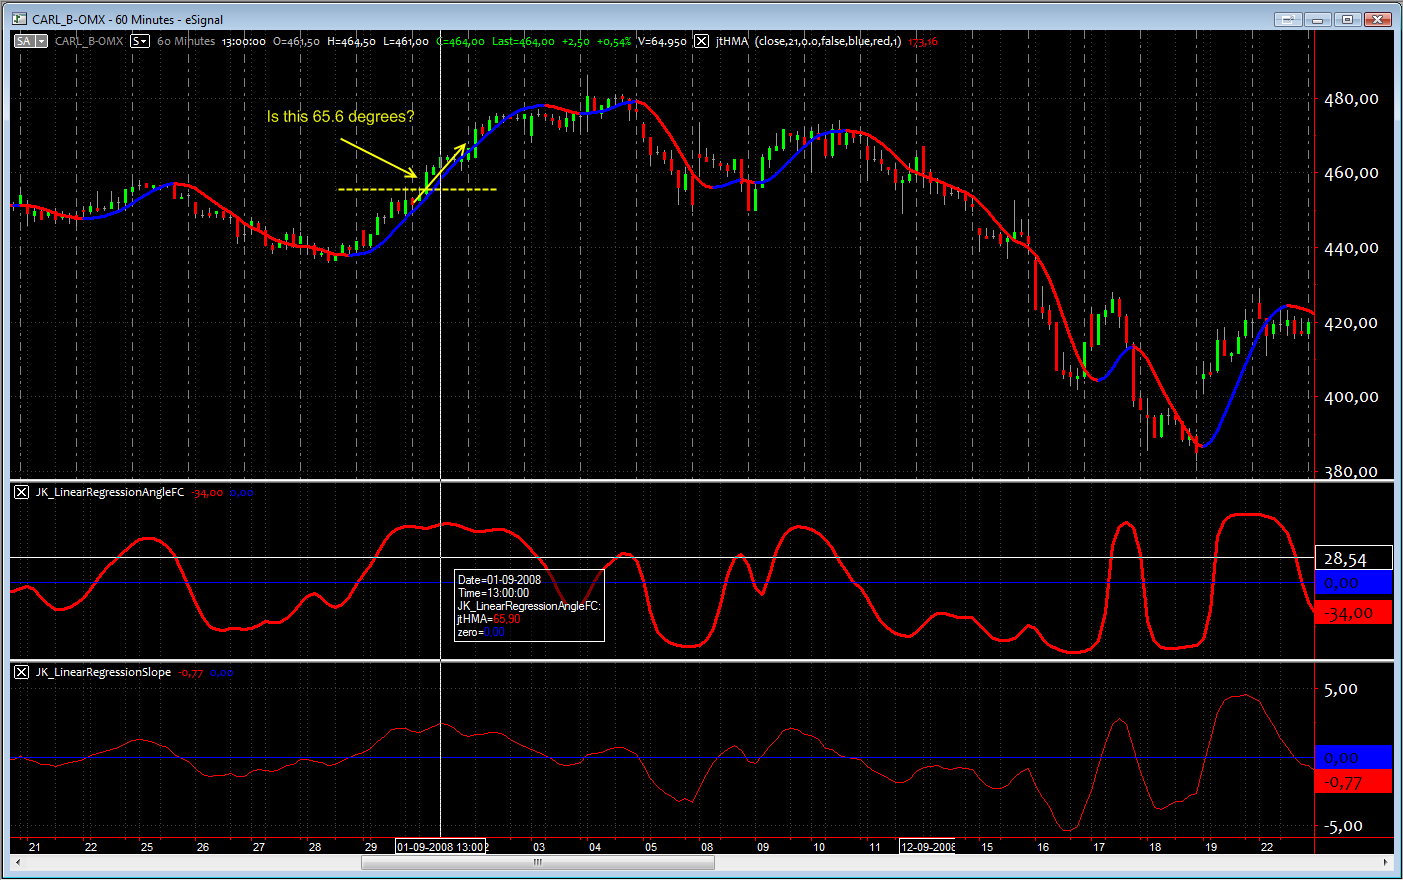
If you could help me here also, I would be a happy camper

Screenshot attached
Indicator: JK_LinearRegressionAngleDouble

Value1 = jtHMA(Close, 21);

value2 =  LinearRegAngle(value1,1);


value3 = LinearRegSlope(value2,2);

Plot1(Value3, "LRADouble");
plot2(0, "zero");
-
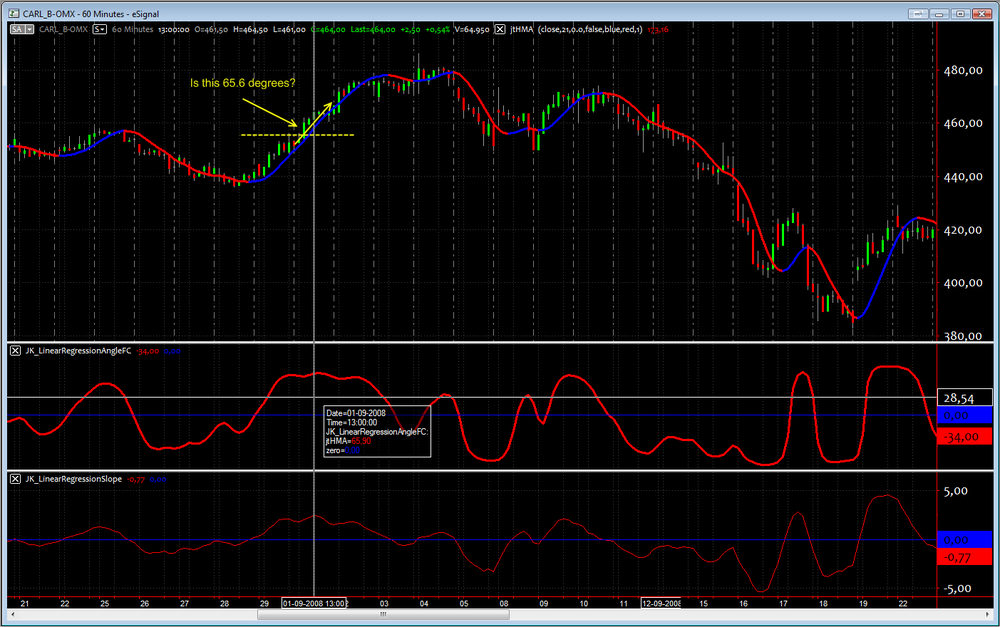
zdo-> Please take a look at the attached screenshot! Is this a correct assumption?
Currency Crisis
in Market News & Analysis
Posted
No answers
Anyway... I was thinking of some of the currencies in SCO-countries, maybe these will survive the inevitable capitalist meltdown.