
Welcome to the new Traders Laboratory! Please bear with us as we finish the migration over the next few days. If you find any issues, want to leave feedback, get in touch with us, or offer suggestions please post to the Support forum here.

januson
-
Content Count
107 -
Joined
-
Last visited
Posts posted by januson
-
-
All the indicators are based on that aspect, as this thread was introduced for the PBF replicas and that is what their indicators are all based on.I think I need a little help then.. could you point my to an indicator which takes volume into the equation? What is PBF?
I'll post KlingerGoslin as soon Im sitting in front of my trading pc..
-
lionelhhn, here is a jtHMA, which I use:
{jtHMA - Hull Moving Average Indicator} {Author: Atavachron} {May 2005} { Inputs: ------- price: the time series being smoothed, usually Close, High, etc, but could be RSI(Close, 25) for example. length: the length of the MA, pretty meaningless in the normal sense of moving averages, as this quantity is heavily modified in the code. You need to experiment, do not just use a setting of 20 because that is what works for you with Simple Moving Averages. zeroLine: if you are using this in an indicator pane, you might want to display a centre line of some sort, ths allows one to set its value zeroVisible: boolean variable, determines whether the centre line (zeroLine) is plotted. upColour: If you wish to differentiate upward movements by colour coding. downColour: If you wish to differentiate downward movements by colour coding. colourDeltaBar: Set this to 1 if you wish the colour change to be effective on the actual bar where the direction change occurred. Set this to 0 for default behaviour. All other values are pretty meaningless. } Inputs: price(Close), length(21), zeroLine(0.0), zeroVisible(false), upColour(Blue), downColour(Red), colourDeltaBar(1); Value1 = jtHMA(price, length); Plot1(Value1, "jtHMA"); If ZeroVisible = true then Plot2(zeroLine, "Zero"); { Color criteria } if (Value1 > Value1[1]) then SetPlotColor[colourDeltaBar](1, upColour) else if (Value1 < Value1[1]) then SetPlotColor[colourDeltaBar](1, downColour); -
I appreciate your work Blu-Ray, but I really miss the volume aspect. All your indicators are based upon price-> close, mid etc.
How about an indicator that only moved whenever the.. for instance; only counted whenever the volume exeeded the last 20 last volumebars at a MA.
Do you have any experience with the KlingerGoslin?
Again.. thx for sharing

-
I've allways knew about AP, but first untill today I wasn't aware of the stong belivers in the fork.
I'm not stupid, and likewise all other I can see that AP is working or at least supposed to be working if they are applied after the tradingday ended.
Somehow it reminds me of technical analysis with simple trendlines, allways striving to get the past lows and highs into the picture.
Don't get me wrong, I really respect the work regarding AP etc., but to be really convinced and withhold a strong case here at TL, I think it would be very interesting to see the AP applied and followed! - Let's say for example a swingtrading 14 days or something like that.
Please... do not take my posting as a negative feature, I just want some enlightening
-
After the first part of this thread I was planning to write out a detailed explanation with examples and illustrations, but this thread has taken a turnToo bad for me
 I started this thread to learn something
 -
Interesting
As my newbie post does declare.. I know nothing about MP, which was my first motive for asking.
I have alot of strange thoughts about the market and one that keeps pushing me is; How long does a specific price dominant the market? Is't based at volume or time or just market sentiment, well I don't know, but one thing I do know and have experienced alot of times is that: If a market maker want the stock price to go higher, so it goes. I simply cannot understand why a market is moving up, when everything says it should be down.
I have played around with Footprint from MarketDelta and yeahh yeahh, quite amazing tool, but does it beat the old fashioned pivots, volumes, candles and tapeticker? Or is't only meant te be a subsidiary to it?
Shouldn't the knowledged trader know how to interpret these signals, does he really need another tool?
I know what I would choose and that would be the skeleton way.... as much as nothing to get to the edge.
The edge is YOURSELF and has nothing to do with a fancy tool, the TOOL is yourself and your success depends of how well you EDGE THE TOOL
My point is that nothing can be predicted and all comes along when times go by.. certainly there can be market trends - intraday, day or week etc., but when all boils down the price is determined by the market and not by a prediction where and how the market should interpret the previous day in todays trading ie. Market Profile.
It would be a nice thought though..... but if the market was that and if the market was able to let itself to be described simplyfied as this, then the market would die a very non-heroic death IMHO.
I've seen selling to buyers on and on for a whole day, but still the price has been increasing.. I've seen buying and buying but still the price has been downtrending. For how peculiarly it may seems I've never seen a price evolve in another way than the trend. huh...

My point is that... why choose yet another tool to describe the market or better... why choose a tool to let yourself into a conception that the market needs a description!
-
I'll do that.. thank you
I think I maybe will put MP at standby for the moment, Market Statistics looks interesting.
-
Hi...
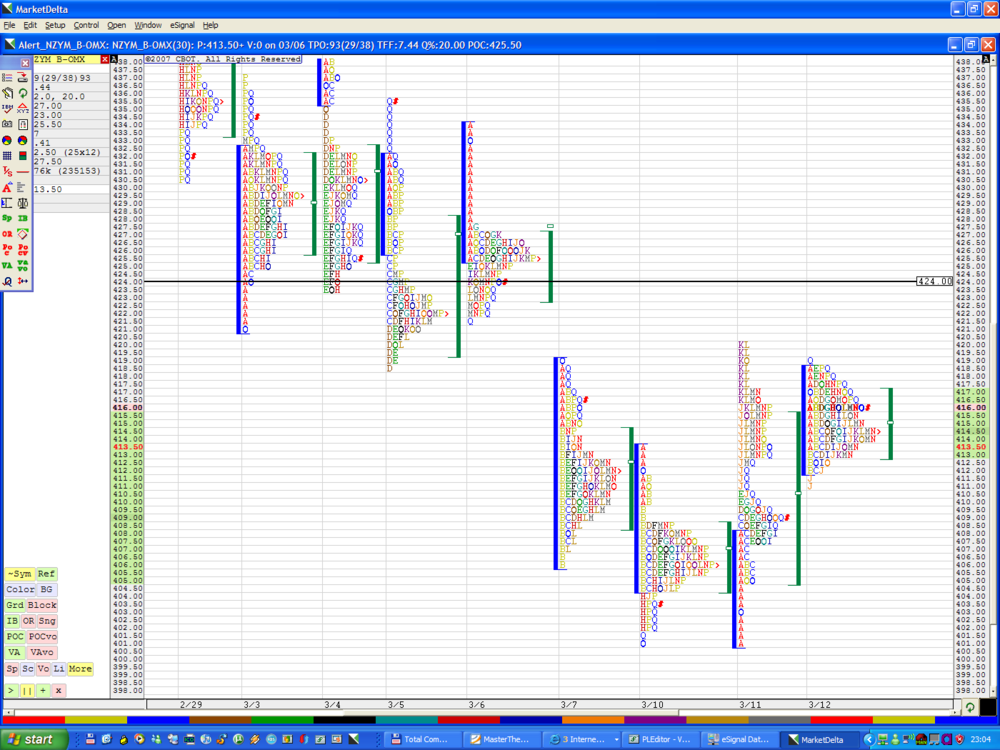
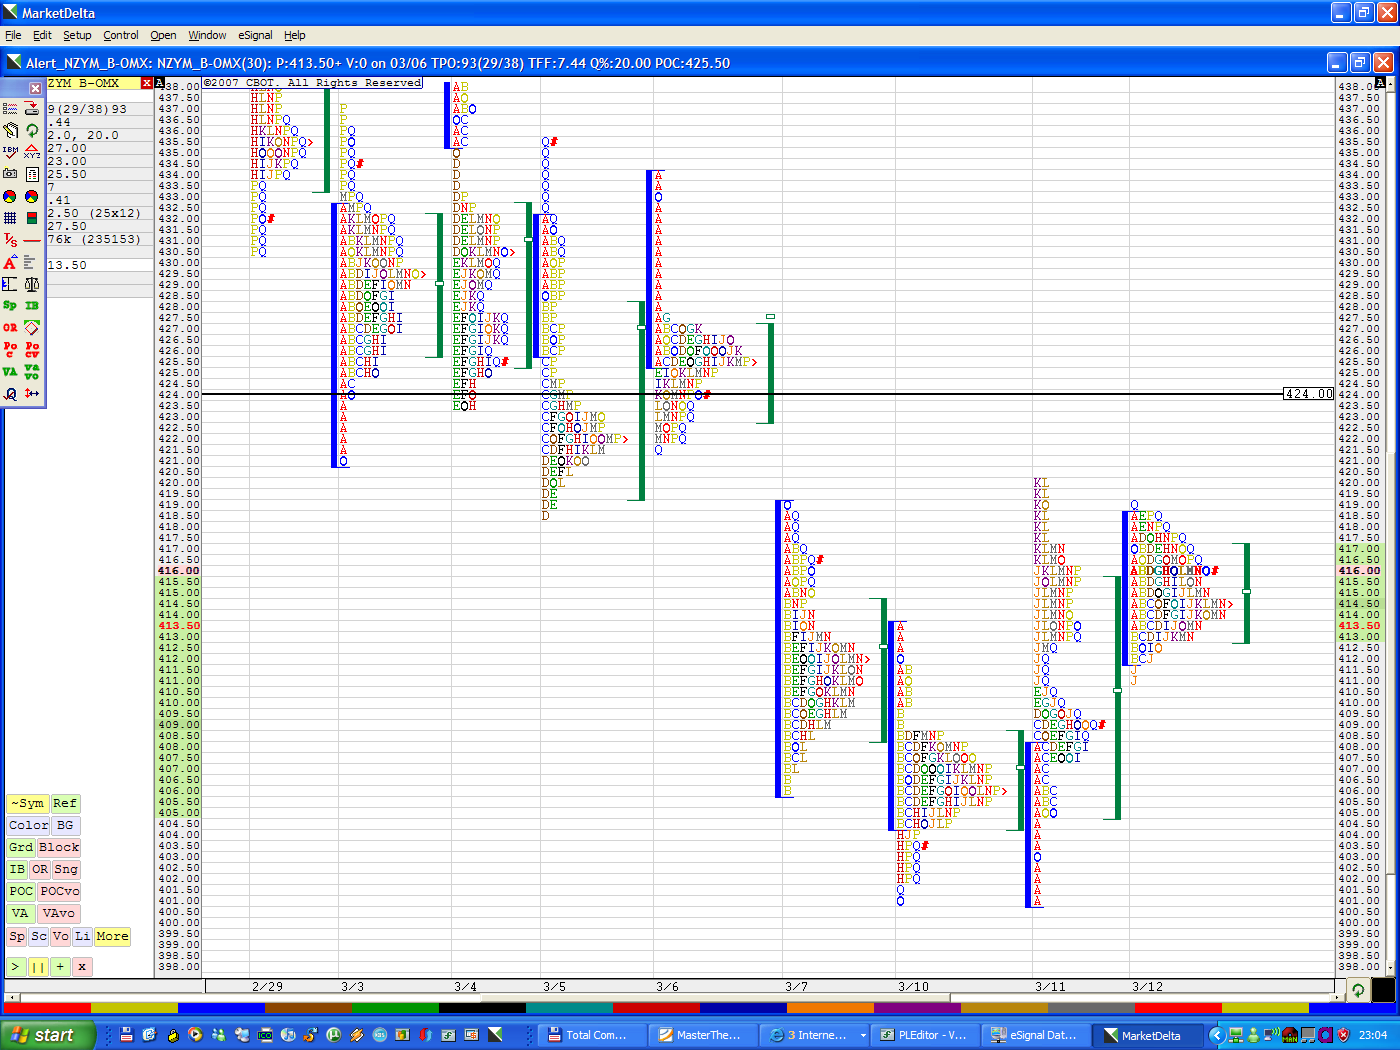
For the last couple of weeks I've been very interested in MarketProfile. Finally I took a small step, to download MarketDelta and play around with it just to get a feeling.
I'll will certainly have to read a lot, but I couldn't wait to start this up :helloooo: so....
But then it suddenly hits me... Is this doable in our stockmarket, Copenhagen OMX, Nordic Exchange.
I've attached a screenshot of Novozymes, could somebody be so kind to explain something of what I'm looking at and what I should be looking at :missy:
This is only intended as a small teaser for my self
You know.. something I can work my way out from, I learn best from examples that I can relate to!Kind regards
Janus
-
thrunner-> You are absolutely right, it was a scaling issue this time
-
hi again..
I'm using MultiCharts and I think the dots are misplaced, for some strange reason they are flying to high or to low. But it's nothing to do with your code, I've just created a support question at TS Support as it must be a bug in MC.
-
hi Blu-Ray
Thank you for this nice piece of work, I'm using it daily. However the dots are somewhat misplaced and I've looked into the code to investigate it.
Could you please tell me the reason for calculating the following:
HT=Low - NumberofTicks*mintick;
LT=High + NumberofTicks*mintick;
HT? LT?
Shouldn't the dot just be placed right under lowest or upon highest and if more than one dot then displace it accordingly?
Have I missed something here? :hmmmm:
Once again, thank you for your time!
-
Essentially Yes. Though of course you have to define exactly what a swing is to you. For a scalper it may be a 5 tick pullback for a broader time frame trader it might be the highest high in the last 5 10 minute bars etc. You have to be consistant and should pick something in tune with exactly what you are trying to measure.Ahh okay..
 I think I get it, so put in another way, the stocks essentially wave according to fibs undependendant the timeframe. So if one is looking for daytrades, would the fibs go from day high to day low.
 I know there's a lot of nuances besides this basic stuff, but things are getting clearer
-
Thank you all.. very nice comments. So to sum things up, I should move the fibs accordingly as the stock hits lower lows or higher highs.
So a fibtrader moves the fibs as the day goes on if needed...
But that will eventually means that older support/ resistance gets ignored and replaced by new? Have I missed something here?
Thanks for the links
-
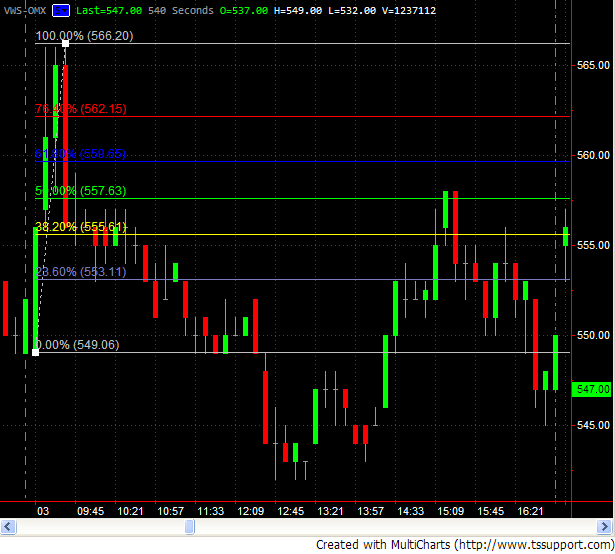
Hello
I'm trying to learn something about fibonacci retracement lines, but sometimes I get a bit confused.
Please take a look at my screenshot, fibs and fibs1. Fibs is without any retracement lines and fibs1 is my confusement :helloooo:
I don't get it, how should I draw the fibonacci retracement lines? Or should I even use them in this scenario?

-
Okay....
I've now tried this approach for 2 days and I feel more relaxed when I'm in a trade. I've now eliminated everything except the index for OMXC20 which is the major index for 20 of the biggest stocks at Copenhagen Stock Exchange. I use it just as an overall market sentiment - hopefully I can get rid of that in the future, :o
Hlm-> Yes that's exactly my point... The charts tell me everything, price action and volume. No fuzz...
just the real thing. -
Hello...
In my constant search for the perfect trade I've tried to eliminate external noise as much as possible. It started with total elimination for diverse recommendations for price targets, you know.. strong buy, conviction lists etc., then I eliminated all financial expectations etc. Of cause things like cnbc.com-videos etc. are banned in the trading hours. I often amuse myself watching Cramer and so forth, but only in my sparetime.
Well.... I live in Denmark CET+1, the US markets open 1.5 hours before our exchange closes Nordic - OMX; Sweden, Norway, Denmark.
In the tradinghours I've a suspicion that the market follow the US futures very closely, in particular NQ fut and S&P fut. I'm not sure if that's their real names?
However.. for each little upstep or downstep it looks like we follow them, for instance.. in the morning 09:00 our time (your time must be 3am) if the futures are negative then.. uhhh... we open lower and vice versa.
I'm thinking of eliminating every external noise, so the futures must go down the drain also. And so must some of the other indexes also i.e. Swedish Index.
Anybody else in out there, who only concentrate about the trade, the whole trade and nothing but the trade. And ignore / close out everything else?
BTW... I rarely hold my positions overnight.
-
I use MultiCharts from TSSUPPORT.
-
I use both tick charts, seconds, minutes and day charts.
My main attention goes to 540 seconds, if that looks ok, I determine my entry point from a tick chart. The minute chart I use 53 min as resolution, which give me an excellent overall view of the main trend. I use the day chart to indicate what kind of trade I should primarily take, short or long.
I would also like to mention that different resolutions, sure gives different candlesticks and thereby also different patterns. So allways remember to use different charts to be sure of whats going on
oopss.. forgot to mention that a tick actually is a trade, either to buy or sell side. Don't confuse a tick with a quote
-
Welcome...
-
I can sell you Wealthlab Developer Pro: http://www.wealth-lab.com/cgi-bin/WealthLab.DLL/getpage?page=WLD3.htm
I don't use it anymore or rather, never has... Im having trouble with med stock exchange and the datafeed (OMX-Nordic)
-
Hi Abe
I'm a newbie like you, take a look at what I posted for 8 months ago: http://www.traderslaboratory.com/forums/f25/the-most-stupid-tradingday-ever-1454.html
I started with $10000, lost a lot :crap:, pumped in another $6000 and at the moment my account is as low as $1000 (it has been lower)
In addition to that I'm paying for different tradingservices (quotes, software), that costs me $100 a month :haha:
I won't even try to guess how much time screentime I've used.
But I'm learning alot from this site by reading what other does, I've also read a lot of books - the current book I'm reading "Your Money and Your Brain"
Well... I'm still in a good mood and I know I'm getting better, but damn it costs alot of money and a lot of frustrations. The frustrations are getting smaller and my my optimism is growing.
The time I read that it's normal to blow up your account I thought yeah yeah... that's because blabla... I'm better than the most, so that couldn't happen to me.
Well it did :doh: , but I've learned a lot by that (risk management, trading psychology, fear, greed, humility) the most important thing i've learned is that's it not easy, I'm still learning, but I'm getting a bit more clever for each hour, who know.. maybe some I can call myself a trader.
So don't worry, keep up the spirit and if you're willing to learn (you are otherwise you won't be here) then things will comes to you
-
Hello
I'm using MultiCharts, it works perfectly (IMHO) and after their latest release the performance is okay - it uses alot of ram (300kb) but that is maybe because I have 6 Workspaces each with between 2 and 4 charts
I've only seen TS at videos, TS is a much more mature work - no doubt about that, but TSSupport is ongoing in the developing MC, besides that, they are very nice in their forum and listens to new ideas for whatever feature you want.
-
Payback time...
Hello, just stumpled across this old post, where I was the thread starter. Back in marts 2007 I actually followed the advice for MultiCharts, I downloaded a trial version and bought the application later.
It ran a bit slow in the start, but later TSSUPPORT released a better optimized version and now they've just released version 2.1.999.999, 18 September 2007. This version is very quick I can tell, it calculates indicators in a rush and never chrashes or freezes

I'm very happy for this product, it suits my needs perfectly and the price was actually ok also. I paid a one time fee for MultiCharts and signed up with eSignal for Nordic OMX Exchange (Copenhagen and Sweden Stock Exchange). The Esignal subscription costs me $115 in monthly fee.
Im just a happy camper...
-
Hi torero, thank you for your response.
But my question was primarily targeted for webbased charting like the previous mentioned StockFetcher or the one from investing.businessweek
Various Indicators (Squeeze,2FastMa's,etc)
in Trading Indicators
Posted
Blu-Ray-> I use KlingerGoslin together with a volume based chart. In the attached screenshot there are 3 entrypoints, highlighted in green. A strong signal is when both the TRIX and KlingerGoslin is below the zeroline.
For some indicators I think a volumebased chart gives a much cleaner view, , but also the candlestick patterns are easier to read