
Welcome to the new Traders Laboratory! Please bear with us as we finish the migration over the next few days. If you find any issues, want to leave feedback, get in touch with us, or offer suggestions please post to the Support forum here.


thrunner
-
Content Count
316 -
Joined
-
Last visited
Posts posted by thrunner
-
-
Welcome to the forum. I don't use this indicator so I am not familiar with all the nuances.THRUNNER - How can we make the signal dot smaller, to help us see the histogram when it is just above/below the zero line; is there a parameter for that? Thanks.Gumphrie is the author of the Ninjatrader (NT) BBSqueeze, but he probably doesn't use this indicator in his trading. He may be able to answer some more questions over at the Ninjatrader forum: http://www.ninjatrader-support2.com/vb/index.php
Meanwhile, the NT histogram plots can be reduced in pixels (from 9 to 2 px) and the Signal and the Squeeze values visualized by setting thier plot values in the indicator panel.
The tradestation TS indicators can be obtained by doing a search or directly:
http://www.traderslaboratory.com/forums/f46/bb-squeeze-replica-for-tradestation-662.html
Blue-Ray has a very nice version here: http://www.traderslaboratory.com/forums/f46/various-indicators-squeeze-2fastmas-etc-3688.html
-
Thanks. Good read with the transcript.
Session 6. Efficient Markets vs. Excess Volatility
Brad Barber and Terry O'Dean were professors at UC--at different campuses of California--teamed up with some economists from Taiwan and looked at data of--they got really good data from Taiwan about day traders and their actual returns. Day traders are people who trade everyday in the markets and they found that there was a really predictable pattern. The young people--they start in as a day trader and they quickly lose everything; they lose badly because they're trading too much and they really can't predict the market. There's like 1% of them, though, who seem like they can actually beat the market. This looks like really good for efficient markets. They found that there are some Taiwanese people who know how to beat the market--1% survives and stays in. Is that contrary to efficient markets? Well, it does seem contrary because they found that a small number of people did find some forecasting rule and succeeded. On the other hand, none of the--hardly any of them got really rich and so it's very rare--Warren Buffett is an extremely rare outcome. So it's--I guess, when I talk about efficient markets I want to help prevent you from suffering under any delusions about your forecasting ability. I don't mean that Warren Buffett can't do it or that you can't do it if you develop yourself into a Warren Buffett. -
This is probably what you want:
^TTMSlingShot_SvE 10 and 20 EMA w BB
Basically you are using faster periods (10, 20) on a slower Moving Average (EMA) versus slower periods (32.4, 61.8) on a faster MA (jtHMA).
Using the Sevensa (_Sv) version of eld here because that has less problem with TS candlestick plots than the non-Sv version.

-
-
-
Not sure about the floating point error. You may have some spurious data problem with 'Close' of @YM that caused the jtHMA function to fail - not sure, just a guess, try Ctrl-R to reload data or try a smaller number of bars back (try 1500) or try earlier start date for the data.
Here are some links and references that may be helpful to you if you are just beginning to learn EasyLanguage:
Introduction to EasyLanguage Tutorial
Introduction to EasyLanguage Online Seminar
EasyLanguage Books ("Getting Started with TradeStation EasyLanguage", “TradeStation EasyLanguage Reference Guide", and “EasyLanguage Boot Camp”)
List of EasyLanguage Reference Posts
Demonstration Code: A source of demonstration code is the EasyLanguage “work area”, the body of strategies and analysis techniques the EasyLanguage code for which is included in TradeStation. This code can be opened and reviewed any time by following the File -> Open EasyLanguage Document menu sequence.
Third-Party EasyLanguage Specialists Directory (This link takes you to a web page hosted by TradeStation Technologies, Inc., an affiliate of TradeStation Securities, Inc.)
-
Before spending $7500, you should research this on the Tradestation forum under the Clayburg DDF thread by Stratman which has some equivalent free open source code and discussion on the profitability and backtesting. I am assuming you are already a Tradestation user and have access to that forum because the Clayburg system ran originally on TS. It is worth a free trial of TS just to read all the discussion and get a more skeptical and independent view of some of the systems out there. Don't just accept some backtesting by the vendor on a relatively short period and expect the walk forward testing to validate their assumptions.Anyone here use Clayburg's Universal system of cluster system? I am thinking of buying one of the systems and wondered if others have found the systems profitable?BTW, Dr. John Clayburg is a Doctor of Veterinary Medicine (DVM), not that there is anything wrong with that, except it did not give him a particularly special insight into trading system development.
-
-
Thank you Sevensa. You just saved these guys about $400, lol. I can't believe JC can sell a moving average indicator for that price, it is amazing what a catchy name and a little marketing can do.
Attached please find two versions of the Slingshot. The one shown below in the lower panel is Sevensa's version with trendlines as histograms. I would rather use plots in TS for something like that as it is about 10x faster in code speed and the plots are a little cleaner. I would also use jtHMA (Hull Moving Average, open source) as the moving average instead of EMA - I took the liberty of changing the code; there is still an input option for using EMA.
The second version is similar except it used plot histogram and jtHMA plus an option for Bollinger band around the 'medium MA' with the option of turning off the plots.
These 2 indicators are named as ^TTMSlingShot
-
I think the OP was asking about going from TS (Tradestation) to TOS. IMO, the two platforms are totally different.
TOS is ThinkorSwim, somewhat of an options oriented brokerage. I had an equity account with them a while back. I didn't really find them very useful and while the platform had some useful options tools, it wasn't very programmable. They had a rudimentary autotrading system based on a list of proprietary signals generated by services such as Redoption, which is one of their subsidiary. Some of their affiliated signal providers were awful, but TOS do this in order to promote their platform.
Customer service was slightly above average, but not much more. They didn't have a very good futures trading platform.
-
http://www.cmegroup.com/tools-information/build-a-report.html?report=dailybulletin
Prior day daily data may not update until next trading day.
Use 1440 min @ES.D or @ES for volume on TS if you are having problem. However, there is no Open Interest on the 1440 min and the @ES.D daily OI is still stucked at 3031805.
For @ES 1440 min, they matched ST's data:
11/13/2008 4447242
11/14/2008 3366942
Date	           Time	High	Low	Close	 Volume          Volume2
11/13/2008	1615	913.75	816.75	908	4125941	4449284
11/14/2008	1615	918	860.25	860.5	3062163	4449284
-
Welcome to the forum.
You may want to read 'Bollinger on Bollinger Bands' first:
FYI, JC is not the originator of the 'Squeeze' other than renaming it. It was nickm001 and eKam who coded it in 07/18/2003 00:49:52 as Indicator Name: NickMBigMove and NickMNxtMov on the Tradestation forum
https://www.tradestation.com/Discussions/Topic.aspx?Topic_ID=14439
(requires forum access).
JC merely ______ it. Replace blank with approriated, stole, commercialized, profited, absconed ....
Most traders are awared of the 'Squeeze indicator' and there is no need to start multiple threads on them, and links to the commercialized versions may be inappropriate as some may mistake the action as spamming the forum.
Blue-Ray is the resident Tradestation EasyLanguage expert on this forum and he has graciously coded many open source indicators here, some of which included the squeeze: http://www.traderslaboratory.com/forums/f46/various-indicators-squeeze-2fastmas-etc-3688.html
-
It is attached in this forum.
http://www.traderslaboratory.com/forums/f56/ts-tick-by-tick-pvp-plotted-3647.html#post32651
-
Inverse correlation of SP500 to Intrade Obama does not imply causation. One may propose that the SP500 is down because Obama is getting elected or that if SP500 is higher, McCain could have been elected, both could be valid hypotheses, but both could be wrong. Both may have nothing to do with the ultimate outcome of the election or the economy.
No, BF, there is no hypothesis or prediction on my part on market direction; just pointing out the lack of causation.

-
It is interesting how easily some pundits/traders will assign market movements to political events, calling this a Obama ralley or McCain ralley. The market will move where the majority thinks it will move and the majority says the market is overbought now and may stay overbought for a little while longer until they have an excuse to run it up or down again, whoever wins or loses.
-
You can of course calculate your own with Ninjatrader and the free indicator authored by SBGtrading here:
http://www.ninjatrader-support.com/vb/showthread.php?t=4466&page=4
Ninjatrader is free for charting and simulation trading if you have a compatible data feed.
-
Jing, a subset of Camtasia by TechSmith that is free and complimentary online storage.
http://www.jingproject.com/faq.asp
TechSmith is pleased to announce that Jing is an official product offering. Don’t worry, it’s still free. We are also including a complimentary Screencast.com account with 2 GB of storage and 2 GB of transfer bandwidth per month. -
-
spyro,
Are you Frank Chris of http://frankeasylanguage.blogspot.com/ ?
Perhaps you can explain some of these indicators if you are and how you are using them.
BTW, most of Frank's indicators are Pacific time so most users will need to convert them to Central or Eastern time zone.
-
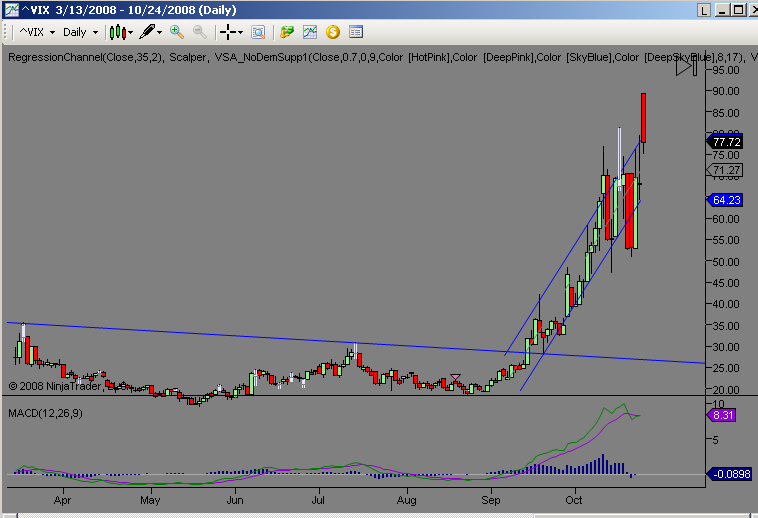
The VIX opened at a record 89 this AM with the US stock indices limit down. Everybody calls the VIX the 'fear index' as if the market is getting fearful. It is more likely that volatility is being artificially manipulated by the hedge funds and investment banks due to the recent credit deleveraging. In the absence of high leverage, one way to make as much money is to create chaos, fear and volatility in the markets - generating 'fear' but also similar income as a less leveraged position.
What do you think? Is there an inverse relationship between leverage (IBs margins at previously 30:1 before deleveraging, now down to perhaps less than 10:1) and volatility? Some would argue that the high volatility results in deleveraging or the lack of margins, but could it be the other way around for the larger players?
Looking for them to break the VIX before this is over; they have pretty much broken every other indexes.
-
It would be more helpful if you just give specific examples, such as name of instrument eg @ES, 3min, 1500 bars back, name of strategy....
In general, the lack of signals is due to the lack of number of bars in the study. Try using more bars and format the strategy, Properties for all to use max bar study will reference to eg 100, 150, 200 etc. It is also possible that your strategy just doesn't generate any signals for the given period.
-
not relevant to topic.
-
// compare this to TS's MA default 9 period
inputs: period(9);
var: 	MA_Sum	( Summation( Close, period ) ) , FMA(0);

{  BF's code
if {barnum} currentbar > period then
begin
FMA= FMA + Close/period;
FMA= FMA - Close[period]/period;
end;
}

MA_Sum = MA_Sum + Close - Close[period] ;
FMA = MA_Sum / period ;

plot1(FMA);
extensive testing have been done: https://www.tradestation.com/Discussions/Topic.aspx?Topic_ID=74179
-
There are bankers and there are bankers.
The majority of bankers making $US 100 thousand or less probably had no idea what risks their banks were taking on, while most of the CEOs, CFOs probably did and were willing participants. Margins take on risks as well as potential profits and the CEOs were eager to have their big payday and many did and some were smart to get out as Hank Paulson, the present US Treasury secretary did in 2006 with a take of more than $US 500 million from Goldman Sachs (tax free, because US laws allow tax free divest selling of stocks when you enter US government by appointment).
In 2004, the SEC allowed the major US investment banks to take on debt much higher than previous levels after the 5 major IBs lobbied for the rule change:
They wanted an exemption for their brokerage units from an old regulation that limited the amount of debt they could take on. The exemption would unshackle billions of dollars held in reserve as a cushion against losses on their investments. Those funds could then flow up to the parent company, enabling it to invest in the fast-growing but opaque world of mortgage-backed securities; credit derivatives, a form of insurance for bond holders; and other exotic instruments.This is probably the single most damaging change in regulation that prompted the ultimate collapse or reorganization of all the US investment banks. Initially, their earnings exploded upwards, but no parabolic market is sustainable. Only 3 short years later the market collapsed and basically they all got margin calls, together with many of their partners in the hedge funds.
The present situation would have been a lot more manageable if they only took on debts at less than 10 to 1 instead of the 33 to 1 or even some at 60 to 1. So it is not the mortgage lending that directly led to their collapse, but the leverage that they took in the collateralized lendings.

Sling Shot and Trend Replica
in Trading Indicators
Posted
I don't use the Jurik, so I won't be able to include the ELD, however you can edit the code and verify it on your TS setup by doing the following.
1. Under the Input section, add:
Inputs: LongAvg(20),
MediumAvg(10),
ShortAvg(5),
Phase (50),
2. Under the code .. If UseXAve change:
If UseXAve then begin
LongMA = JRC.JMA.2k(Close,LongAvg, phase);
MediumMA = JRC.JMA.2k(Close,MediumAvg, phase);
ShortMA = JRC.JMA.2k(Close, ShortAvg, phase);
end else begin
LongMA = jtHMA(Close,LongAvg);
MediumMA = jtHMA(Close,MediumAvg);
ShortMA = jtHMA(Close, ShortAvg);
end;
Alternatively....
The following code should verify properly if you have Jurik properly installed. To create the new indicator by clicking on the 'EasyLanguage' icon on the left panel and choose create new EL document, then choose new indicator and name it something like 'TTMSlingShot_J'. Select all the code below and paste it in place of the new EL document. Then press F3 to verify. Apply the new indicator onto a chart. Notice that the UseXAve input is by default to 'true' and now uses the Jurik moving average.