
Welcome to the new Traders Laboratory! Please bear with us as we finish the migration over the next few days. If you find any issues, want to leave feedback, get in touch with us, or offer suggestions please post to the Support forum here.


jimbo320
-
Content Count
90 -
Joined
-
Last visited
Posts posted by jimbo320
-
-
I see no reason why a forex future should provide a valid volume profile anyway. Not so sure about the TPO letters though.
-
There is certainly benefit is doing a volume analysis on a forex future. I see no reason why it shouldnt represent high/low volume areas as per normal concepts. Not sure if the TPOs are of benefit though.
-
Hello,This is my first post here. I found this thread really interesting but the site atrader.org seems to be down. Any reason for that? I am learning how to trade using MP and I think this tool seems reasonably priced. I wish I could get to try it...
-
There seems to be some confusion.
During early beta test the product was completely free hence the post from thrunner a few months back. What i meant by the last post was that the product was going to be free for another beta period.
Of course one cant live on fresh air, i know the general public would like it for free and i would like to give it for free.
As thrunner suggests there is authentication and after the beta period is deemed successful the free use is pulled. Hence to keep using the product there is a small fee 11.95 per month, or a outright licence free. If you sign up through infinity futures you get a reduced price. Contact them for details.
There is no tiering of pricing. Nothing is deemed a premium feature. Why people charge $100's of dollars for a product is beyond me. That seems a rip off. I suppose its becuase they can, because there is no competition.
Download it and see, you have nothing to lose. Make comments suggest improvemements, im a good listener.
Yes there are single distributions, multiple distributions, tpo charts, vwap and block charts, independant charts.
The road map is as follows, i dont like indicators, there are a few there but im not adding more. What i have in my sights is some sort of programming interface for drawing custom stuff and user strategies for trading off charts.
Hope this clarifies.

-
Anyway i think we got a bit off topic. For those who want to try again, or try it for the first time, its free again from Oct 3rd.
Rgs,
-
Of course, just about everything ive added to atrader has been at the request of a user. Thats how a hobby becomes a business.
As regards, the other stuff. But the backfill is not part of the open api.
The open API is what developers can use. That gives real time data only. What ninja do with their datawarehouse is another part of the system and not part of zenfire.
Maybe im wrong but when i added the zen api there was no historical api. Maybe someone knows where the access to the historical api is?
Anyway, Zen is not a primary API for me. Its a simplistic API and was something i could add quickly.
Most users Zen users use NT and dont need anything else and the cost of zero helps...
Thanks again.
-
I'd just like to say I demo'ed this software and it's really not ready for "prime time". Before the latest release this weekend, I couldn't even get the software to run (yes I installed the runtime package).After finally being able to run the software, it took a few minutes for me to setup my connection to IB & Zenfire. It wasn't 100% intuitive but the video tutorial on the ATrader website did help.
I didn't quite understand the purpose of having IB for historical and Zenfire for real time charting (as you can pull historical ZF quotes, just not the full Bid/Ask quotes). Since IB doesn't run on the weekends and forces a shutdown each night, this is a real big hassle. Maybe I just misunderstood how this part works.
I'm not much into indicators but there are a decent selection for those into it. I was searching for a good tool to display volume distribution profiles and ATrader does a good job. No real complaints but I wasn't really "wow'ed" either. Scrolling the charts is done via the keyboard, which I presume one could get used to but the lack of scroll bars and to be able to click & drag to move around & zoom was a little disappointing.
It appears there is an annoying "register now!" reminder that pops up pretty frequently, which obviously won't be a problem if you register.
For me, the software just isn't enough for me to shell out the money. It definitely has a "low budget" feel and unless it addresses some key data connection (mainly directly feeding of ZF for live & historical charting) and user interoperability (installation, hotkeys, charting) issues, this tool has very limited advantages to any of the established platforms out there.
Just to add, what I did like was the volume profile capability, multiple supported data feeds, the integrated ability to upload charts, and of course the low cost.
Thanks for the comments.
Just a couple of points.
Zenfire doesnt provide a historical API for backfill AFAIK if im wrong please point me to the url. I think you are mistaking this with Ninja that stores its own historical data.
You are correct there is no scrolling around charts using the mouse aka drag and drop so far, but i wasnt aware that was the deciding factor on whether something is considered low budget. But a lot of these quirks have been addressed with the quick nav toolbar in v2.0.6.1. If a lot of users consider this be be very important then it will be addressed, so far only a couple of people have mentioned it.
Anyway i think its a good product considering i wrote it as a hobby to help my trading.
Thanks
-
This is free again from 3rd October.
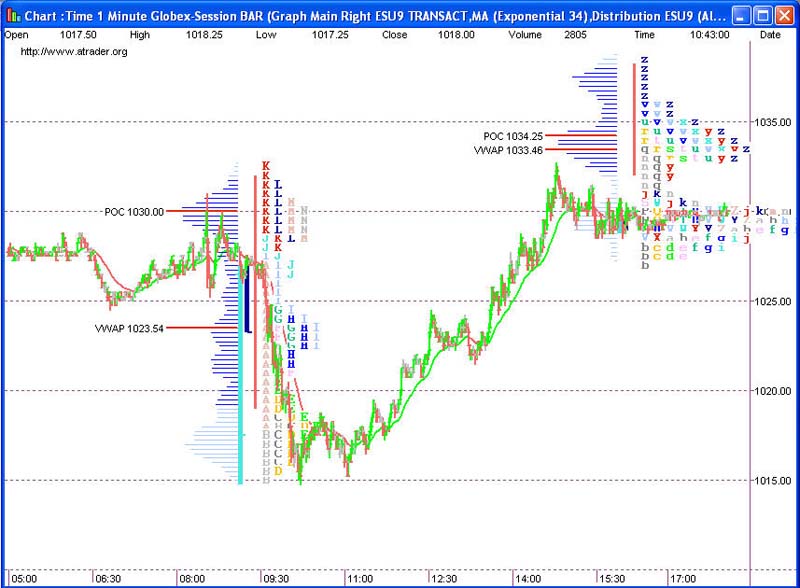
Now has VWAP and numerous UI/GUI enhancements and much improved performance and stability. Works now with IB, Transact, Zenfire and DTN data feeds.
-
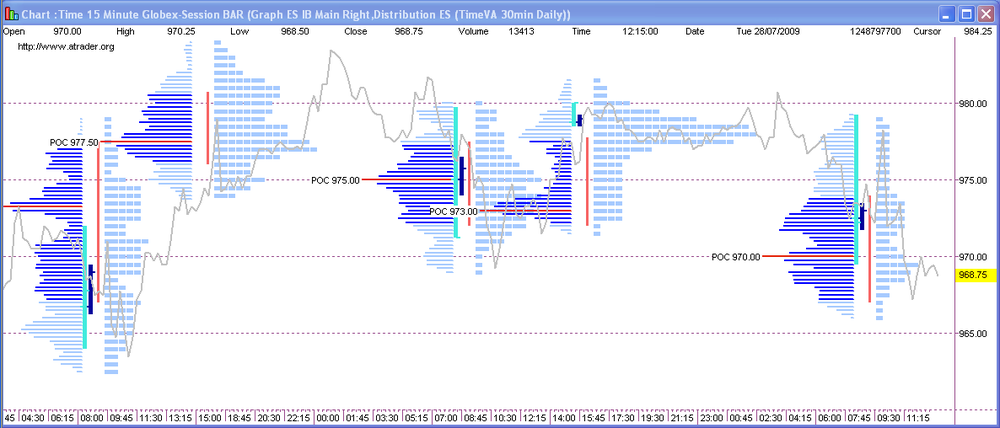
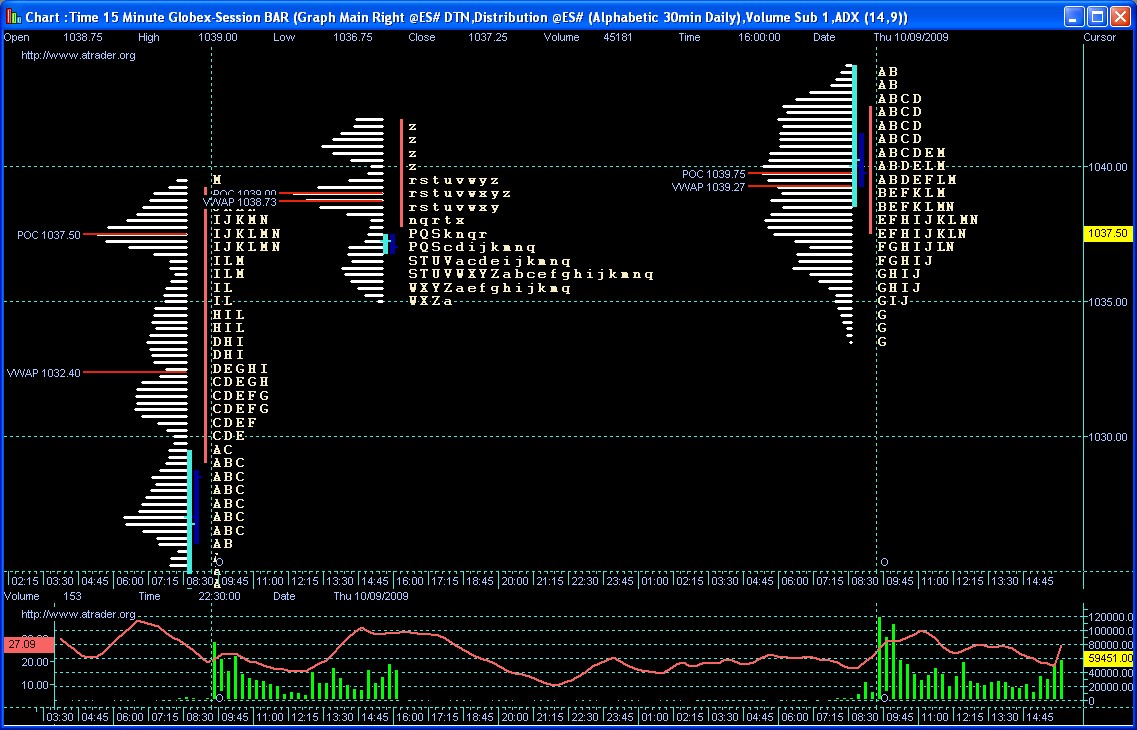
Sure. Heres some. The VWAP can also be calculated on any period of distribution.
I find it helps to have VWAP and POC on the same chart as per the threads on this site on trading market statistics.
-
Hi,
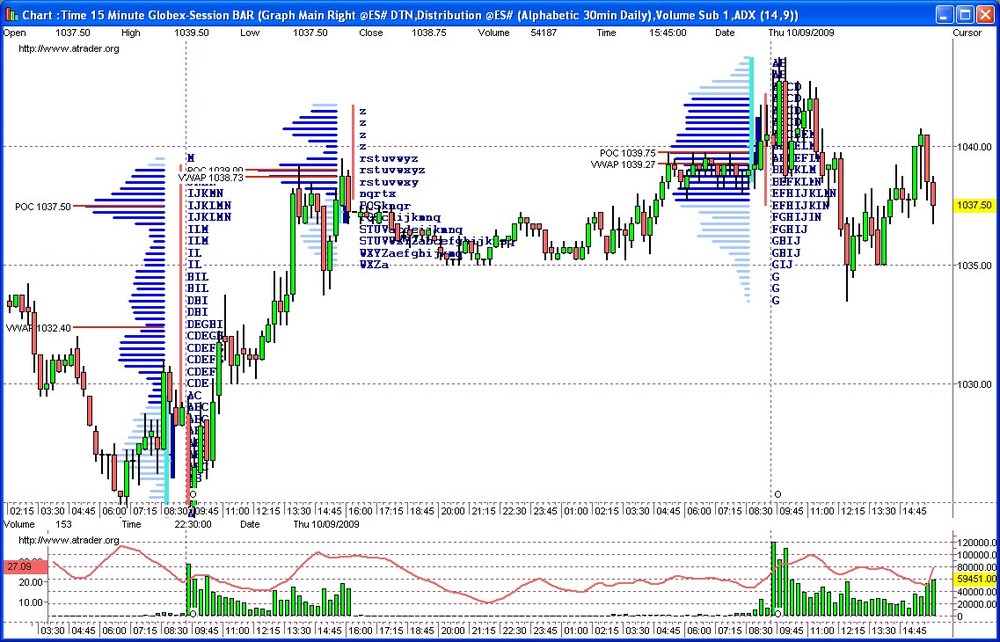
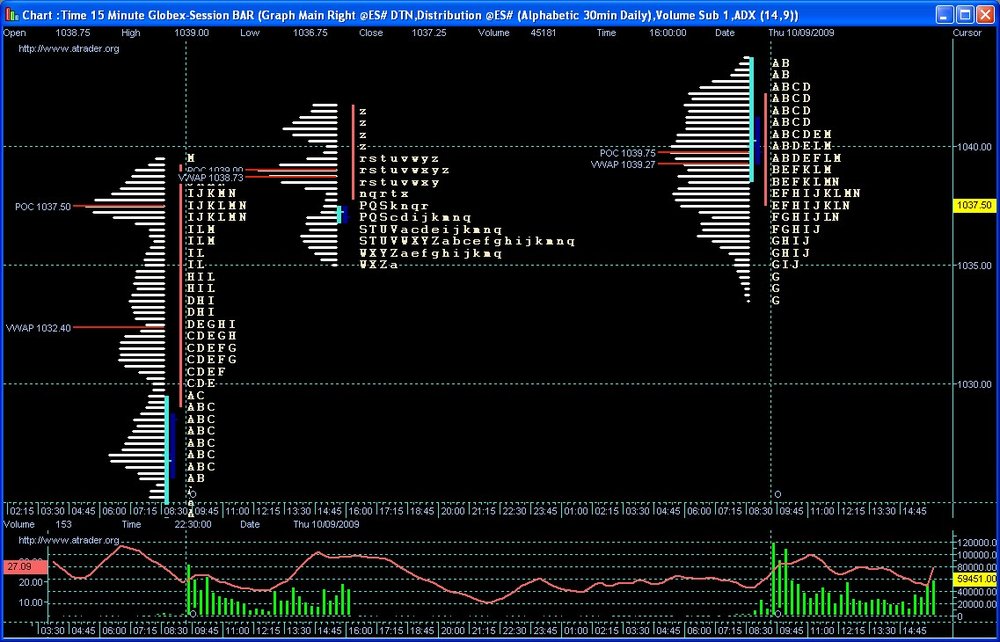
There is now some vwap analysis in ATRADER.
At the moment its just a VWAP but soon it will include SD1 and SD2.
-
And I have sent an e-mail inquiry once to Mirus and never heard back from them. On the other hand, never had any issues with IB. I am not sure how you can recommend Mirus to everyone without knowing the markets they want to trade. The markets available through Mirus is very limited compared to IB.If one's criteria is to use brokers no one had issues with before, then you can stop looking and save yourself the time.
I would second that IB is a good broker to learn to trade with, they have access to just about everything you could possibly want to trade through the universal account.
If you know exactly what you want to trade already you can pick brokers that offer what you want.
-
I was interested to know how anyone used and traded spreads. Ive heard this is a good way to trade and used by the pros.
By this im meaning trading the spread between for example
1. an ES/TF/NQ combi pair.
or
2. a dow stock and a dow index.
Is it possible to effectively trade using these methods? Has anyone tried it in the past? What does one chart and what does one take as signals? Any examples would be great.
What symbols are traded, id guess short the dow index and long that particular stock using a respective ratio. Any other ideas?
Thanks in advance,
-
Sorry if this is a bit off topic.
Am i right in assuming the followings.
The TPOC is the line of price, where 50% of tpos are above and 50% of tpos are below.
The VPOC is the line where the greatest volume traded.
Rgs,
-
There is a movie on this site comparing transact to IB.
Seems pretty good to me.
Any comments?


Free MP for IB or DTN Feed
in Market Profile
Posted
Free period ended today.
Theres still a 2 week demo, 4 weeks if you sign up with infinity/apex or zenfire.
Cheers,