
Welcome to the new Traders Laboratory! Please bear with us as we finish the migration over the next few days. If you find any issues, want to leave feedback, get in touch with us, or offer suggestions please post to the Support forum here.

Logic
-
Content Count
131 -
Joined
-
Last visited
Posts posted by Logic
-
-
So, does anyone use this method profitably ?How objective is it really ? If two people used the same charting program and the same settings for the ergodic etc....would they both come up with the same entries and exits according to the rules by "Logic" ?
I use it profitably and know many others that do as well but I'm bias.

How objective is it? Extremely!
Most of use eSignal as a data feed and as you are probably aware, being on different data servers will produce very slightly different entries and exits but the overall results are consistent. There are others that use different feeds and even different charting software programs and the results are still extremely close.
The key is to confidently trade what is on your screen and that comes with screen time and building one's confidence in the rules and the outcomes as they play out in real time. The main problem with traders is that they don't have the patience to learn anything, they simply want a turn key method that will trade for them. Once must learn to read a chart first . . . period.
Example . . . in skeet shooting when the target is released the outcome is the same. The individual shooting at the clay target, aims and fires. Will everyone shooting at the clay target react in the exact same time frame, no but the reaction is identical. Good thing trading isn't like skeet shooting though where the target must be hit. In trading when executing the the trade in a particular direction it is only necessary that you get the price direction and strength correct. If the target isn't hit, you can still profit from the correct decision.
-
I personally like mine:

-
From father to son the blood runs thinSee faces frozen still against the wind
The seam is split, the coal face cracked
The lines are long, there's no going back
Through hands of steel and a heart of stone
Our labor day has come and gone
-Bono-
I'm swamped with a new labeling program but will bookmark this and start posting soon.
-
I got an email this morning asking me why I had not not been back in a while to the forums. Then I stopped back to see if any interesting discussions were happening and spotted this thread. I read the entire thread and then realized why I hadn't been back for a while.
There were a few traders stating that "Support becomes Resistance and vice versa . . . to the tick" but no one posted a chart to show this interesting phenomenon. Seeing that it NEVER happens consistently, how could anyone use this as a trading tool?
Support and Resistance are the fundamental building blocks to every chart. It is not only critical that your charts create readable Support & Resistance but you understand how to recognize those points on your chart. What is consistent is that the creation of Support will ALWAYS be followed by the creation of Resistance which will ALWAYS be followed by the creation of Support which will ALWAYS be followed by the creation of Resistance which will ALWAYS be followed by the . . . . forever and ever and ever.
Support and Resistance points are proof that price action is cyclic but what is important is the cycle itself not that the cycle has a specific duration (which they do not) nor that specific cycle tops become specific cycle bottoms which does not happen with any useful consistency.
Once you understand that Support & Resistance are constants (if your charts are built without the variable aspects of time) then trading becomes as simple as trading from established and confirmed Support toward established and confirmed Resistance and trading from established and confirmed Resistance toward established and confirmed Support. You can take it a step farther if you understand there are 2 distinct levels of Support and Resistance, Prime & Minor.
-
Book is done. I'll start posting excerpts when I get back home at Labor day.
-
I do it in e-book form and hard copy.
-
I'm just used to the flame wars at ET that I'm a bit burnt. No pun intended. I'm in the process of my final update on my book. Give me a few days and I will post a clear synopsis of my method.
-
I respond to all inquires. No one seems to care..:doh:
Nice to see you here
-
Until you learn you how to use a tool, they will all suck.Absolutely correct.
And after you use one for a while and then learn . . . . it still sucks.
-
I sent all of the information over to them 3 months ago and have been ignored since.
Go figure.
-
Hey ppl...as there seem to be some controvertial viewpoints here I suggest to open up a new thread to discuss the relevance of the concept of "time" in trading.Best regards,
Flojo
Agreed and I apologize for any interruption.
-
Prof, I am a proponent of constant volume bars for certain applications and have followed your arguments at other venues.Might I ask is it your contention that time is an unimportant variable when analysing price series data? (I think I can guess what your answer might be
 )
) As an aside constant volume bars with a time histogram below gives an interesting depiction of 'pace' or momentum (if such things are of interest).
Sorry FJM strayed a bit off topic.... good work though!
I don't want to pull this thread off kelter but yes time is irrelevant to price action. Adding time in a histogram is just adding an unnecessary distraction. Look at a clock if you must.
-
Logic -I would be interested in your methods if you would teach me.
There's a thread in here which is a good place to start.
Teach yourself to trust yourself.
-
But the markets are dynamic and not static so why make your chart static?IMO analysis of how the markets are and not how we wish seems the way to go.
Trend traders try to avoid the ranges and range traders vice versa. Some attempt to trade both scenerios which I don't believe makes much sense. But price is what it is and will do what it will do.
I use EW/fibs/fractals and do see repeatable, predictable patterns. Just not all the time in all markets. I believe Prechter or anyone else who believes you can define 100% of all price action is missing the point. It is not necessary, in order to trade, to know every minute of every day what the market is doing.
So we market participants and academics will continue to try to disect what it is price is telling us, but the day we truly understand will be the day the markets cease to exist.
Hey, why buy an HD TV. I can see the picture just fine with my analog signal and CRT TV, right? I mean that is how the signal first started out, why improve on the delivery of information, right?
I see repeatable patterns too but mine are objective, consistent and readable in real-time. Should I give back all of the profits they have generated because I have missed some point or better yet, found a point others have missed? (that was a funny statement not meant to be argumentative).
Einstein once stated, "Everyone knows something cannot be done. Then along comes a man who does not know that it cannot be done and does it."
We all trade based on an edge we have found or are searching for. I found one. I've shared what I've discovered with many traders and without exception they have all commented that using Constant Volume/Share bars has enhanced their profitability, regardless of their method. At least those that have applied them correctly. That speaks volumes as far as I'm concerned.
I understand how to objectively and consistently read the oscillations price creates continuously but I don't think anyone understands why price HAS to oscillate . . . and it is still moving today and tomorrow and from this point forward. When those oscillations cease, then we something to worry about.
-
Logic -If I understand you correctly, I think you are setting up a straw man there: we may only see through a glass darkly but that does not mean that we have not discerned the main features of what we are looking at.
I would suggest that more complete information will certainly be of use but it will not of itself overcome the problem of (the probabilistic nature of) the predictive task.
I would also suggest that it is in the nature of fractal patterning that the smallest action of the smallest player has the capacity to resonate in the outcome at the largest level, so I'd conclude that somehow the information one needs for successful prediction is contained in every participant's attitude to every trade and that therefore the progress of the whole can be discerned in the state of the smallest part. We have either got fractals or we have not - more detailed resolution is not the key to either making use of this or indeed to verifying their existence. Perhaps what you are saying is that, given complete data the fractal nature of it would be shown to be an artefact of its previous incompleteness, but I think that there is overwhelming evidence to the contrary.
Where I would agree with your plea to get equivolume data would be this: that it might enable us to dispel some of the myths about the level of participation which is supposed to obtain at various stages of a wave's development.
It fascinates me that we participate in these things we call markets without really knowing what constitutes a measure of expertise. In "the market's eye" we are all of us equally disadvantaged. I suppose I'm talking about the ideal situation there, but in reality it seems that human nature will see to it that even a rigged market is rigged fractally. Even when mere incompetence reigns supreme over the nature of the information that goes around, the nature of that incompetence is ours and therefore just as likely to be fractally patterned as anything else we are responsible for producing as a body of social actors.
I don't think you are understanding what I am saying but then again I've spent years practicing my ability to simplify my position so that everyone could grasp the foundation of my points. That process has a tendency to confuse they more complicated minds out there.
What is the difference between watching a TV show on a CRT television with an analog signal and a 1080i HD television and a digital signal?
Simple answer . . . the picture is simply clearer on the HD television. Same program, same actors, same everything.
What is the difference between watching a price chart made up of variable bars and watching a price chart of the same market made up of non-variable equally weighted bars?
Simple answer . . . the view of the oscillations, as they relate to that specific chart is perfectly clear. Price always moves in oscillations and those oscillations are clearer when viewed in a non-variable environment.
Don't we want to have a clear unobstructed view of the price action regardless of the chart we are making are trading or investment decisions on?
Then breaking those charts up into segmented Fractionals (I personally use increments of 7; 7, 49, 343, 2401, 16807, 117649, 823543 etc.). I can clearly and consistently see those waves of price action as they move inside the longer term larger fractional charts.
I consider myself advantaged not disadvantaged. I consider myself perfectly and objectively competent, not incompetent due to my view of price action but then I have 15 years of personal research and over 35,000 hours of screen time to validate my position.
The markets are random and chaotic only if one views those markets on charts based in a state of randomness and chaos.
-
I've been researching and studying pure price with a view of their fractal nature for over 15 years and have come up with a few objective conclusions with regards to applying them inside price charting environments.
1. Applying any study to variable chart environments (all time, tick or range based charts are inherently variable in nature) will result in inaccurate and inconsistent conclusions.
2. Applying any study to the FOREX Markets (pairs) is a futile effort. FOREX is based on separate intra-bank (6) data feeds each of which are producing only time or tick data. None of these feeds release volume data, either in whole or in groups because this is how these individual or groups of banks manipulate the data they release. These banks have repeatedly broken negotiations with GLOBEX when trying to join these feeds into a single stream of information. The only point in time where FOREX will be a reasonable and fair environment to trade will be when all of these feeds are joined and their data and volume related inforamtion is validated.
3. Constant (capped) Volume/Share Bar charting is the only way to accurately, objectively and consistently view the effect of fractals on pure price action (movement). This is because this charting environment is based on the fact that each bar is equally weighted and thus contains no variable aspect. Having the bars of any chart we are making are trading or investment decisions from being grounded in equally weighted bars not only levels the risk associated with that chart but tilts it in our favor.
Mandelbrot & Elliott were on the right track but neither of them had access to the tools to take the information to the next level and that was to smooth out the information that price gives us in its pure movement. Elliott saw price move in oscillations (waves) but erroneously concluded those waves were predictable. Yes, price moved in oscillations (waves) but there is no consistent number of waves inside the longer term extreme moves in price action. Mandelbrot saw how fractals made up everything on the face of the earth but couldn't accurately define the exact effect they had on price action.
A clearer definition to the "fractal effect" on price is "Fractionals" not fractals.
I've been lobbying some of the software companies since 1995 to produce Constant (capped) Volume/Share bars but it took Ensign in 2003 to first offer them. Since then a few more charting companies have offered them (I use MultiCharts) but due to their complete difference to the established way charts are currently built a lot of companies refuse to redo their complex code to offer them. The charting companies approach their products with blinders and feel they only need to do the minimum expected and do not see a need to be cutting edge on any of their products and services. This is a real shame.
-
Tams,I'e used Proflogic's CVB charts for about 6 months now, but without the ergodic indicator and all the rules - primarily 343 & 2401 charts. I use Trade Navigator which I'm happy with, but as noted without the ergodic indicator. Can it be written up and programmed into my trade platform?
Thanks in advance for your reply.
Let me know the programming language they use and I will do my best to find one for you.
-
If that FOREX I see? Forex doesn't have volume bars, the foundation of what I do. The other problem with FOREX is that the banks control all of the information coming from the trades. There is no other more grossly manipulated market on the face of the earth.
-
Just to clarify - is the new rule on TL that any link to elitetrader will be deleted?I've posted plenty of links to ET on TL and they were never deleted. Now I see DB is policing this policy and I was not aware that it is against the rules to post a link to another trading forum.
So if someone could clarify the rules on posting links to other trading forums, that'd be great to clear up any confusion.
Thanks.
Hey BF019
Nice to see you here.
I might have a solution . . . simply 'cut and paste' the post.
-
good to see u here prof, have a time in nycNY City was fun but Surf's get together was the best part. I got a chance to talk to a great group of traders and compare notes.
-
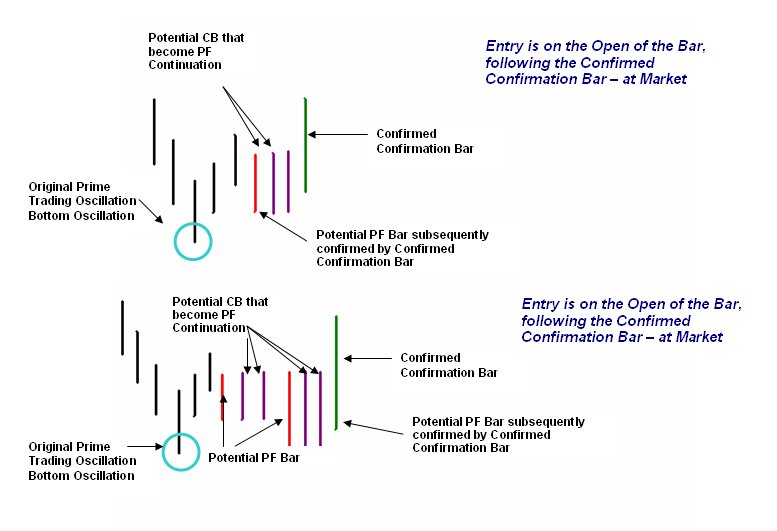
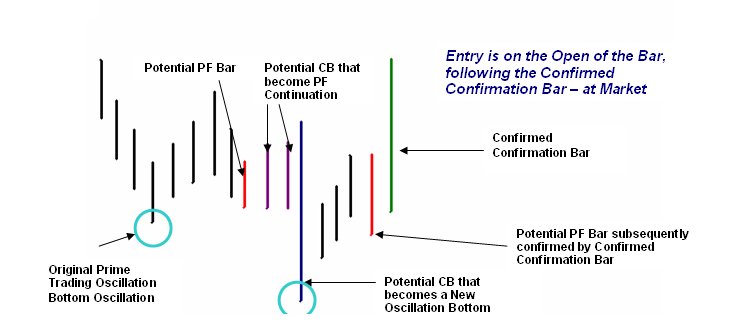
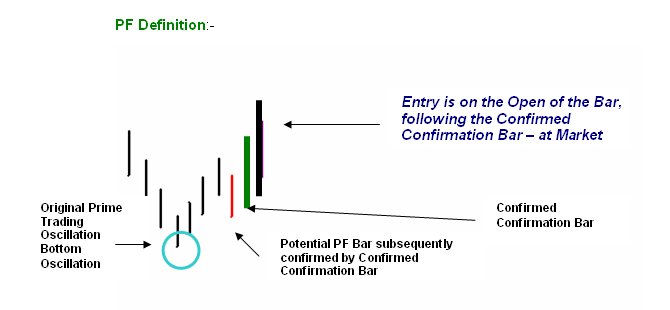
PF? - Price Failure? I guess when you have been posting this stuff for years it is easy to forget that not everyone will be up to speed with terminology. It would be helpful with a new thread at a new venue to treat people as complete nubs and give a brief explanation of terms and concepts as they crop up. Mind you even with a well defined terms mis-understandings still crop up, thats a whole other story.TAMS posted the rules and I forgot to post the PF images.
Simply ask and you will receive.
-
A PF must follow the Histogram Oscillation but before the Histogram oscillates back in the opposite direction.
-
Thanks for helping in here TAMS. I'm in the middle of evaluating a software program and will be tied up for a couple weeks but will post as often as I can.
-
Pretty much, sorry.
Tick charts are better than Minute charts but the difference is crucial.
Minute charts are the worst.
When I get home in a few days I will post a few chart that compare Minute Tick and CVS Bars so you can see the difference. Constant Volume/Share Bar charts are like High Definition viewing of price movement, direction & strength.
ProfLogic's Method
in Swing Trading and Position Trading
Posted
One indicator set at 2 separate speeds on the same price chart.