
Welcome to the new Traders Laboratory! Please bear with us as we finish the migration over the next few days. If you find any issues, want to leave feedback, get in touch with us, or offer suggestions please post to the Support forum here.

Logic
-
Content Count
131 -
Joined
-
Last visited
Posts posted by Logic
-
-
This is an age old argument that just never goes away. You have a stronger line between both camps on this issue than you see on most. In my opinion that is because of the shear nature of trading to begin with.
Being objective is really hard evaluating both camps if you don't take into consideration all of the parts that make them up.
Fundamental Analysis is inherently flawed because it only assesses information supplied by the very individuals inside that particular stock, commodity or futures market. Do you think they have an "agenda" they want to see play out. Absolutely! Over the last 10 years we have seen stock information manipulated in many company's reports to sway investing either toward or away from the current stock price. This isn't a rare occurrence. It happens on a regular basis.
I personally deal with the Agriculture industry and know first hand that the USDA (United States Department of Agriculture) manipulates the data they release to the Ag community in order to try to control prices. I've caught them in numerous lies over the years especially when it comes to sending reports regarding foreign country usage, acreage planted and weather. I figure they think they can get away with putting out misinformation because "farmers" are ignorant. I remember a trip I made a few years ago to China and Australia. When I got back I went to an Ag conference where the USDA reps were saying that China and Australia were going to have good crops that year. This was a blatant lie. China crop was blighted that year and Australia was in the middle of another huge drought. The USDA was trying to force the farmers to sell their crops early to keep the supply up. The information they release on local usage isn't much better for accuracy. Other industries in the futures arena aren't any different when it comes to trying to manipulate price direction.
Technical Analysis (TA), (old school that is) is just as inconsistent. When it comes to analyzing past data and price flow. I agree that the past is just the past. [i want to point out that unless you are making your decisions using anything other than raw data, if you are looking at a chart in any way shape or form to make your trading decisions (even naked price bars), you are using TA]. Old TA assessed a market (symbol) segment usually based in time or transactions. The problem with that is that the markets are traded in Volume not Time or Transactions. Anytime you assess a chart based in Time or Transactions the weight of the price bars are unbalanced. Unbalanced because there is a different amount of contracts or shares represented per bar. Simple math dictates you can not find a solution to any problem where the components of the problem are constantly changing. This is why edges disappear. This is why profitability is always fleeting. This is why consistency was the Holy Grail that was never found. It's impossible to find consistency in an inconsistent chaotic environment.
Call it current TA but this environment is far more stable that the TA of old. What is the difference, Constant Volume Bars™. I'm just not saying that because I created them but because they actually balance out the flow of a chart. On a Constant Volume Bar™ chart, each price bar is the exact same weight. Since the bars are weighted the same, assessing or reading the content of the chart or the data flow is perfectly consistent. The variable aspect of the charts are gone. Now I use the chart layout in a unique way to create my own edge (charts attached) but others that are using these chart structures are all telling me they are seeing an increase in profitability and a consistency they never had before in their own trading styles using Constant Volume Bars™. These bars are available in MultiCharts, NinjaTrader, Tradestation and Sierra Charts that I know of but the only charting platforms that build the bars accurately are MultiCharts and NinjaTrader. I personally use MultiCharts because I find it the most robust and easy to use.
I'm telling you that I've been profitable for years not to draw attention to myself but to simply point out it is possible. There are many edges out there that work. I know a number of traders that have been trading for a living for years that either trade nothing like I trade or trade in a similar manner. It doesn't matter. I know day traders that are profitable and I know swing traders that are profitable. I do know that most of these profitable traders purposely don't bring attention to themselves because they don't want to argue that what they do is gambling or that it is impossible to do what they do. Both being ignorant statements.
Every math professor I gave my findings to (purposely omitting how they were being applied) after rigorous testing, told me that my findings were flawless. Interesting enough that as soon as I told them how I was applying the math they changed there tone. that is all but a couple of them. One actually retired from his college position and started trading.

Just don't limit your focus. Be open minded. Trust what you see not what you think! Work smart not hard.
-
Re: Strength HistogramYes, I understand where it is on the chart and what its based on, but I was hoping for more information on how it is used in your method.
As I recall from wading through the mess in that other forum the largest volumeframe was used to determine Primary Trend: Bull or Bear. Or am I mistaken? Does the Strength Histogram replace that?
I noticed that most of the trades you've shown were taken in agreement with the color of the strength histogram. So do you use the strength histogram as a filter?
Any insights you're willing to share are appreciated greatly.
I'm on SKYPE. It's easy to share my sreen to show you. Picture is worth a thousand words you know. Let me know if that works. Email me at wm.schamp@pricephysics.com and I will forward you my contact info. I do SKYPE every afternoon after trading.
-
Great! What was the post number?#111
Minimum 20 character post.
-
Yes, please. I second the request.Check above post.
I did.
-
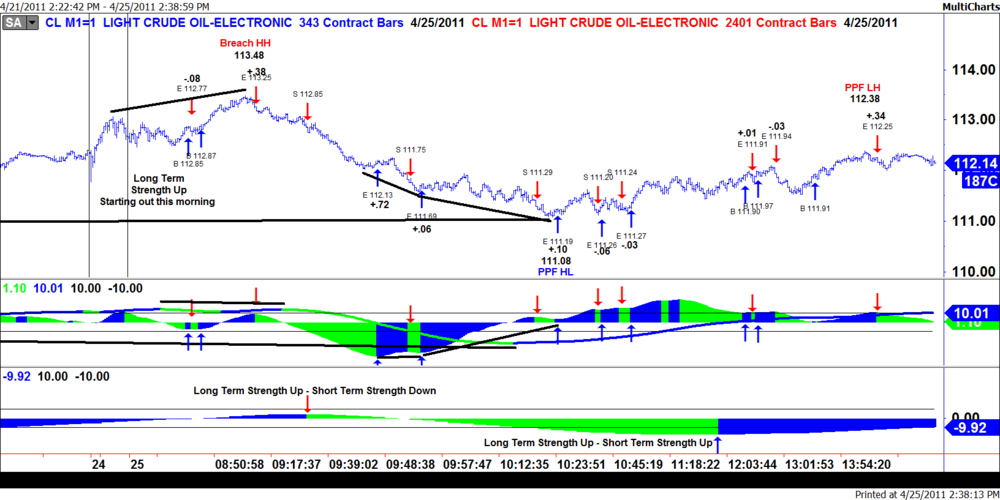
I don't receive Crude Oil data and am new to Multicharts, so I am having a little trouble following the chart template. Is the following correct?1. The price portion of the chart is 343 volume bars with labels based on the prime trading oscillations on the next fastest chart, which would be 49 volume bars.
2. The second pane is the ERG and ERG histogram based on the 343 volume chart.
3. The bottom pane is the ERG histogram from the 2401 volume chart.
4. A change in the color of the ERG histogram on the bottom pane shows a change in
SHORT term strength?
The template I posted was for NinjaTrader not MultiCharts.
Email me and I will send you the indicator and a template workspace for Multicharts.
(wm.schamp@pricephysics.com)
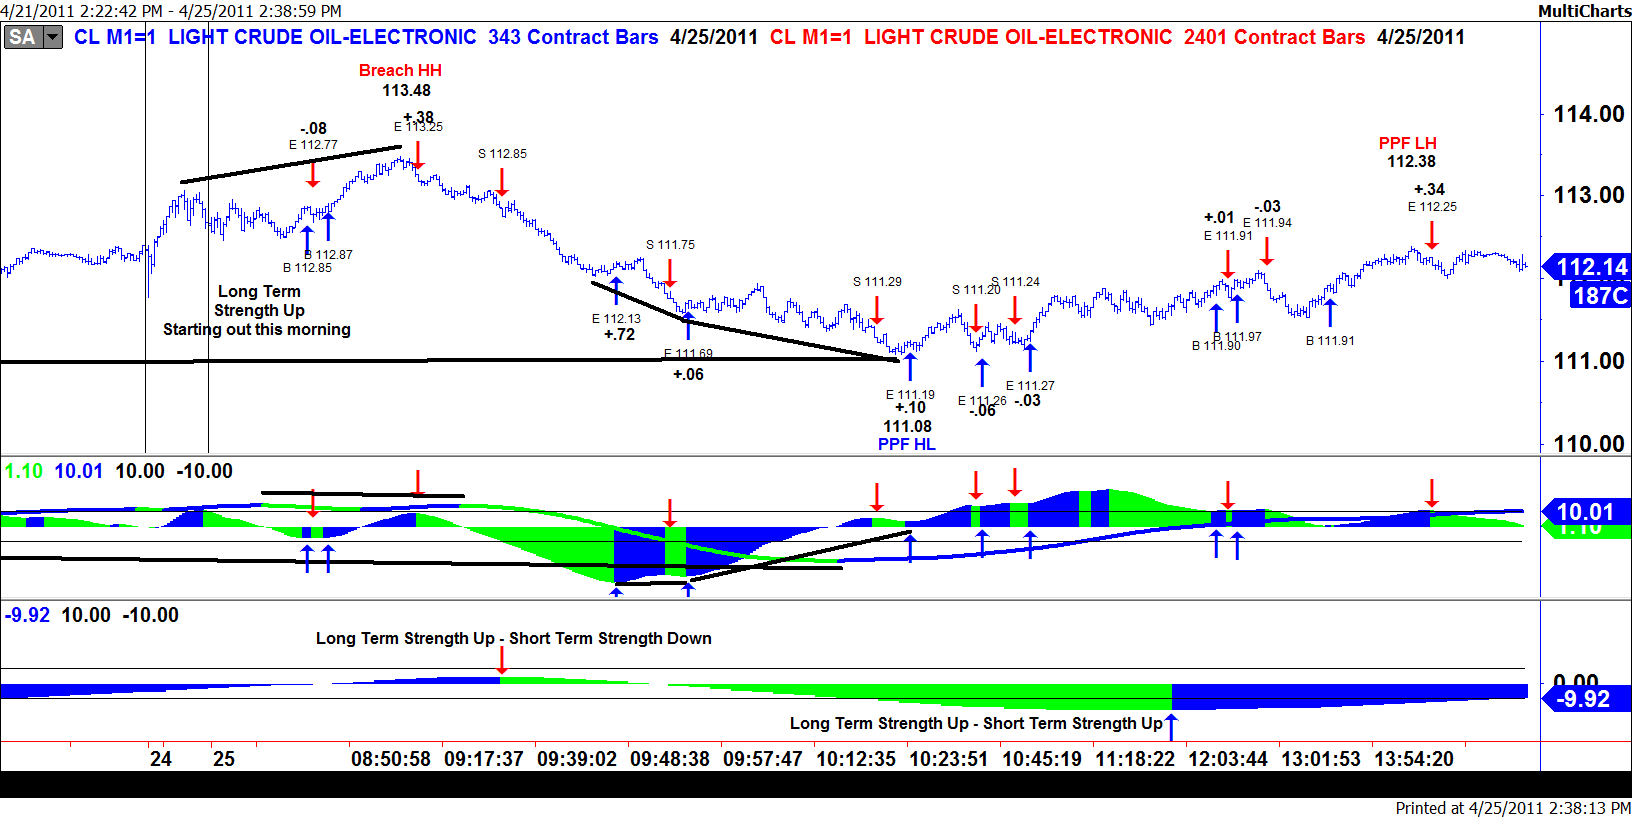
1. Price bars are 343 Volume Bars.
2. 2nd pane is Trading ERG & Trading ERG Histogram based on the 343 Volume Bars
3. Bottom pane is the Strength ERG & Strength ERG Histogram based on the 2401 Volume Bars
4. Change in color in Trading ERG or Trading ERG Histogram is where the primary Trade entries and Trade exits take place & specifically where Long Term Strength is confirmed from the Trading ERG.
5. Change in color in the Strength Histogram is where we see short term strength. We do not use the Strength ERG. Too long term.
-
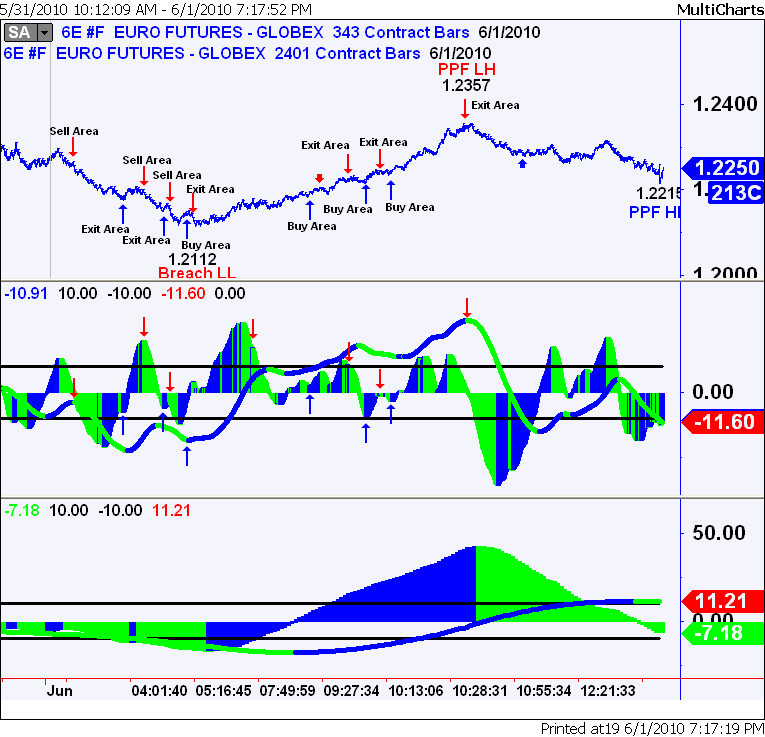
I have an EU chart for some analysis.First let me ask, is the idea to define the trend based on HHs and HLs? I am attaching a pic showing the basic trend that everyone has understood for a while. Is this how you would go about defining the trend similar to this pic.
Also once you have that HH or LL, is the idea to then enter on the next pb once that trend has been defined as shown in the picture? Also, you are willing to take countertrend trades against the direction of the OVERALL trend, as long as it matches the direction of the current leg you are trading correct?
Next, just attaching a picture of the EU action currently. Right now, there was a LL put in place, now we have a HH. So does that mean this current pa is just still stagnant and we need to wait for a trend to be put in place?
The annotating of your chart is perfect. Look how my chart is different. I break the indicator up to Trading oscillations and Strength oscillations. If you want to talk about it, let's SKYPE.
-
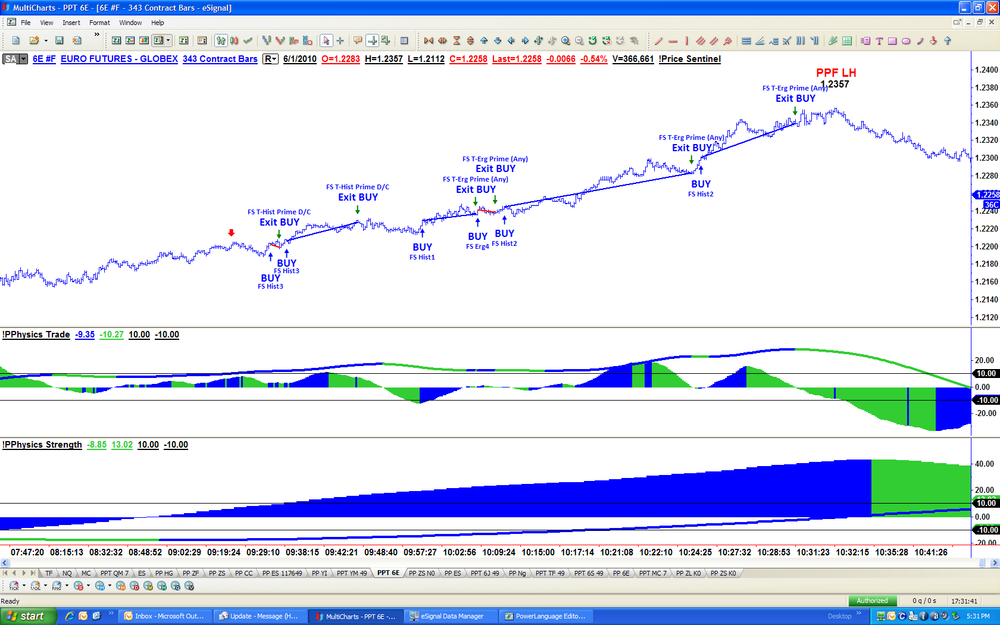
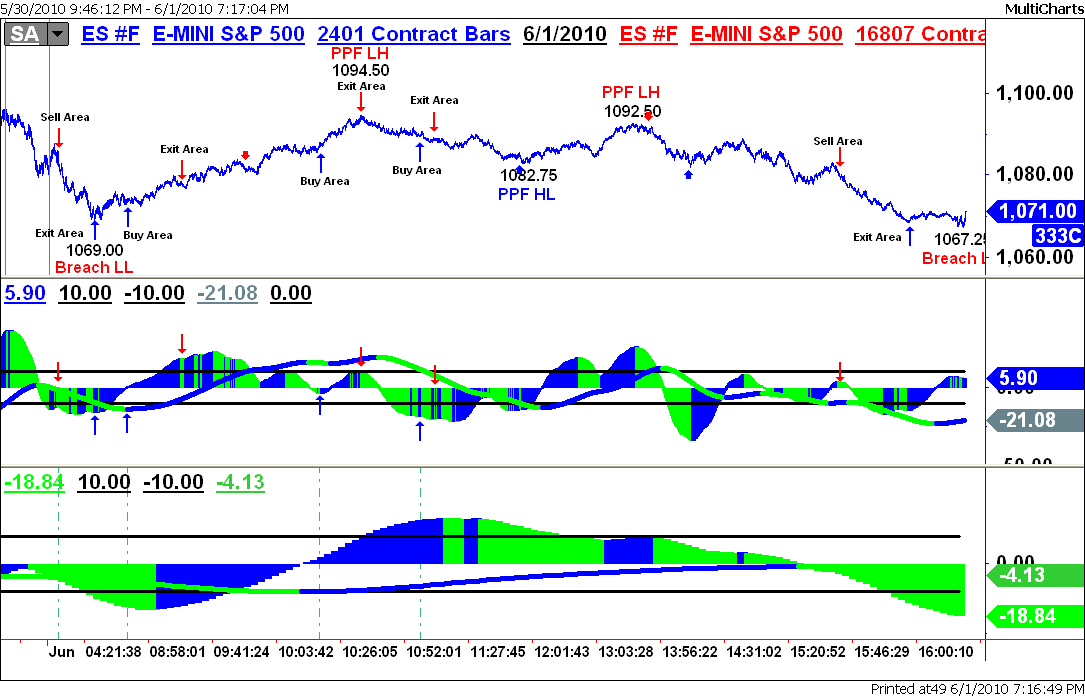
Here is the intraday chart for June Crude Oil as of right now and the trades that executed.
-
So when would you know? Would you consider that PPF that occurred(the major one on the right of the chart) a Prime PPF to confirm that top?Or would you need to see a LL created first?
You know when the Prime Oscillation is created and that is coordinated now at the price level at 1.4627.
A LL confirmes the PPF (LH)
Another LH is further confirmation of the top.
Another PPF (LH) is further confirmation.
The Ninja Trader template I posted has both the trading oscillations and Strength oscillations listed.
-
Some observations on the primary trend for EU with regards to this thread. I think the pic is self explanatory, so post if something doesn't make sense.Well stated.
Price is consolidating at a long term Prime Resistance top.
Prime PPF of Resitance is the confirming oscillation of that top.
-
Attached is the Template for my indicator for NinjaTrader 7.0.
Sorry I don't have one for 6.5.
Bill Schamp
-
I'll get with the programmer to send me a template for NT 6.5 and 7.0. I'll post it on here if she sends it.
Bill
-
The labels that used to be there seem to be gone, but it looks like you're selling as price is making HHs? Like on that leg up at the beginning of the chart?I was under the assumption that the idea was to sell LHs and buy HLs?
I've improved on the technique by giving everyone the ability to trade using strength and the oscillations. the strength indicator is the one on the bottom. In a few weeks I will detail the improvements on here.
-
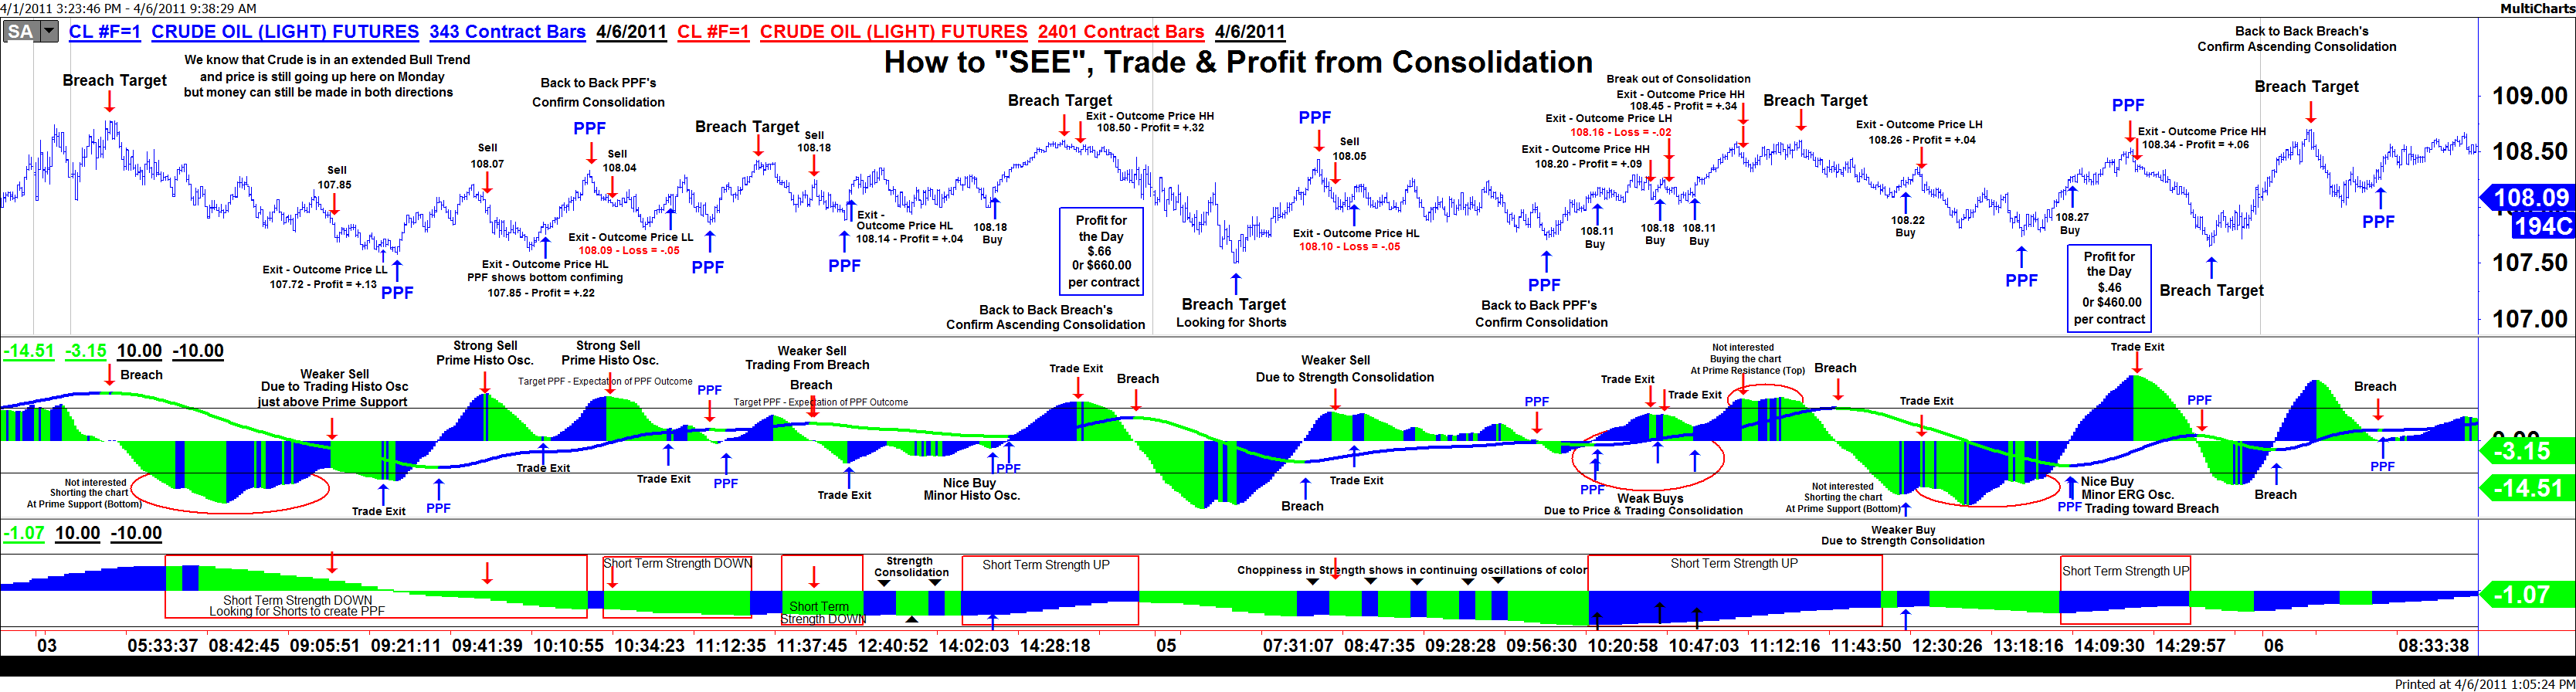
Here is a chart covering 2 days of Crude Oil (Monday & Tuesday).
This shows entries, exits, recognizing and trading in consolidation.

-
Yay! Me too.I have a few questions if you or anyone else has the time.
The Theory:
OBJECTIVE buying and selling of HLs and LHs. As stated elsewhere the idea isn't necessarily trading trend, but trading oscillations.
Overall trend is determined by the erg from the 'strength' chart, which is one fractal higher/slower than the 'trading' chart. If that erg is above zero general trend is up, so we'd be looking to buy HLs? If the erg is below zero, general trend is down, so we'd be looking to sell LHs?
I guess the next line of questions would be WHEN to enter on that pullback that is occuring? The idea is to wait for a 'Prime' pullback of the HISTOGRAM on the 'trading' chart, or your MIDDLE bar interval chart.
Once this occurs, the entry, is it based on an oscillation of histogram color of the MIDDLE chart, or do you look to the ENTRY chart, and look for an entry as the erg from the ENTRY chart breaks back through the prime level?
The exits I am unclear of. I have read the rules, the problem it seems is the deciphering of what all that means if that makes any sense?
I have attached a pic of the idea as I understand it so far. I am HIGHLY confused still.
I'm currently annotating the Crude chart for Monday and Tuesday for a student to show him how to trade during consolidation. Give me a 15 minutes and I'll post it here. I promise it to be detailed.
-
I'm always around the computer.
-
What do you guys find to be an adequate volume in a futures contract in order to consider it to be a viable trading vehicle (I use an EOD / swing trade strategy)? 500 traded contracts per day? 5,000? 50,000?I've been looking at Germany's TecDAX future and I was shocked to see that it traded only some 400 contracts on Dec. 23rd... I'm afraid of slippage the size of the Bismark if my stop gets triggered in such a market?
What are your experiences / thoughts on this?
There are plenty of futures contracts that trade with enough volume to offer plenty of opportunities each day. Some of them are; Euro FX, Light Sweet Crude, eSoybeans, eWheat, eSoymeal, eSoyoil, eMini NASDAQ, Australian Dollar futures, Swiss Franc futures, Gold & Heating Oil. There is absolutely no reason what so ever to trade a thin market.
Think about going into a buffet and you are starving to death and there is only one bite of your favorite dish but lots of other things you like. But you lay on the floor and die because you are stubborn and only want to eat your favorite but it isn't enough to sustain you . . . that is not only silly but not bright.
You will find that 3000 to 5000 contracts will be the minimum you want to mess with for daily volume. I personally like volume bar charts as well but to each their own.
-
My opinion of May 6th was, if a trader could read an intraday chart there was absolutely no reason, trading the indices, that particular trader would have been long. If they weren't long, they can not read a chart.
Regarding swing trading, my charts triggered exits on May 4th.
-
Logic,Was this system ever automated ? Do you provide or sell the code?
I was reading through the thread over on ET. Sorry, but could you explain what is meant by: "prime"? And "breach" just means a breakout, or a hh or ll correct?
I would like to understand the system a little better but the terminology has thrown me off a bit.
Your system seems eerily similar to the one I trade in terms of using an oscillator and multiple charts/time frames to look for confluence!
Is the ergo indicator you use also known as a True Strength Index indicator? I didn't see it on Sierra Charts.
Yes, it was recently automated for both grey box and black box applications utilizing MultiCharts and eSignal.
I freely provide the indicator for a few charting programs: MultiCharts, Tradestation, NinjaTrader & AmiBroker. The AmiBroker code is the weakest because it is the oldest and hasn't been updated in a long time.
I only offer the box applications to former students and I no longer teach.
The information on the method is freely available on EliteTrader but you have to search for it. I have a book on my site but free is a lot better, just takes a bit of birdogging on the site.
The key to what I do is the volume bar charts but I'm told Sierra doesn't build them correctly.
I use multiple chart increments as well but I embed them and build them into a single chart instead of trying to watch multiple charts, less distraction.
The TSI is the same as the ERG. I prefer the ERG because it can be adjusted and tuned easier.
Email at wm.schamp@pricephysics.com and let me know if you want one of the free indicators.
-
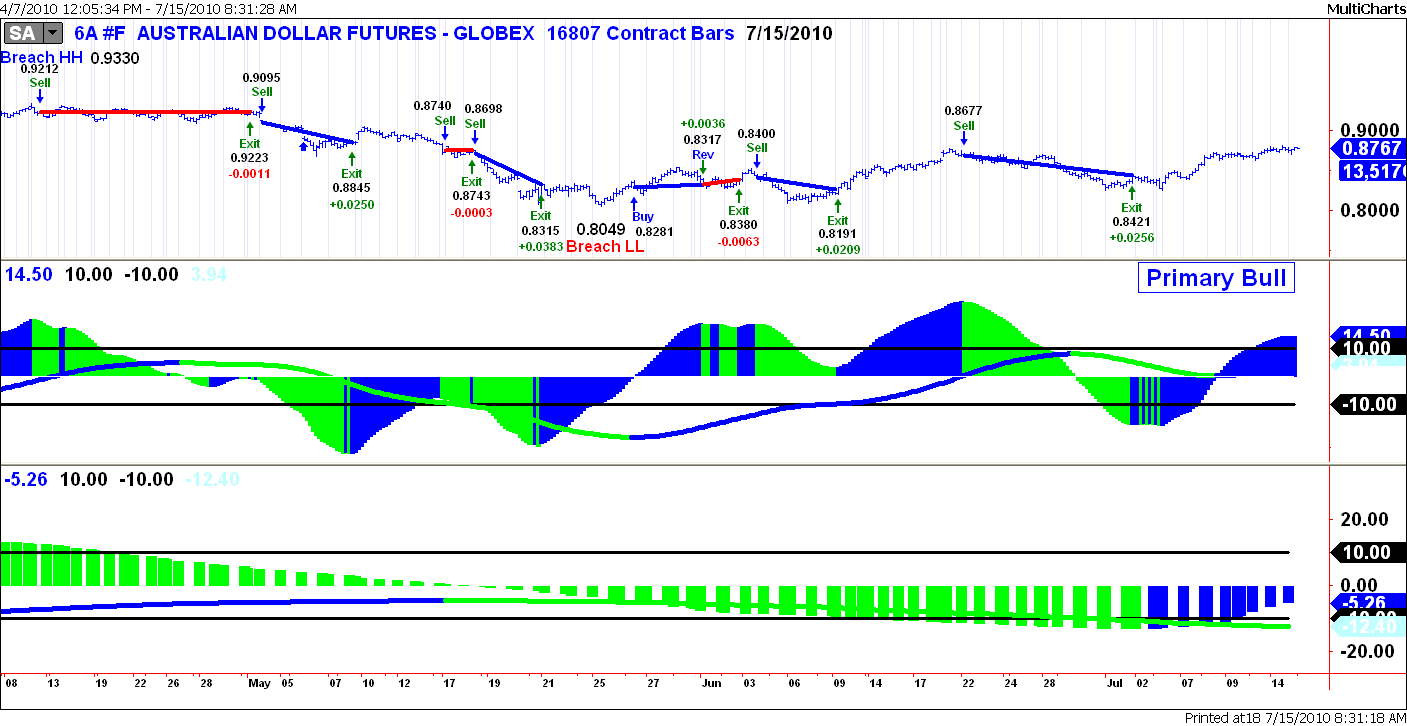
Thank's Logic, that looks cool. Right now I am a down and dirty scalper in my day trading, but I am trying to reduce the number of trades and increase their quality while still maintaining a similar risk profile. Haven't had much luck so far. If I can add a quality trade ever couple days that would be good.Here's an example of the Australian Dollar Future's swing chart from early April. This chart has produced over 1050 pips in just over 3 months. Tha isn't bad.

-
The PPF and Breach things seem straight forward, I don't have the indicator so I am just going to wing it.Prime = +/- 10, is that correct?
I use ninja (yes, it's ok to feel sorry for me) and I would like to validate that my ERG plots similar to yours, but my data doesn't go back as far as any of the charts on this thread. Would someone mind posting a current chart for reference?
Also, I am assuming that 49-fast, 49-slow, 147-signal. Is that correct?
The text file says
"(In Trading Decision Chart)(1) Prime Trading PPF trade through to Prime Trading Breach.- In Trading Decision chart when PPF label shows then confirm previous label is Breach label.(2) Verify Histogram is in Prime.- For Long Position histogram must equal or below -10 (When PF confirms, histogram can swing back above -10).- For Short Position histogram must equal or above +10 (When PF confirms, histogram can swing back below +10)."I am plotting the ERG that I have and I am looking at your charts and rarely is the histogram is at -10 where there is a PPF after a breach to setup a possible long and vice versa for shorts. Are you looking for one trade every few days or so on a 2401 chart or am I looking at it wrong?
Thanks again for any help.
I'll make it easy on you. Send me an email at wm.schamp@gmail.com and I will send you the indicator for NT. Just let me know whether you need it for 6.6 or 7. The indicator is free . . . learning to use it takes patience.
-
Huh? Can someone knowlegeable please explain in simple english, or even simple cantonese so I have an easier time translating? Thank you.Ask a specific question and I will answer it.
If you live in Vegas I can direct you to someone that can explain it in person in about 30 minutes but you will have to buy him lunch.

-
That is debatable depending of course on how one defines range bound. I can't recall how you do that using your paradigm? I guess I'll remember eventually There is plenty of opportunity as price bounces between the top & bottom of a range too.In a nutshell buy support and sell resistance whereas if a market is trending do the reverse buy break outs of resistance and sell bo's of support.
My position is still valid but let me make myself clearer.
Trading on a range bound chart is a lot harder than trading on a chart that is showing clear strength either up or down. If one chart is range bound, simple speed the chart up one volume bar increment and you usually will find yourself outside the choppiness and back into a strong directional move. If the consolidation is really bad and you find more choppiness on the next fastest chart. Go to any other market. There are so many liquid profitable markets out there that is seems silly to marry a single market or chart.
Trading simply at points of support and resistance is acceptable for the experienced trader but for someone on the long end of the learning curve learning to see "strength" is crucial to longevity in this business. Adding strength to the specific support or resistance creation will increase your profit potential of any trade by 10 times. Once you can read strength (trending charts) it is still better to buy support in a clear uptrend as to wait for the breakout of resistance and it is better to sell resistance in a clear downtrend as to wait for the breakout of support.
-
Hi Logic,thanks for the explanation. How do you deal with choppy /range bound trading sessions ?
Simple.
If you learn to read a chart for its main attributes of "Price Direction" & "Strength" and the chart becomes choppy and range bound you can easily see see "Price Direction" (up at an oscillation of support or down at an oscillation of resistance) but you have no confidence due to the "Strength" being neutral or even totally against the trade so you STAND ASIDE!!!
Why trade during choppy range bound times? Charts offer more opportunities to profit than they do chop so learn to have the patience to wait for those times.
-
Here is a screen shot of a manual Euro Futures chart from today, a manually traded eMini S&P chart from today and an automated Euro Futures chart from today.


Technical Analysis: Is it voodoo? Or does it work?
in Market News & Analysis
Posted
Here are the charts I tried to post earlier.