
Welcome to the new Traders Laboratory! Please bear with us as we finish the migration over the next few days. If you find any issues, want to leave feedback, get in touch with us, or offer suggestions please post to the Support forum here.

MidKnight
-
Content Count
677 -
Joined
-
Last visited
-
Days Won
2
Posts posted by MidKnight
-
-
Hi MK,I am very happy to hear that things are going well for you. I have been following your nightly contributions with great interest. I am sure that I am not alone in having an interest in learning how you are triggering your entries, managing trades, (stops? limits?) etc. I hope you decide at some point to share a few more details with us.
I wish for your continued success!
Best Wishes,
Thales
Thank you. No secret how I am triggering in, just via JR 123s when within my pre-planned APs. Stops are just on the other side, just like you do. It's nothing unique on my part. Think I read somewhere about a great trader just taking ideas from others, I'll follow by his example

With kind regards,
MK
-
Hi all,
Since my initial exploration of Thales's re-introduction of the JR 123 back in NOV 09 (or was it OCT?) was not so good, I went back to the drawing board and since 2010 I have been entering these within the contextual views that I have been posting as plans over the last few weeks. It seems that on the huge majority of days if I am patient enough to wait for price to be within an attention point (AP) then I have a very good chance of catching some sort of favourable movement.
I think that anyone having trouble with the JR 123 would find significant improvements if they worked on their determination of relevant APs and then being patient enough to just wait till price is within the APs. It has made all the difference to me and I hope maybe just one person will take this advice to heart and save some pain if they are going to explore the JR 123.
With kind regards,
MK
-
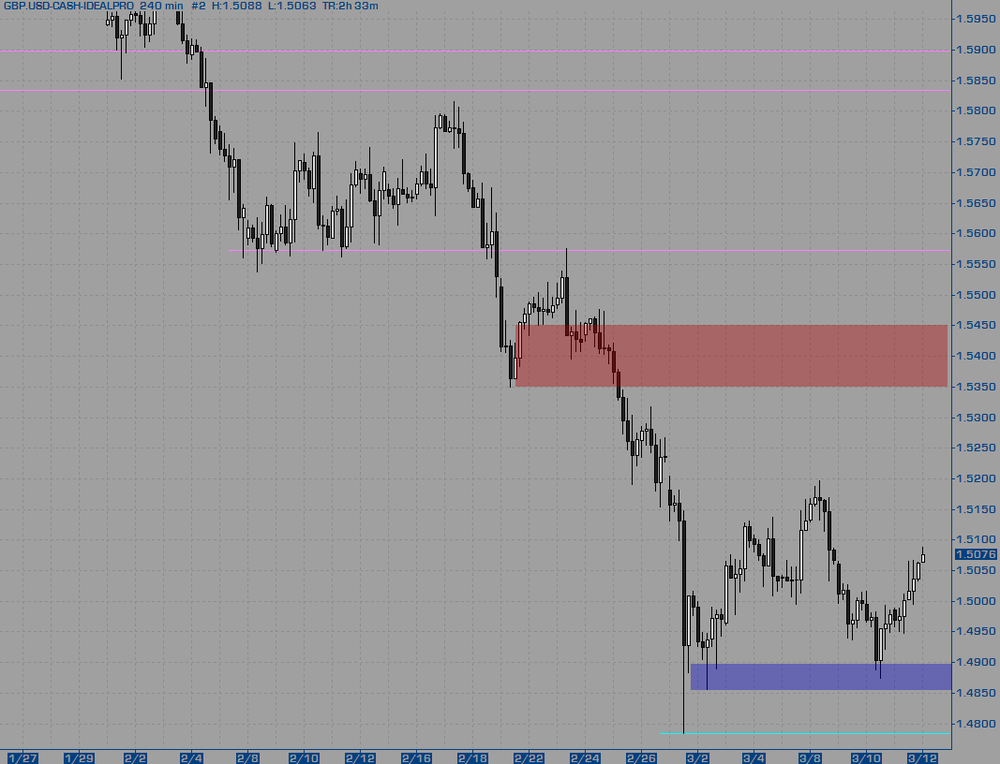
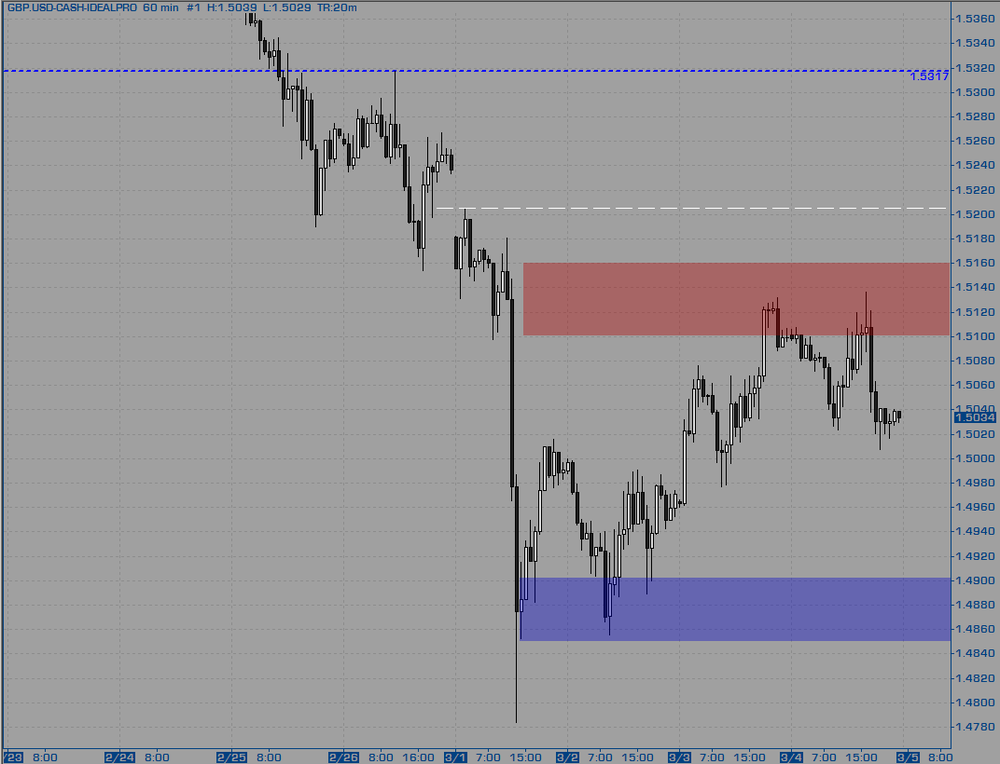
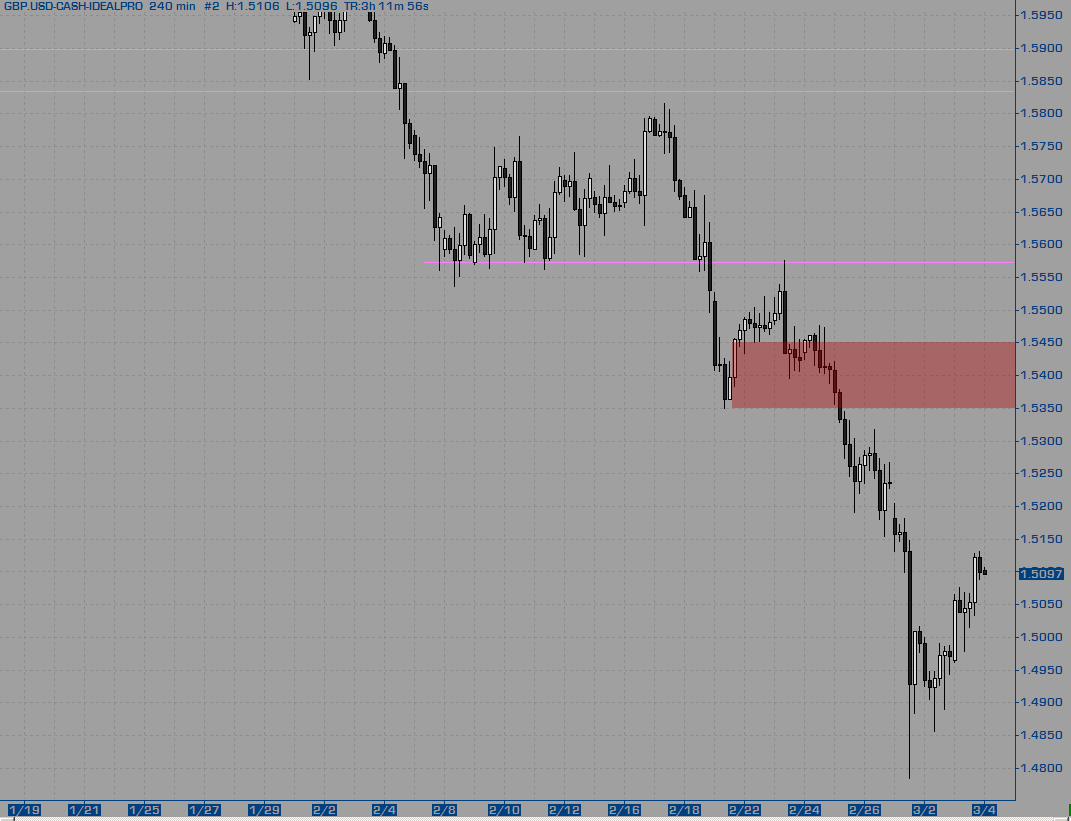
Continuing to react from the test of the last S before capitulation low as the pivotal minor R resolved to become pivotal minor S for a solid bounce in USA session. Overhead resistance is not far away for testing the pullback highs and I will expect a fairly decent reaction there before the pullback high is exceeded.
I note that lately I've been happy to play both sides of the market because I'm anticipating volatility or at least wiggle (not necessarily wild swings) from this capitulation low theory.
Attention Points
1.5240/80 refined zone within upper R just prior to exhaust low
1.5120/200 rally high R zone
++ 1.5074 ----------
1.4980/5020 pivotal minor S
1.4850/900 last S before capitulation low
1.4783 capitulation low
Certainly will be alert for longs should we be so lucky to come back and test the upper edge of the pivotal minor S/R in the 1.5020 area with 1/2 off before 1.5120 trades, another 1/4 off before 1.5160 trades and trail the rest for a test up to 1.5240/80 area.
Look for shorts in the rather large area of the rally high R zone 1.5120/200 but be a little more aggressive on scaling out as I do a favouring for the long side. Cover 1/2 before PDH in the 1.5060 area and another 1/4 before the top of the pivotal minor S at 1.5120, trailing the rest for a move into 1.4940/60 area.
-
UB,
So what if they get laughed out of the room. Quant trading isn't the only way to make money. Are you implying that it is?
With kind regards,
MK
-
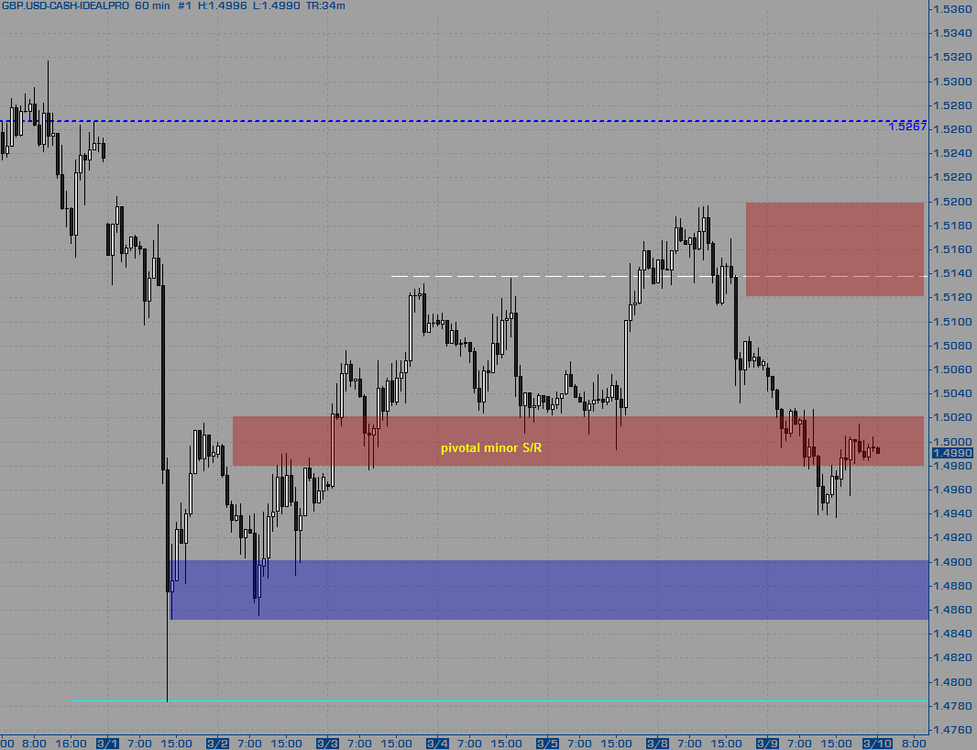
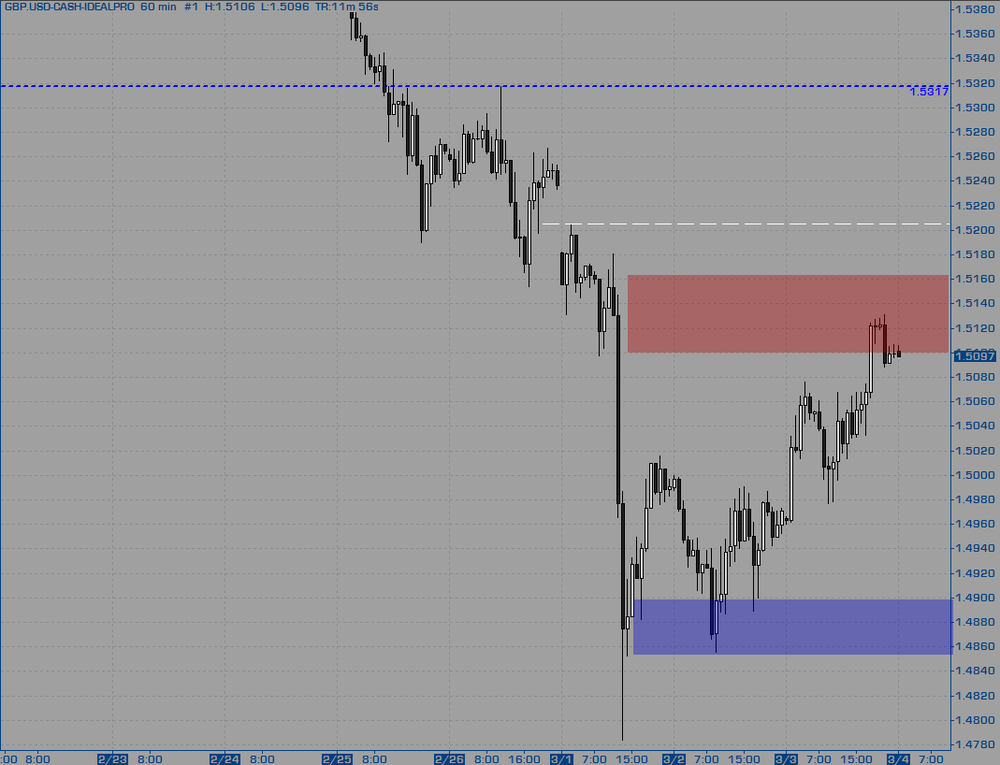
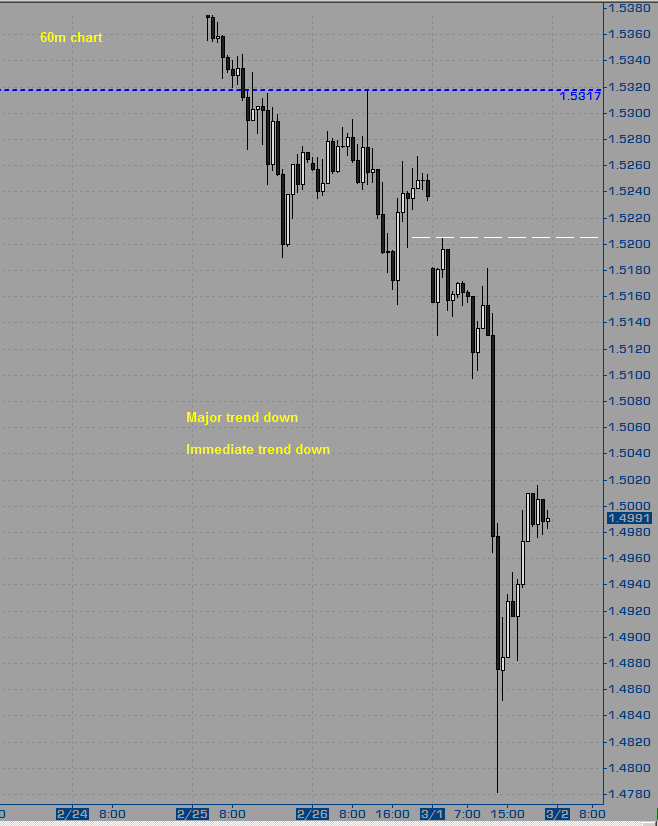
Most of the yesterday continued with the downward momentum from Monday until the USA session staged a minor rally back up into that pivotal minor S/R for a flip. Yesterday took out the immediate support putting the major and immediate trend back in alignment to a down state. Continuing to favour shorts within the pivotal minor S/R zone, but will trade a flip to the long side should that happen.
Attention Points
1.5120/200 rally high R zone
1.4980/5020 pivotal minor R
<------ 1.4990 --------
1.4850/900 last S before capitulation low
1.4783 capitulation low
Working with the capitulation theory still, a test in the 1.4850/900 area would be normal so I shall stay alert in that zone. Longs taken in there will be out of 1/2 within the pivotal minor S/R zone of 1.4980/5020 and ideally looking for a multi-day move back up to at least 1.5120 . If instead the market rallies cleanly through the pivotal minor S/R, then I will look to buy the flip with a goal to be out of 1/2 before 1.5120 trades, with an ultimate goal on the other 1/2 into the 1.5240/80 area.
I feel like I've probably missed the short from the flip of the pivotal minor S/R - we'll see how it looks when I start today late in Asia. If I have missed it in then I've probably missed the boat to get on the short side with the easy stuff. I'll keep an open mind on the shorts though but more than likely just scalps if I see anything obvious.

-
Hiya,
I think in the FX land there are lots of shady brokers so it pays (literally) to put them under the microscope. I use an Oanda account as a test bed for trading just because you can set the trade size to absolutely any size you want and experience it with real data. I've had no issues with them. I use interactive brokers IDEALPRO product for my serious FX trades and have had no issue with them either. From my experience, IB offers an honest ECN product for the FX world.
I hope this helps ya some. GL with the bookies,
MK
-
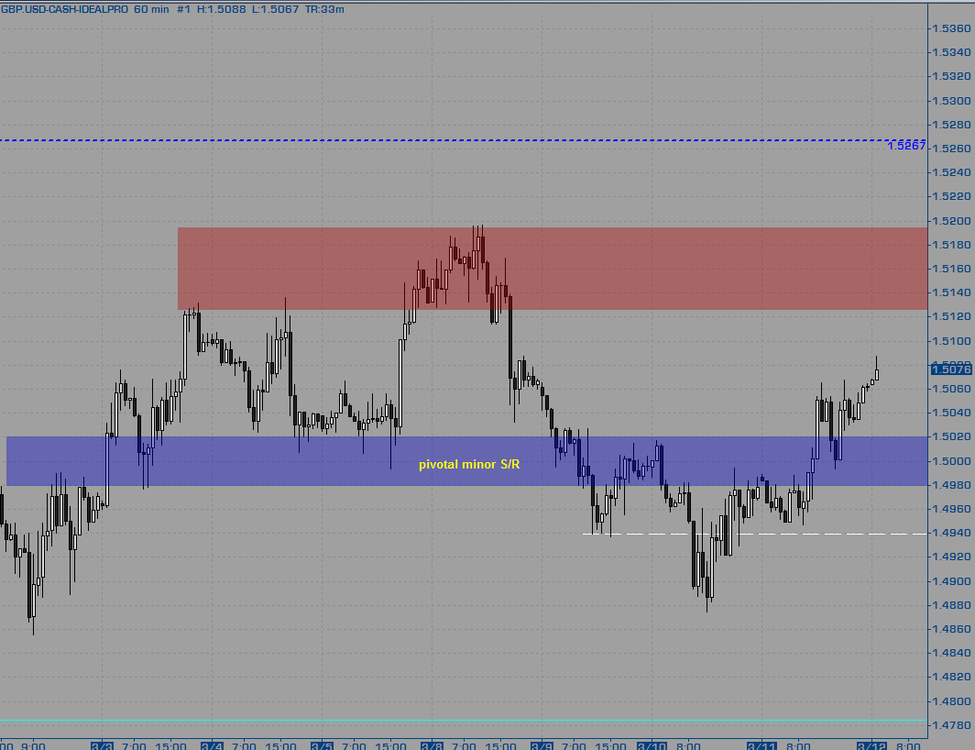
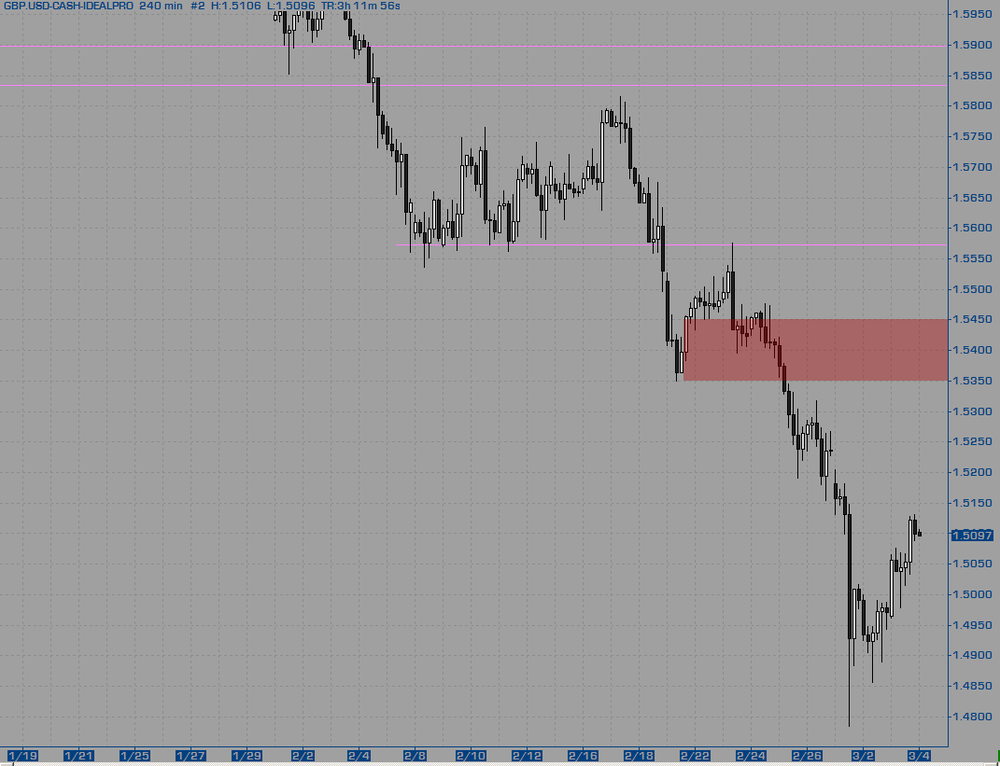
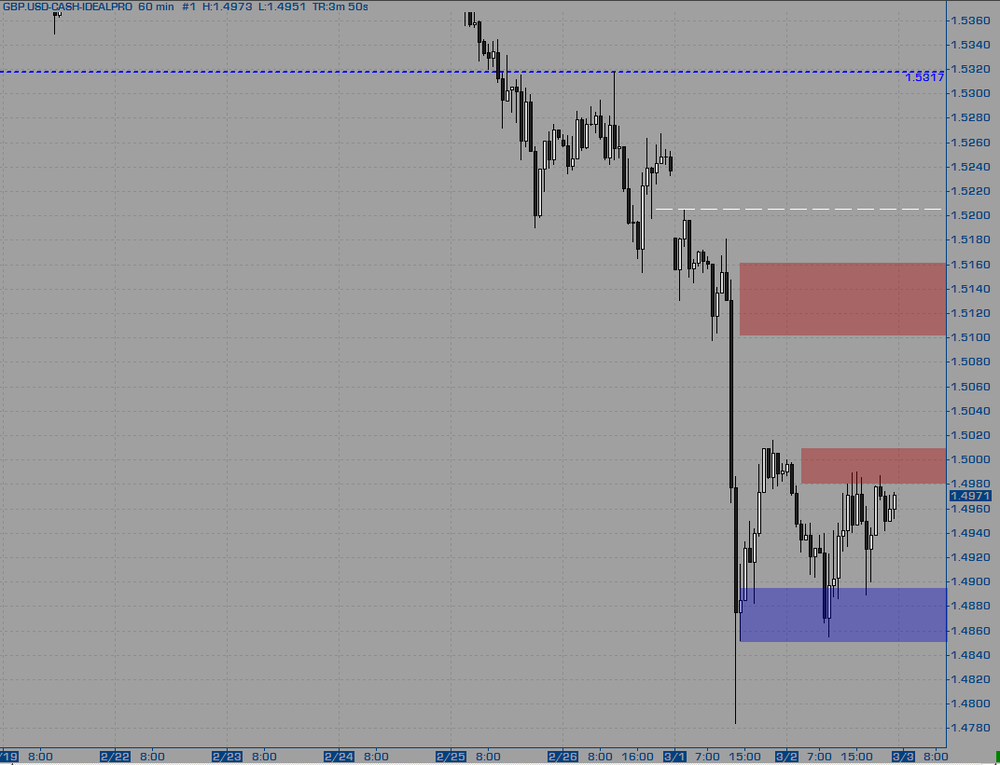
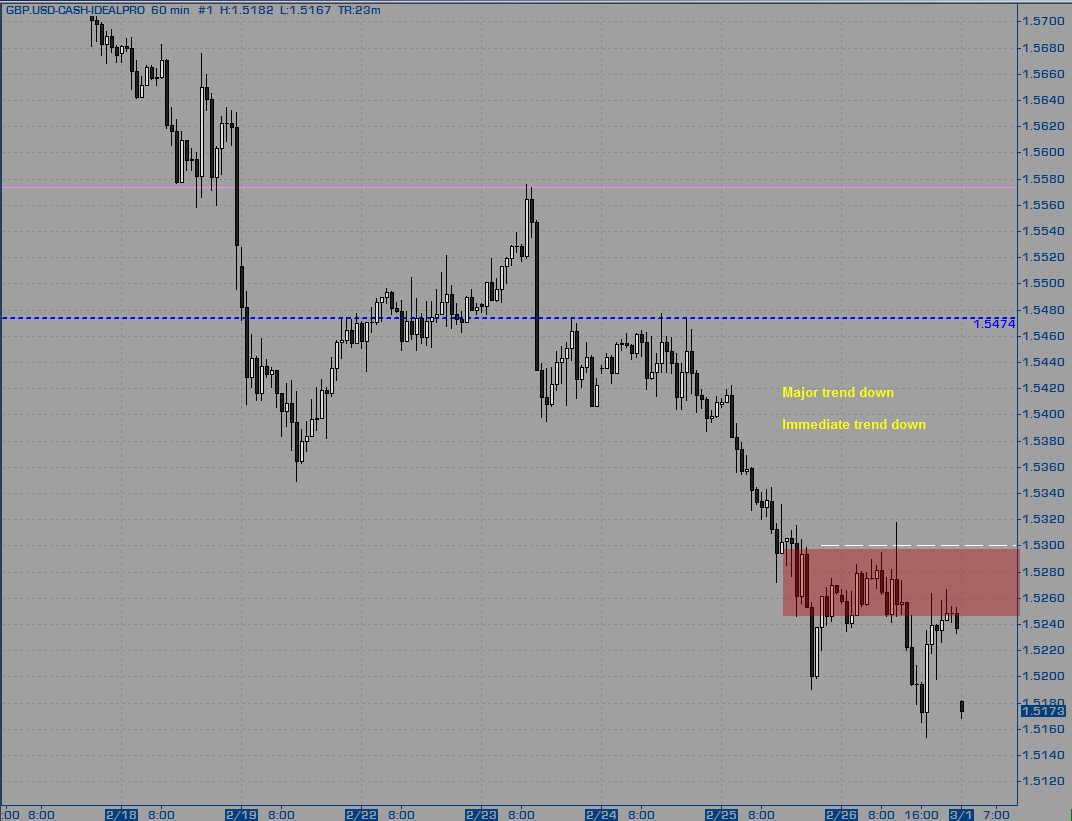
Price put in a marginal new high into the immediate R zone and sold off pausing at the key S zones. Currently price is nearly at the pivotal minor S and it is possible that we get some reaction here, maybe even to put in a right shoulder around the 1.5120/40 area. Should there end up being no long opportunity down in the PDH area then I will be looking to short the flip of the pivotal minor S.
Attention Points
1.5240/80 refined zone within upper R just prior to exhaust low
1.5170/200 PDH minor R zone
<------ 1.5066 --------
1.4980/520 pivotal minor S
1.4850/900 last S before capitulation low
Look for longs in and near this minor pivotal S in the 1.4980/520 area, in fact even up to the 1.5040 area. Any longs taken here should be out of 1/2 before 1.5120 trades and at least another 1/4 before 1.5160 trades. Trail the rest for a move into the 1.5240/80 area.
In general I am favouring shorts in the short-term because of how little we have dug into that first immediate R before the theorized exhaustion low and because the movement off the low is sloppy, especially in light of yesterdays trade. I'll take very obvious shorts in the 1.5120/80 area aiming to be out of 1/2 before 1.5060 trades, out of 1/4 before 1.5020 trades and try to ride the rest for a move into 1.4900. Should the market break below the pivotal minor S during Asia I'll be looking to short a flip on that pivotal minor S as it becomes R. I'll be fairly aggressive on that with a target of 1/2 before 1.4900 trades and 1/4 before 1.4860 trades and trail the rest down for the possibility of a new low and my exhaust theory is all wrong.

-
Do not be frustrated, Cory. Learning to trade takes time. You'll end up seeing the context over time. I guess it depends what one calls the context, to me it is a marriage of short and longer timeframe general patterns. Just as an example on the Euro there, we are getting that wild volatility within a range after a large multi-month drop, which to me puts the long side quite heavily in favour and has done for at least the last week or two for me. That is just an example of what I mean when I say context. As you can see, it is based off the structure of many days of data. It takes several years of real-time analysis and observation to see these patterns on the bigger picture enough to develop the eye.
Believe me man, I know what it is like to be frustrated at ones trading development. You'll feel like you got it, then just like that somehow it all changes. This is natural and happens to everyone. You'd laugh and maybe even be a little bit scared if you knew my story how long it took me to become a BE trader, and how long it has taken me to be at this meager level of performance today. Everyone is different. Have faith that you are doing the best you can. Try not to beat yourself up too much. Focus on your trading as a process rather than a profit.
I also agree with sevensa that ane should try and keep things just a little more constant before making changes. All of the above that anyone has written you will figure out sooner or later. It just all takes time.....
Enjoy the week ahead,
MK
-
Solid plan yesterday as the market worked at resolving the first decent R and also the immediate minor S. The current situation is where it starts to get muddy for me. I need to stay flexible and stick to my attention points today. The general feel is that more down will occur because the R has not been deeply penetrated and its had two goes at it, but it is an NFP day so that puts a spanner in the works.
I'm seeing this current minor S as sort of 'used up' so I'll pay attention at lower prices a the next minor S in the 1.4940/80 area, I'll be exiting longs here rather aggressively by exiting 1/2 before 1.5020 trades and trailing the rest as per the 15m chart. Then there is the lower S after the spike low in the 1.4850/900 area. Longs down there will be out of 1/2 before 1.5020 trades, another 1/4 before 1.5100 trades, and then trail it back to this upper R area via the 60m chart for a new high on the last 1/4.
Like shorts up in the 1.5120/60 area. Especially like them on a move above PDH. Aim to be out of 1/2 before 1.5020 trades, another 1/4 before 1.4980 trades and the final 1/4 exit in the 1.4850/900 area.
-
Yeah, but with an account <$25,000, they apparently charge a separate commission of 1 tick, so the spread for my intents and purposes would be more like 1.5 ticks...which isn't bad...that's pretty close to what FXCM micro is now.(With a $25,000+ account, the commission is drastically reduced...anywhere from 0.1-0.2 ticks, depending on the size of the account. I simply don't have that much, though.)
I'm not sure where you see the commission based on account size, it is based off trade size. You can see the breakdown yourself on their website under the fees section, but its something like if you trade 25k - 1bln a month you will end up paying the greatest of either $2.5 each way or 0.2 basis point * trade value. Clearly you can see that its not a lot, and with spreads on the euro at often 0.5pip it can work out better than the futures.
-
That really doesn't seem like that big of a difference...1 pip...is it really worth moving to another broker? I'd really like to stick with FXCM...I haven't had any complaints...I'm especially impressed with the consistency of the spreads...even through news...Oanda will spike their spreads up to 10-15+ pips sometimes!! FXCM doesn't do anything like that. Plus, I've gotten virtually no slippage...including with my real account.
Hi-ho Cory,
1 pip difference maybe doesn't make a lot of difference but I do always like to have extra pips in my account rather than the brokers. With IBFX you will have the Euro fairly consistently at a 0.5 pip spread. Pretty darn good I think. Yes, Oanda will widen spreads at news time, but it is a tiny fraction of the trading day. Outside of news their Euro spread is 0.9 pips - again, pretty darn good I think. The real benefit of Oanda though is for small accounts as your position size is totally and completely flexible. You can actually do the X% risk without needing to round or whatever. I like Oanda as a test bed, but use IBFX for the real deal.
 :bag_of_salt:
 MK :yes sir:
-
I am currently trading only futures, but I had an account with IBFX and they were ok. Personally, I do not like the fact that the charts only show bid prices, but if you are already used to metatrader then it won't be a big deal for you.Hi MM,
I don't know what you mean here. Any decent platform I have used lets you plot FX in various ways from bid, ask, or midpoint. This is not some restriction from IB.
With kind regards,
MK
-
A good solid up day into the immediate R. Anticipating some correction to the downside in this R area. Should that not occur, it would be a surprise and strong reinforcement for the capitulation theory I have been playing the last couple days. The main immediate S is down in the 1.4850/900 area, but there is also what I would consider to be little less significant immediate S in the 1.4960/510 area and then even more minor immediate S in the 1.5030/70 area.
Longs in the 1.5030/70 area and will scale fairly aggressively aiming to be out of 1/2 before making a new high. Longs in the middle of this range, the 1.4960/510 area will be out of 1/2 before 1.5060 trades and out 1/4 before 1.5120 trades trailing the last 1/4 into the 1.5200 area. Longs down near the bottom of the range in the 1.4850/900 area will be out of 1/2 before 1.4980 trades and trailing the rest as per the 60m chart for a test of the upper range (about where we are now). I don't think we'll see this last long scenario today as that would be a pretty sizable drop, but anything can happen.
I do feel compelled to be alert for short opportunity above PDH. I'll scale out 1/2 before 1.5070 trades, another 1/4 before 1.5020 trades and probably cover the rest in the 1.4980/5020 area as I am still playing out the capitulation theory.
-
Amen to to that eNQ. I'd also recommend comparing your results to your own historical results rather than to others. Seriously man, competition is generally considered healthy in society, but when you are trading on your own from home, I think it is a huge detriment. Compete with yourself, not with others.
With kind regards,
MK
-
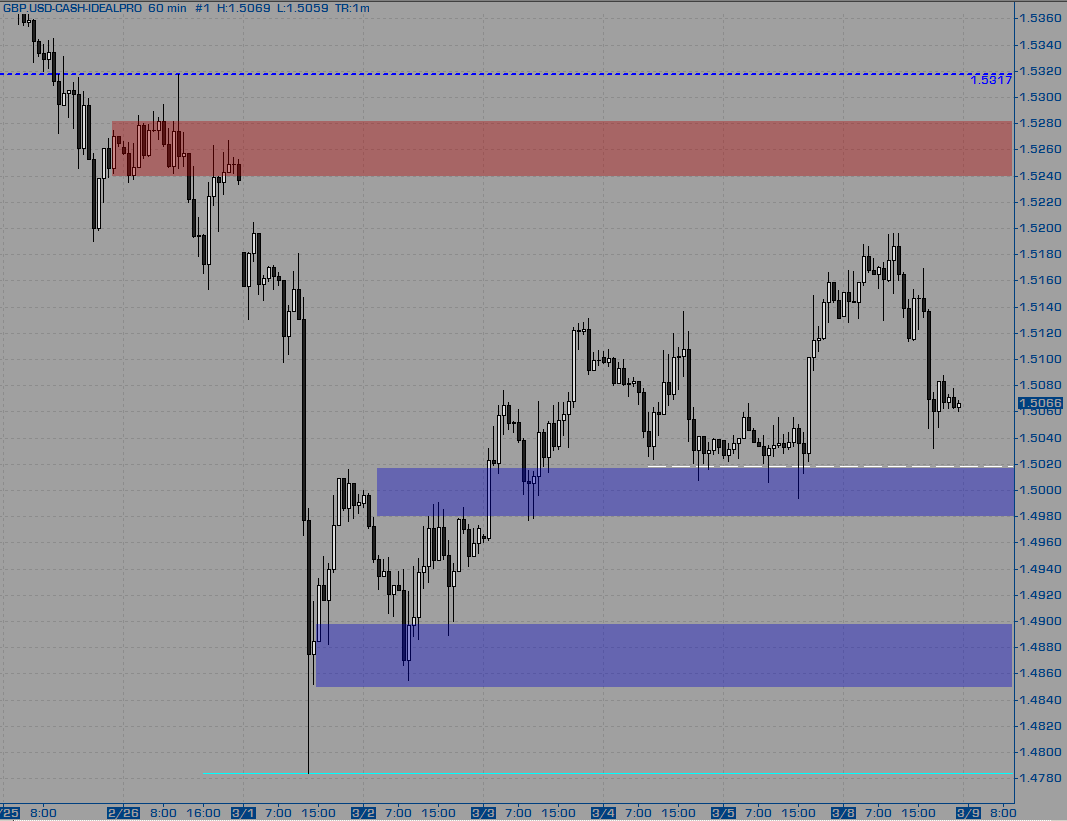
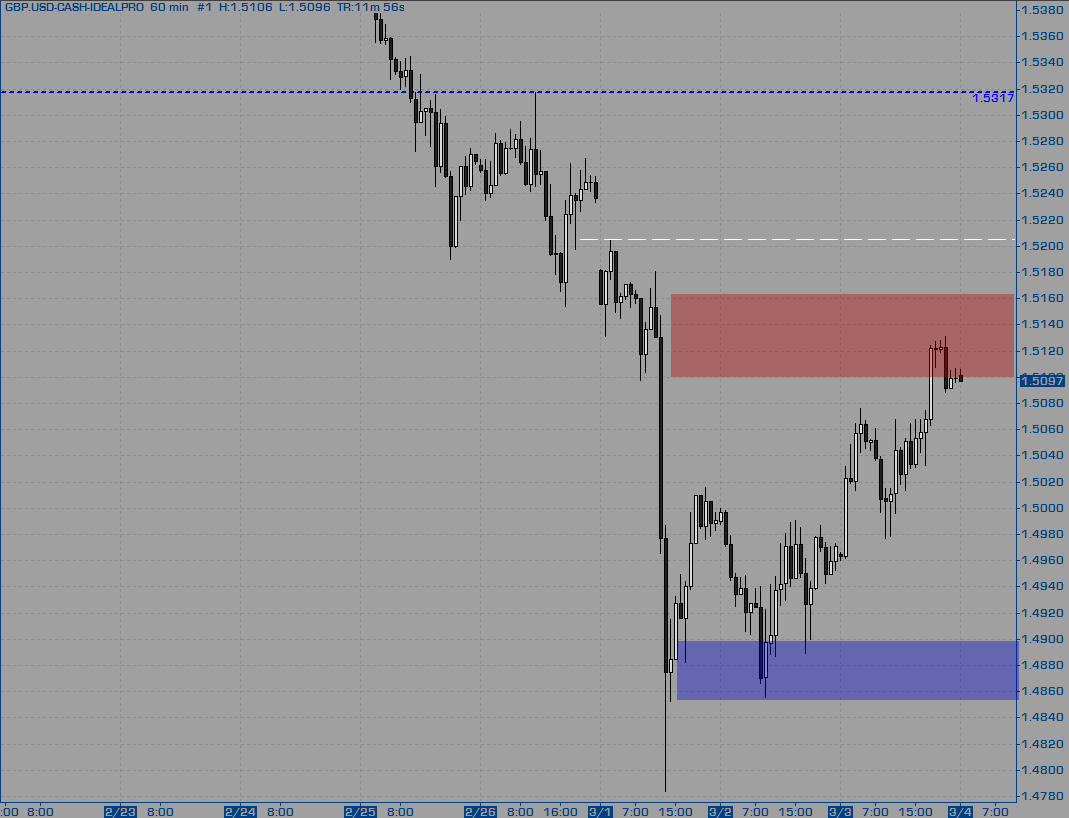
Great intraday volatility. Unable to take out the previous days developing R 1.4980 - 1.5000 area does not bode so well for my 'capitulation theory'. Despite having yesterdays buy zone a little inaccurate, I will stick with this theory until PDL is exceeded and holds.
Keen to buy in the 1.4850 - 1.4900 area, but maybe this is in the process of making HLs, if that is the case, it is possible to buy in the 1.4910/30 area. Any longs taken down here will be out of 1/2 before breaking the R stopping at 1.5016 with a ultimate target way up into 1.51. If the market instead breaks out of the immediate R, then I'll be looking to buy a flip as it tests it for S. Ultimate target for this again would be the 1.5100/40 area.
I'm having difficulty seeing short scenarios. That may be a huge warning sign! Stay alert for the possibility that my long bias blinds me to the short side. A classic warning would be too many losing longs, stay open minded today for the possibility that my theory is wrong! Any short taken will just be scalps unless we clearly break the 1.4850 area and then come back to test it.

-
Hiya, any chance of a chart? I don't subscribe to data for any of those markets, but I am interested in what you are doing.
With kind regards,
MK
-
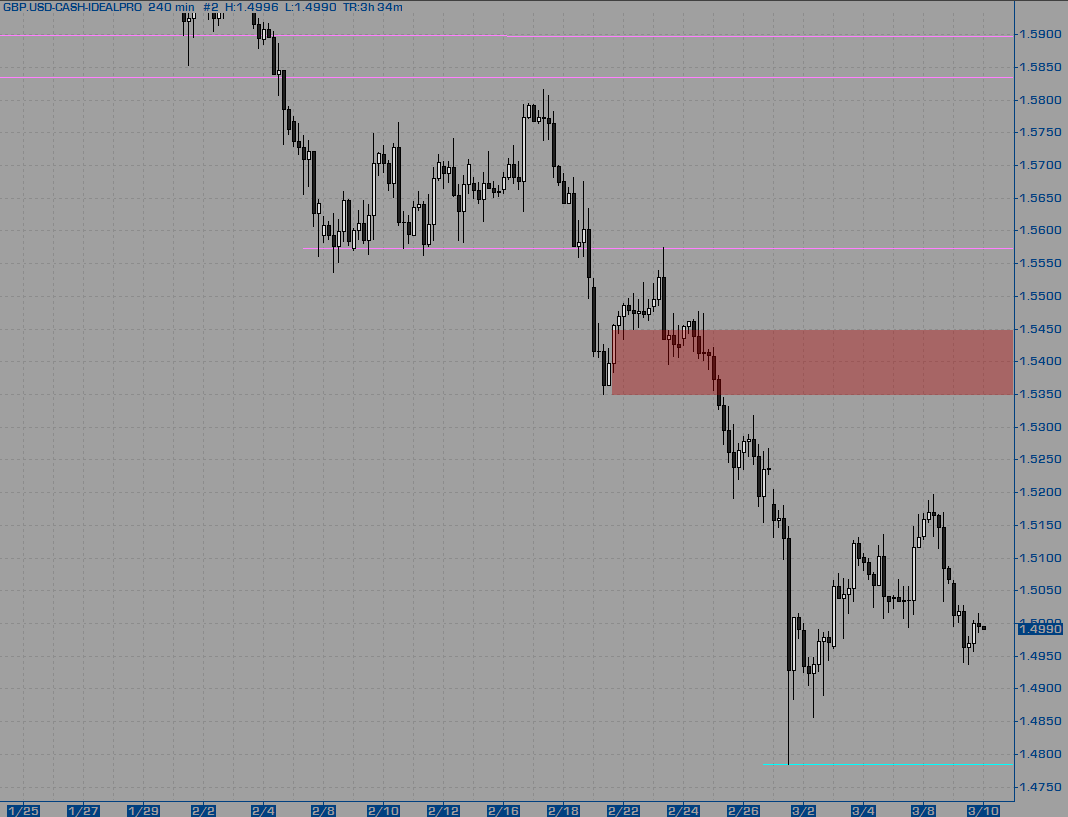
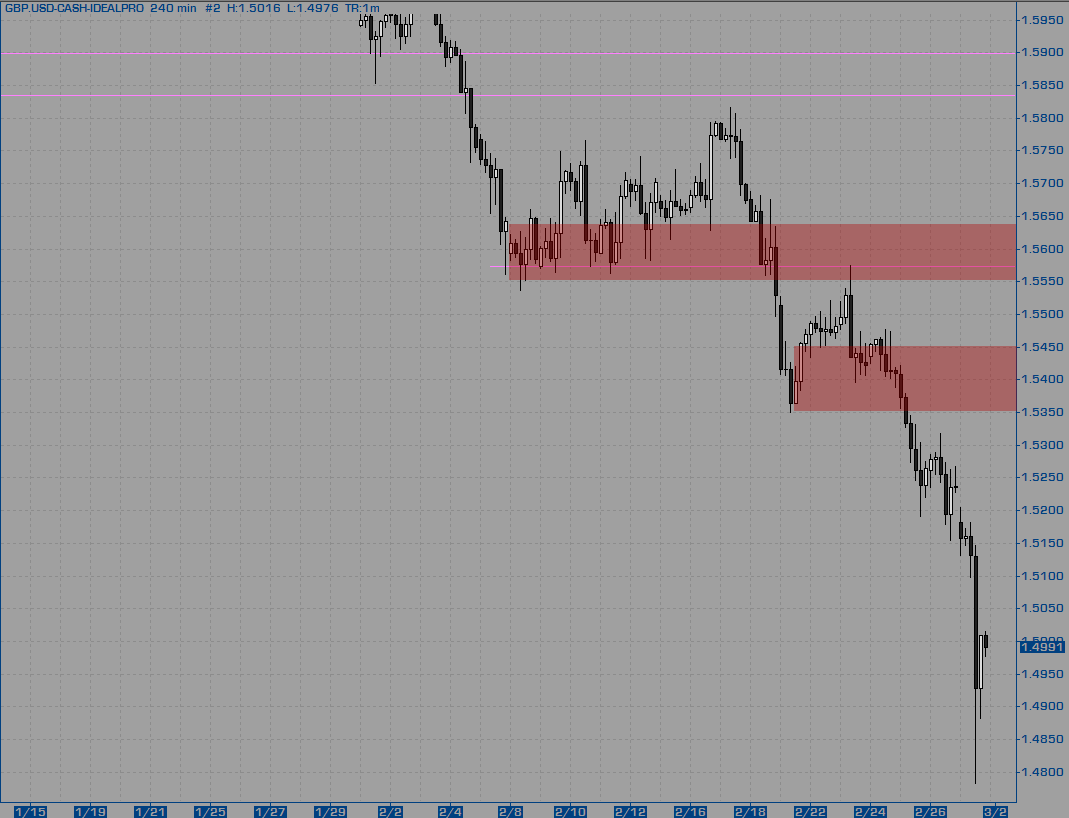
Massive down day that really felt like capitulation. If looking at a daily chart it is clear that we have been in a down trend for a couple months and now, without any breakout, we put in a huge range bar. When I was watching it real-time the 15m bar into the low put in a range of about 200 pips. Should that a true capitulation, we won't test that low for at least a few days at the earliest and all the downside testing will happen at higher prices. So I will keep that in mind going forward and use new information to measure if this was a true capitulation or not. Despite the my trend measures all pointing firmly down, I need to shift my focus to the long side for at least the next few days. The only real area I can have to get long from is in the rather large 1.4880 - 1.4950 area with a higher focus being paid to the 1.4930/50 area.
Pay attention in the 1.4930/50 area for signs of support. 1.4880 really is the last stop for much support to hold above the lows. Stay off longs if we break that until breaking below PDL. Ideal targets for longs are back up in the 1.5100 - 1.5180 area, but I will be scaling out at least 1/3 before a print of 1.5020.
I do feel excessive risk on the short side at the moment but should the market have broken below 1.4980 when I am trading tonight, and then it comes back up to test that area from below before having hit 1.4950, then I would consider a short and scaling out quite aggressively in the 1.4930-50 area with at least 3/4ths gone should it make it down to 1.4880 area.


-
Good stalk, I hope you took that and now are in the drivers seat!
-
Hi MidK,I'll be leaving the spot to my daughter. I do still watch the cash charts, same as I watch the SPX when trading the ES. But I have a feel for the futures, and my philosophy has always been of the old "if it ain't broke, don't fix it."
As to why I wanted to sell there, I see an impulsive move down off of Friday's high, and a choppy rally attempt that looks to me like a good old fashioned bear flag. There is no magic to the number, it was one tick below the resistance zone I outlined for you on this chart here, which is, of course, within the resistance zone that we played with on Friday. I expect at least a measured move off the high, and that may offer a good place to buy. As to why I then sold at 1.3649 - well, if they didn't want to let me sell it at to them at 45, they can now pay me premium!
Gotcha mate, I guess it was just that you used a limit order rather than what has been the normal 123 type thing. As I have said prior, I am drawn to this, but struggle to get precision when I have done this in the past. I had to laugh at your comment about them paying you a premium lol - nice work

-
Hi Thales,
That is unfortunate about missing a fill on that superb location. From the chart posted, I can't really see why you would have put a limit order at that price - care to elaborate? Something I notice with IB Idealpro exchange as that the spreads on EU are very often down to 1/2 pip with several million in either side at the inside bid/ask. You can trade between any spreads with idealpro just like you would expect from an exchange. Having said that, have you considered using the spot market in an exchange like this, especially since it is possible to get an even better spread than is possible on the futures.
All my best,
MK
-
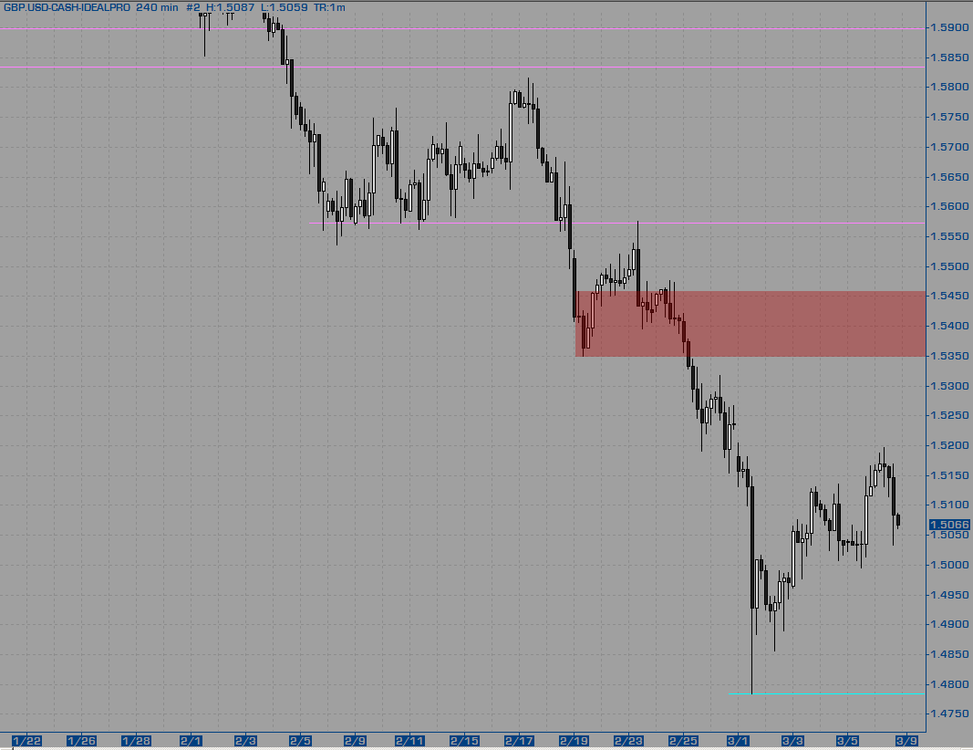
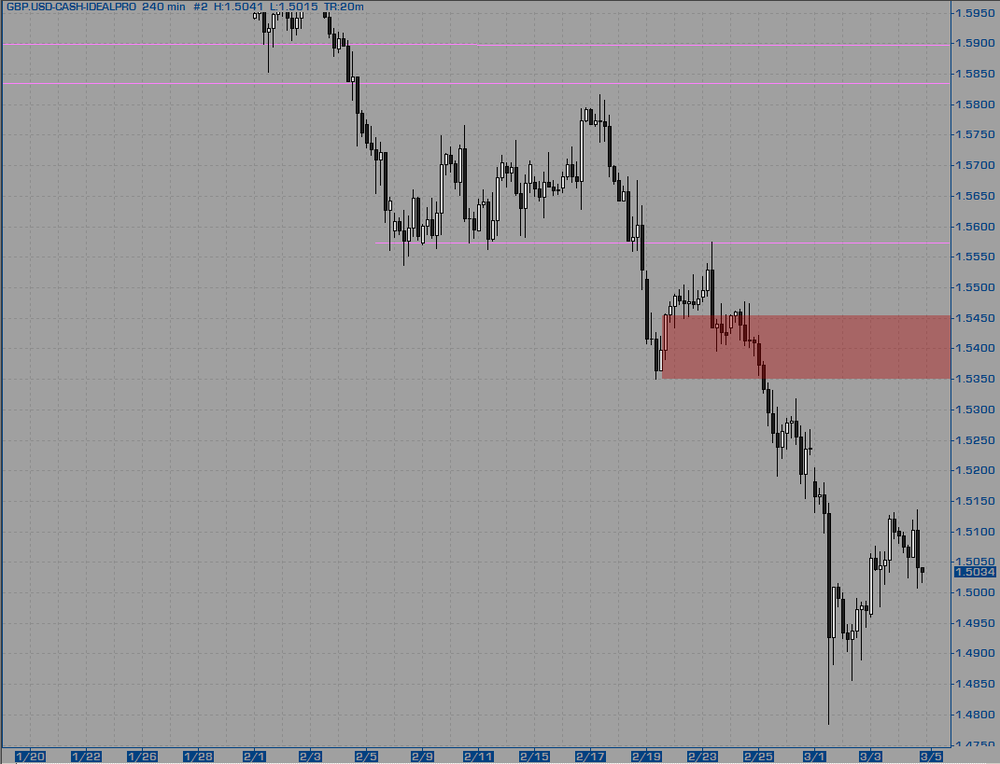
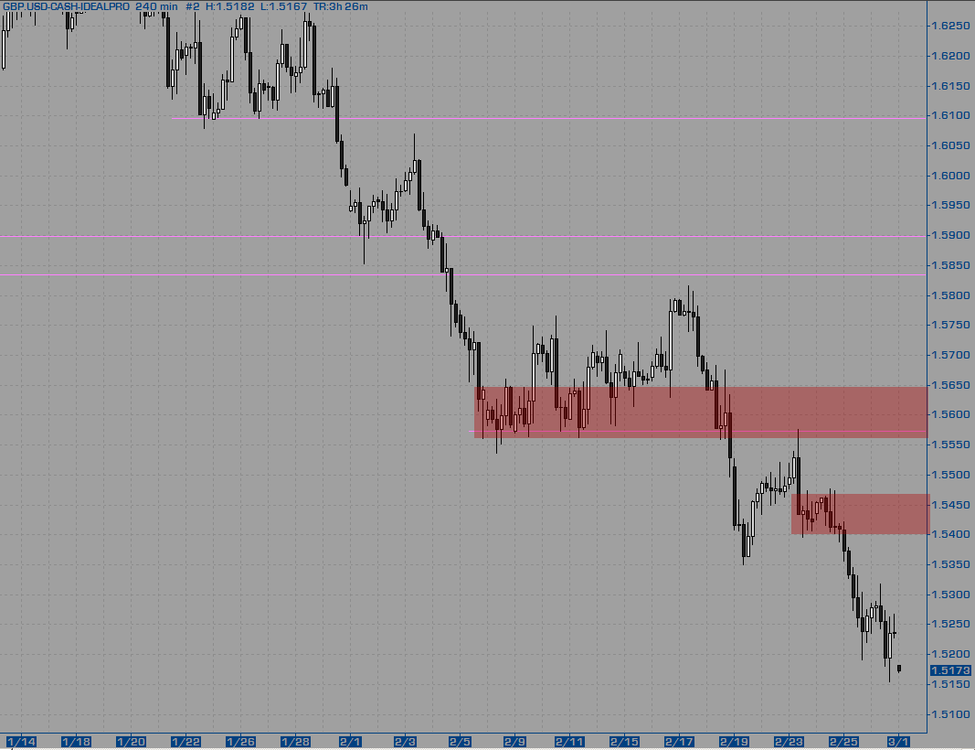
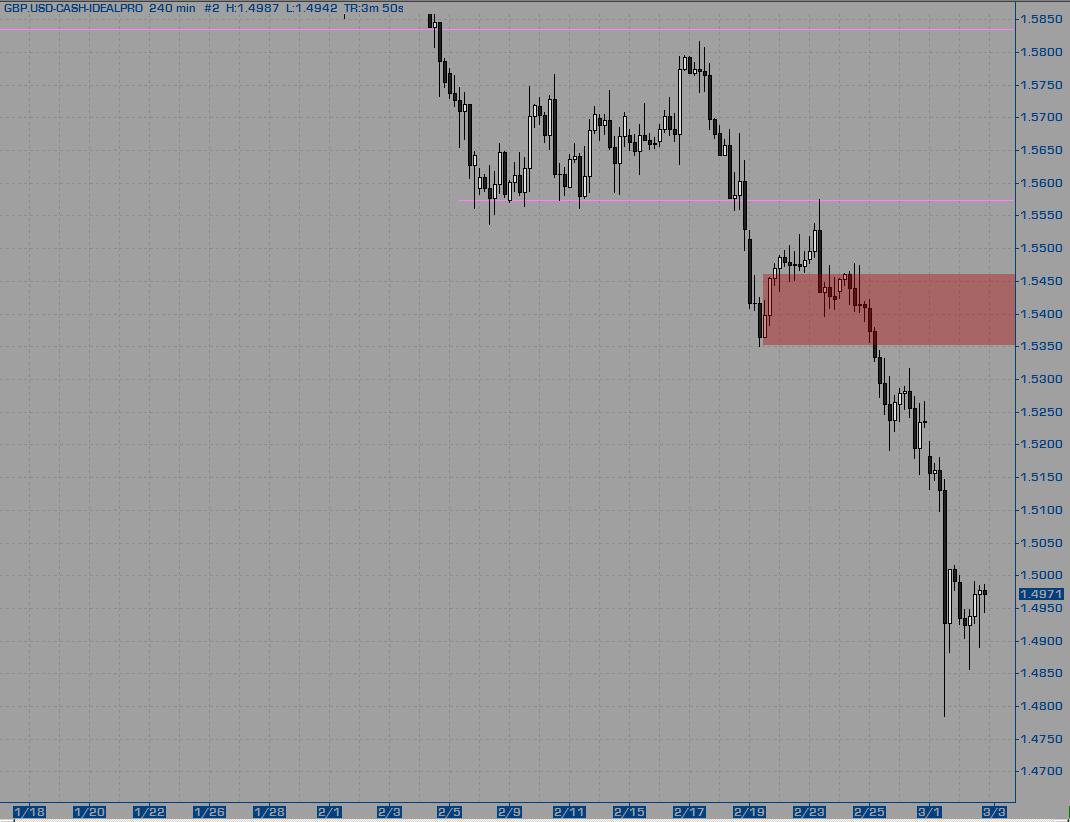
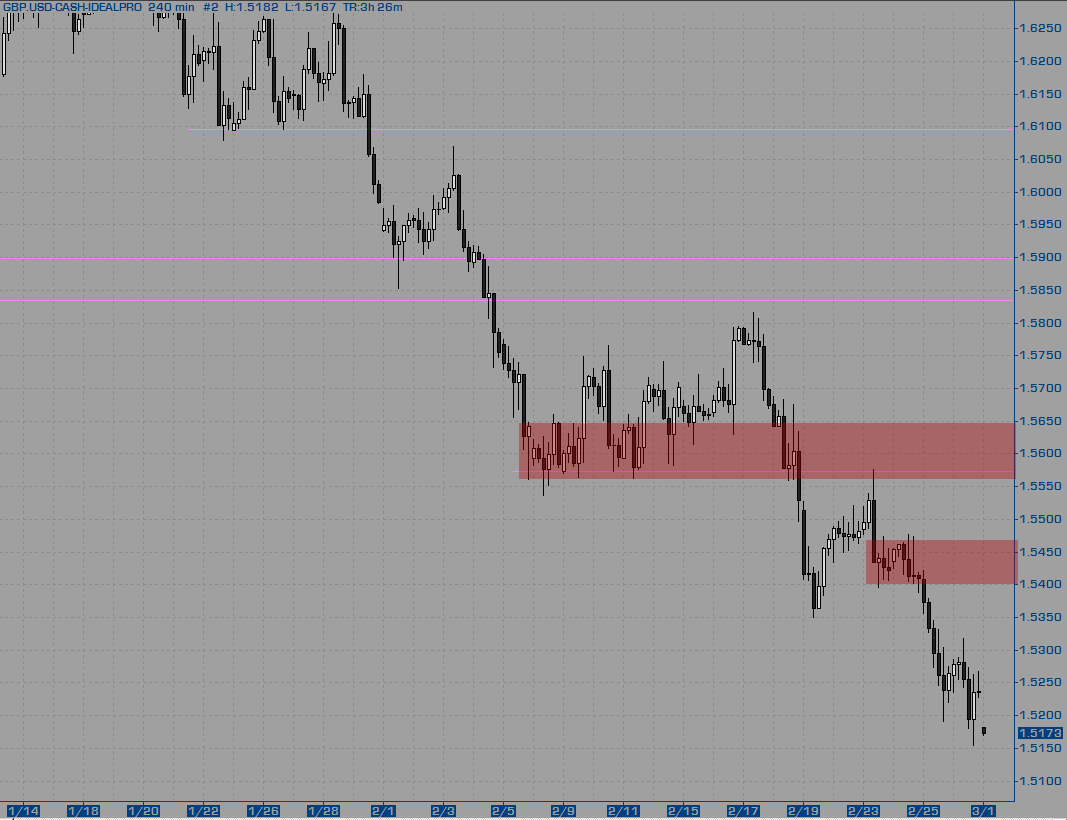
Last week put in a decent down week. This trend is clearly evident on the high time frame charts and I don't see any reason for it to stop yet. 1.50 is likely to be a big number and from eyeballing the weekly chart it is possible to see some sort of S there. On a short-term basis I have 4 theories:
- The market makes another new marginal low for a 3 thrusts pattern bringing in at the least a couple days of rally/chop.
- The market squirts higher right now for at least a couple of days of rally chop.
- The market continues to make lower boxes as per the 60m chart.
- Capitulation is always an option and I must remain open minded for that possibility.
All longs must be clearly obvious as they are against the man momentum that many various time frames can clearly see as down. Aside from obvious scalps, the only longs will be on a clear marginal new low or from a capitulation. I will aim to be out of 1/2 by the time we close today's gap open and attempt to trail the rest and scaling out the remaining 1/2 into 2 separate exits.
Waiting for shorts in the 1.5260-1.5300 area with exits planned to be out of 1/2 before hitting new lows and trailing the other 1/2 on the 15m chart after breaking to new lows. Above there we have the obvious shorts in the large zone of 1.5360 - 1.5460 area (I prefer 1.5400/60) where I will work shorts for a while. I don't think we'll see that today, but it is still part of what I am watching and starting to plan for.

- The market makes another new marginal low for a 3 thrusts pattern bringing in at the least a couple days of rally/chop.
-
We cut our initial risk identically. The difference in results was in managing stops to capture profit. He was not as aggressive as I, and it paid off in his favor.Best Wishes,
Thales
Gotcha - thanks for the reply
-
First and foremost is always "where is resistance?" and "where is support?"
Check that.
In addition to this reisitance zone, we had price at the mid-figure (00's are the figure and 50's the mid-figure).Check.
In addition to that, I did, as you noted, have a statistical possible high based upon TTT at 1.3652.Check.
I also noted that the rally was quite choppy, with price moving in overlapping waves. Overlapping waves often, though not always, indicate that a rally (or decline) is geting a bit "long in the tooth," and is perhaps due for a pause, if not a reversal.Check that too.
As for my initial stop, I use 10-20 ticks. It might be 13, sometimes 17, sometimes 15 - it depends upon where price is and how it is acting. It is usually a level set for the day and I set it in my trading platform so that if enter - whether it is a market, limit, or stop entry, I have that stop loss go in. Obviously, on the 123 entries, the initial stop is set by the higher low or lower high of the sequence. When I am selling resistance or buying support, I use a preset based upon current volatility as measured by my eye. This way I can set my number of contracts in my trading DOM and be ready to just buy/sell market if the opportunity presents itself.This is quite a skill, one I must certainly spend some time developing the sensitivity towards! This part here is the essence of what I was getting at.
Once price fell from where I entered, I wait for its first minor reaction against me, and then move the stop to one tick above the high. This occurs very quickly - I'm watching the DOM. When I say the first reaction against me, it may be as little as this: I sell at market and I'm filled at 46. price drops to 43, scurries up to 47, and then falls back to 43. At that point lower my stop - often my full R risk is cut to tenths of an R within seconds of entry for these trades.A new question, you brought up your buddy doing the CL method with you and how you two ended up taking the same trades on the day but managed them differently. I was curious if he is so quick to cut his risk like this?
I always am looking to cut risk to a point where if I'm stopped, I'm probably glad of it. I try to make -1R losses rare. You see, I can always sell it again if price probes resistance further and gets pushed back down. I did this yesterday with the 6E in the afternoon. I think I may have posted those trades here as well.Indeed, that is true. In the heat of the moment though if I find that I am taking a tiny tiny loss but the market isn't really moving against the initial position much and then I keep re-entering. In my end of day review, I may end up viewing that action as overtrading and if the original idea works out without the need for my micro-managing, then in all honesty, I'm pretty sure I would be chastising myself....
Awesome post - thank you. Label that post one for the book you may end up writing one day
With kind regards,
MK
-
Here is what my EURUSD/6E short looks like - short at 1.3646, stop loss is 1.3652, and I have a profit target at 1.3428. If I am not stopped out, this will be closed by end of day whether the target is reached or not. I had an initial stop at 17 ticks on the 6E short, and lowered it to the prsent -6 ticks, which makes the open risk on the trade -.35R ...I like doing these types of trades (no idea why I like them so much), but my problem is that there is usually very little clear market structures to lean on. I suspect you are leaning on the TTT to call this as HOD and maybe that is why your stop is 1 tick past it. How did you decide on an initial stop when you entered though?
Cheers,
MK


Reading Charts in Real Time
in General Trading
Posted
Great UJ trade. I have a couple questions about your initial stops if I may...Your first entry had a 30pip initial stop - may I ask how you arrived at that? Reason I ask is because I am very comfortable with the idea of entering like that and have done so a lot in the past. However, I was doing that with fairly large stops and would love to go back to that entry style if I could do it with smaller stops as you show here. Having said all that, I am not a fan of arbitrarily sized stops.
Then in your re-entry you only used a 10 pip stop, how did you decide to chop it down so much more than the stop used on your first entry?
With thanks,
MK