
Welcome to the new Traders Laboratory! Please bear with us as we finish the migration over the next few days. If you find any issues, want to leave feedback, get in touch with us, or offer suggestions please post to the Support forum here.


zdo
-
Content Count
3515 -
Joined
-
Last visited
-
Days Won
8
Posts posted by zdo
-
-
Here is a modification of Ant's MarketDelta 'footprint' code that implements a threshold free, dynamic coloring gradient for the balance at each price.
The coloring algorithm serves as a pretty good template for auto-coloring of other indicators, etc. See comments in code.
-
What is Delta Divergence? Thanks.
-
Hi zdo - I dont use tradestation and am not up to speed with TickMoneyFlow, if you could describe what it is then I could compare it with Delta?MisterEd,
Here is the code I am using for TickMoneyFlow
{-------------------------John Hudson's TickMoneyFlow Indicator------------------------}
{This code tries to keep up with how much money is actually entering or
leaaving an issue in order to measure the buying or selling pressure on prices.
It uses the snapshot Bid and Ask(CurrentBid, CurrentAsk) fields
provided by TS to gauge whether a trade was  initiated from the buy or
the sell side. Although you can never be sure whether a trade hit the tape
in proper sequence with the Bid/Ask data, in general trades initiated from
the buy side will go off at the Ask and trades initiated from the sell side
will go off  at the Bid. In the case of a trade going off either between
the Bid and Ask or outside the Bid and Ask, this code attempts to assign
the trade to the most likely side of the market based on whether the
trade was above or below the trade before it or, if the trade before it
was at the same price, it determines what the status of the market was
of the most recent trade in the past that was different from the current
trade's price. This code will run on any time interval.....
from 1 tick bars to daily bars.            }

[LegacyColorValue = true];
Inputs:
Length1(2),
Length2(89),
ShowLinReg(false)
;

Vars:
IntrabarPersist TickFlag(0),
IntrabarPersist OldPrice(0),
IntrabarPersist TMF(0),
IntrabarPersist NewTickVol(0),
IntrabarPersist MyBarVolume(0)
;

if BarNumber >= 1 then begin
NewTickVol = Ticks - MyBarVolume;
MyBarVolume = MyBarVolume + NewTickVol;
if (C>=CurrentAsk) then begin
 TMF=TMF + (C * NewTickVol);
 TickFlag = 1;
end;

if (C<=CurrentBid) then begin
 TMF=TMF - (C * NewTickVol);
 TickFlag = 2;
end;

if (C<CurrentAsk and C>CurrentBid) and C>OldPrice then
 TMF=TMF + (C*NewTickVol);
if (C<CurrentAsk and C>CurrentBid) and C<OldPrice then
 TMF=TMF - (C*NewTickVol);
if (C<CurrentAsk and C>CurrentBid) and C=OldPrice and TickFlag = 1 then
 TMF=TMF + (C*NewTickVol);
if (C<CurrentAsk and C>CurrentBid) and C=OldPrice and TickFlag = 2 then
 TMF=TMF - (C*NewTickVol);

OldPrice = C;

if BarStatus(1) = 2 then
 MyBarVolume = 0;

end;

Plot1(TMF, "TMF");
Plot2(ama(Plot1, Length1), "");


if ShowLinReg then begin
Plot3(LinearRegValue(Plot1,Length1,0));
Plot4(LinearRegValue(Plot1,Length2,0));

end; //if ShowLinReg
The key logic is:
if (C<CurrentAsk and C>CurrentBid) and C>OldPrice then
TMF=TMF + (C*NewTickVol);
if (C<CurrentAsk and C>CurrentBid) and C<OldPrice then
TMF=TMF - (C*NewTickVol);
if (C<CurrentAsk and C>CurrentBid) and C=OldPrice and TickFlag = 1 then
TMF=TMF + (C*NewTickVol);
if (C<CurrentAsk and C>CurrentBid) and C=OldPrice and TickFlag = 2 then
TMF=TMF - (C*NewTickVol);
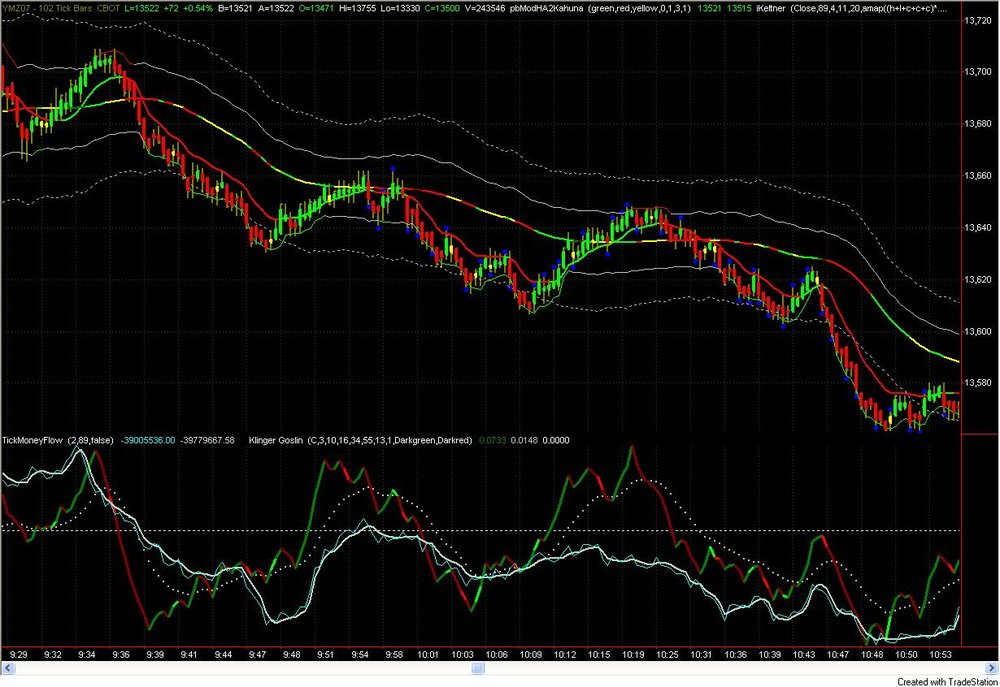
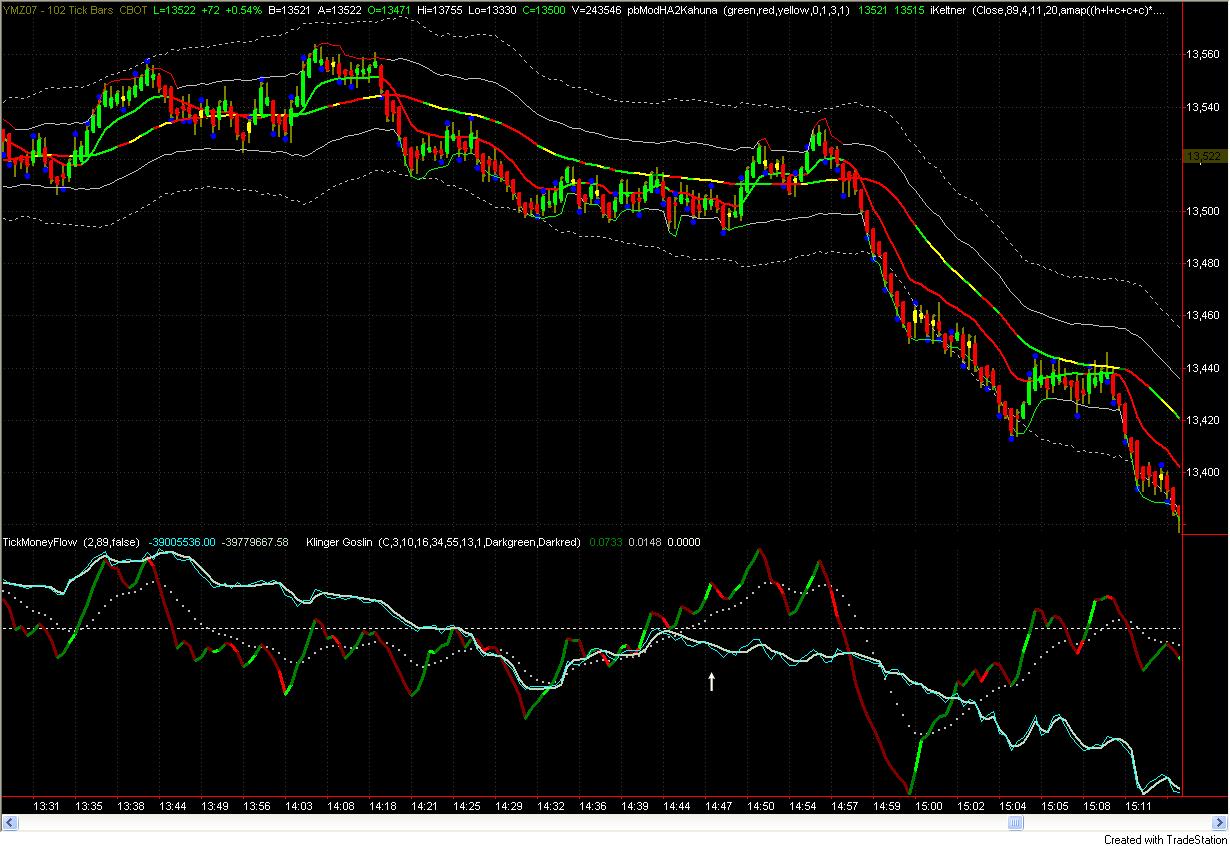
Screen shots are attached for some of today’s action in a 102 tick YM chart.
TickMoneyFlow1.jpg shows the first hour and a half of trading. Notice at around 10:10 the directional and angular congruency with KlingerGoslin (oscillator) started to fall apart – rally was snuffed and TMF led way downward.
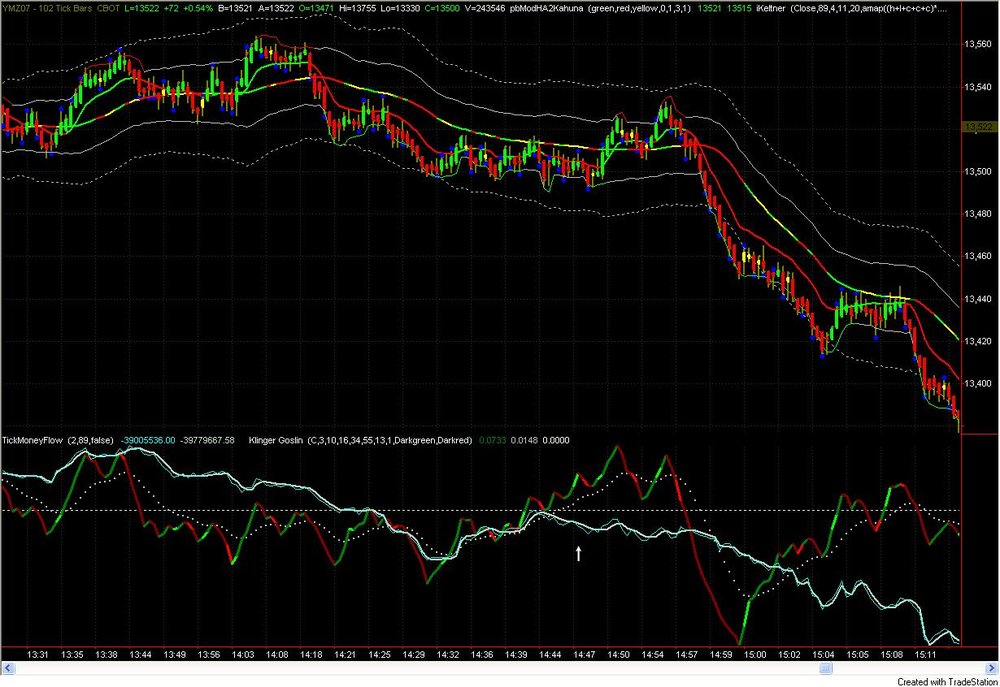
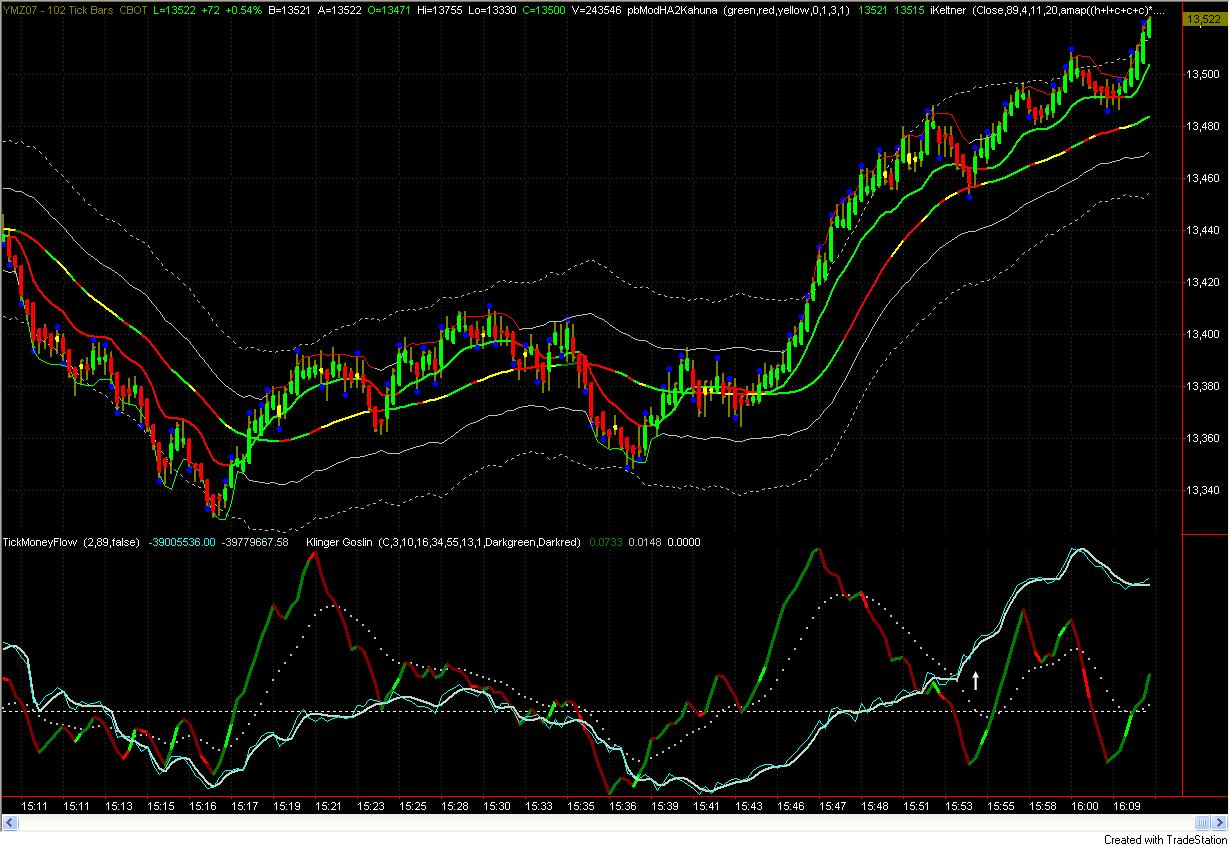
TickMoneyFlow2.jpg shows angular divergence at about 14:45 (see white up arrow). Again rally was short lived. Over at around 15:02 the KlingerGoslin ‘rallied’, but it was unconfirmed in magnitude by TickMoneyFlow and further sell off ensued.
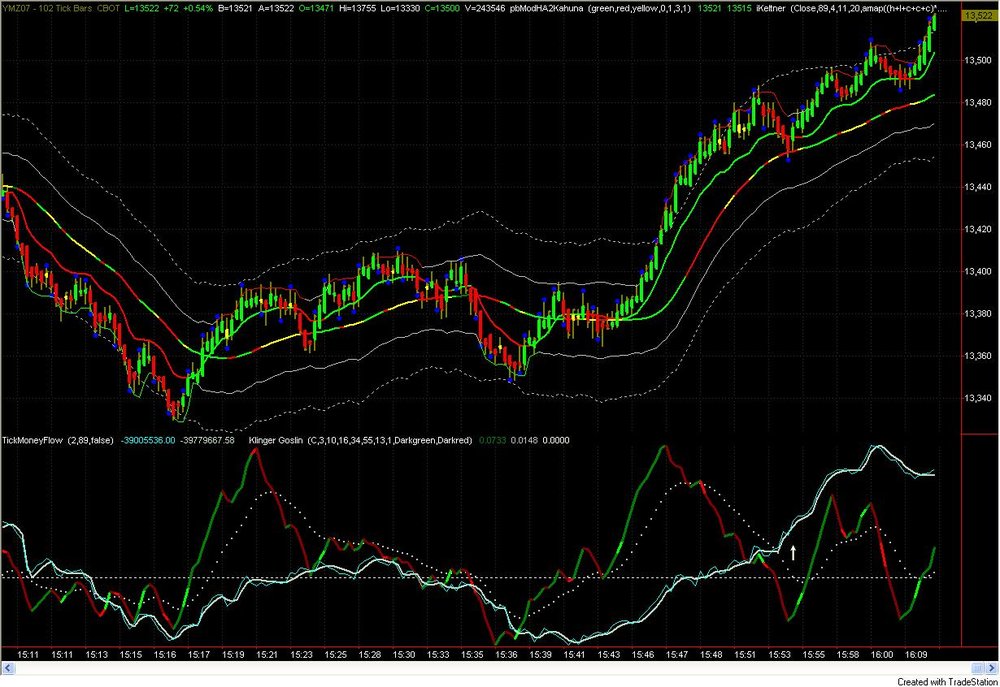
TickMoneyFlow3.jpg shows strong buying on the KlingerGoslin from 15:16 through 15:20 presaging the late rally but the ‘aggressive’
 action shown on TickMoneyFlow delayed it until ‘aggressives’ capitulated / reversed at around 16:42. At around 15:46, after KlingerGoslin had faltered, the ‘aggressives’ carried the rally into the close…
 …maybe :\
As I compare the code for TickMoneyFlow with MarketDelta code (which, in TS, is in arrested development now because the Bid Ask data is random snapshots / is inaccurate (ie has a median inaccuracy of about 2.5% compared to T&S prints - but can err much higher)) I see immediately that TickMoneyFlow uses CurrentBid and CurrentAsk while MD uses InsideBid and InsideAsk and upTicks and downTicks
But my same original questions hold:
Is TickMoneyFlow a ‘squigly line’ representation of MarketDelta?
Or is it a different perspective on / dimension of 'volume'? and
How does TickMoneyFlow relate to the original question of this thread?
Many thanks.
-
Thanks for the reference.
Aren't divergences btwn price and the TickMoneyFlow (standalone ie not considering KGI at all) equivalent to Delta divergences?
-
In TS, for the last week or so have been watching KlingerGoslin() and TickMoneyFlow() indicators plotted in the same subgraph using a TickBar data stream.
Scaling for both indicators is on NoAxis, Date range on screen.
KGI parameters are set fast (c,3,10,16,34,55, 13, 1, Darkgreen, Darkred).
(If you need I can post pictures or the version of the KGI I'm using)
Their movement is usually highly correlated but they also show some pretty neat divergences / disagreements, etc.
Is this a ‘squigly lines’ representation of what this topic is exploring?? Thx
-
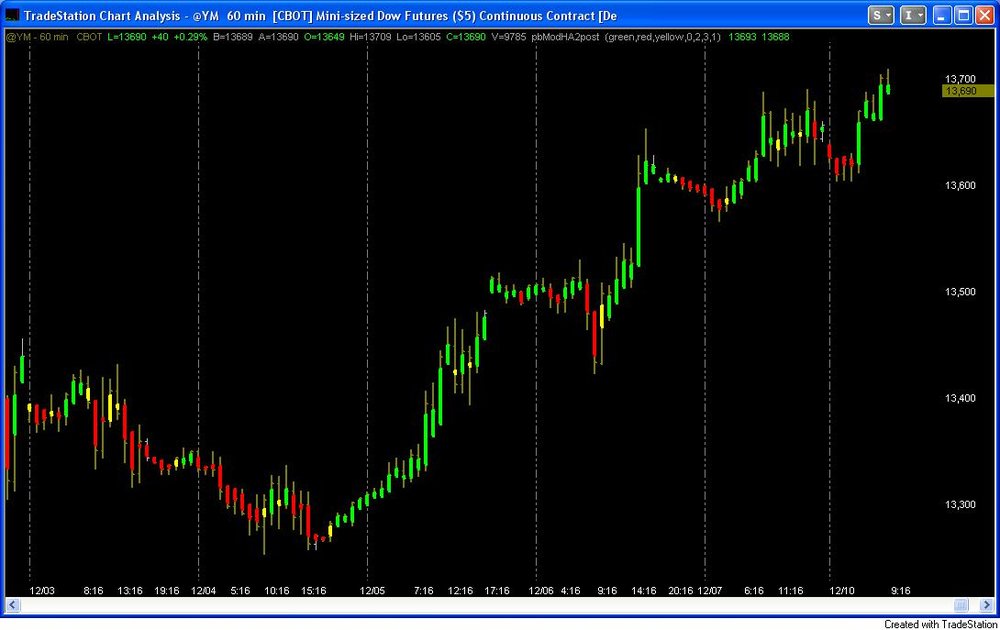
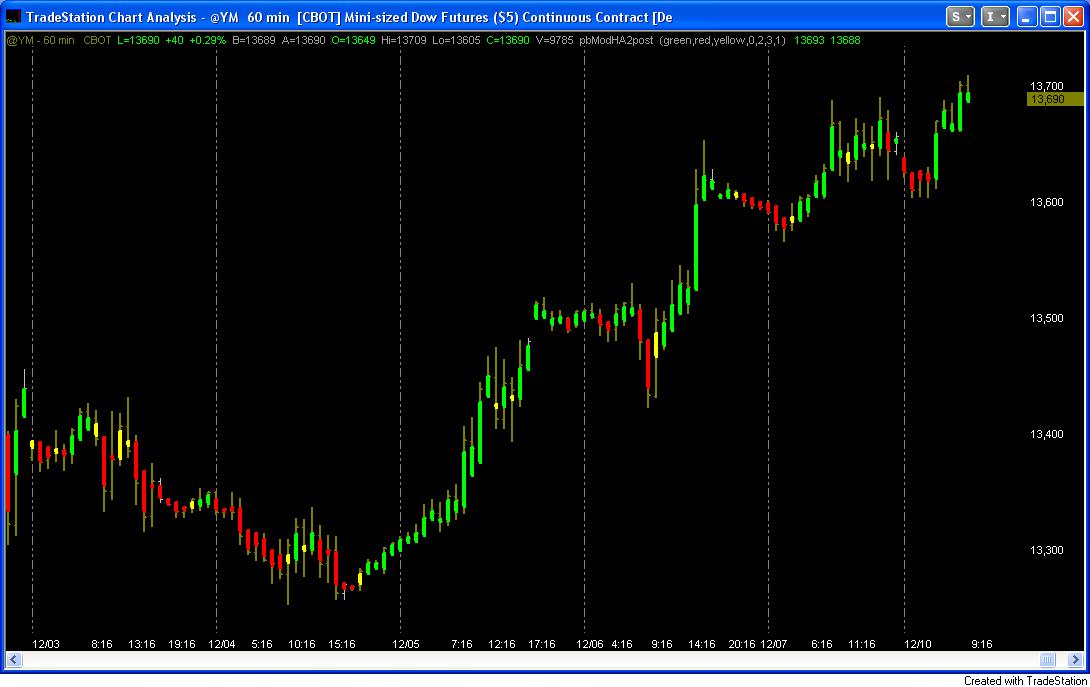
Here is a screen shot of YM 60 minute chart for a week with this paint bar.
Thanks, all, for all the other HA indicator contributions.
-
One other possible benefit – wrote HA as a function that can be called by systems and other indicators… most TS paintbars have the HA calculations inline
-
Here is a useful variation on Heikin-Ashi.
“Determines HA direction for two (Min/Max) number of Compare bars
and displays the Up Color if they agree in the Up direction,
displays the Down Color if they agree in the Down direction,
and displays the Warning Color if they do not agree. “ paraphrased from code comments
Defaults
Min to 0
Max to 1 // very granular diff btwn min max, but still 'low whip'
upColor to Green
dnColor to Red
warnColor to Yellow
Original idea credited to KAHUNA on TS Boards (who, btw, is also an EL code and systems developer. Disclaimer: I have no financial or personal affiliations with him. He just seemed to always post clean elegant code...)
-
james,
Actually Douglas does have a method. It’s very old fashioned; no subliminals, no affirmations (as they are typically thought of in ‘the secret new age of attraction’), no mental techniques or tricks…
His method is hard and simple - Do ‘it’ until you Be it.
Mark would say something like '(faithfreely and unerringly) do ‘it’ until you (unerringly and faithfully) are it'.
However, that brings out a polarity - because others are touting a more “Be it until you do it†approach
An example of this way can be found at http://www.stevepavlina.com/audio/
Audio #018 and the accompanying docs at http://www.stevepavlina.com/blog/2007/01/stevepavlinacom-podcast-018-faster-goal-achievement/
... this also relates some to the “I have an image†paragraph of your most recent post...Maybe liston to Audio #020 too… hth
What would spell both for you? (and not necessarily simultaneously)
All the best,
zdo
-
Techtrader,
Do you know specifically where it's buggy or not producing correct results?
ie how to replicate the bugs?
zdo
-
Sparrow,
What language did you write it in?
If VB or C++ or C# would be very interested in seeing the source.
Many thanks.
zdo
-
Anyone done an analysis of the Dow this week in terms of VSA - especially 11/28?
The strength = weakness ?
Thanks, zdo
-
Just got the new member ‘post or perish’ msg when I came up this time. So, here’s a post - that includes a short self -introduction.
While looking at price and volume threads on T2W, followed a reference to TL Forum and here I am. My user names are ZDO on T2W, obx on TS forum, (and I forgot it on ET) - should you need to check the intention and tone of my legacy posting.
Have only found time to look at a few pages but, so far, TL is a breath of fresh air. Going forward, as I plow through all 83 pages on this thread will I find herein any digests of the principles of VSA ? Any special pages on this thread to get the big picture? Also, is the book complete? ie does the Tom Williams book disclose all the patterns used in the software? Many thanks.
zdo

"Market Delta" Footprint for TradeStation
in Trading Indicators
Posted
re Testing: Yes it is for real time only. I only looked at this on a YM 1 minute charts just before posting it to make sure it still works. Try a shorter time frame first then increase time frame to see if coloring technique is robust for your instrument… SwissTrader on TS offers a commercial ade version that will paint historical data.
re: “kind of pale†This code also seems to produce progressively paler paints as the day goes on. Would appreciate any ideas to stabilize it. Am liking these gradient functions for all kinds of fuzzy ‘logic’ more and more
hth
zdo