
Welcome to the new Traders Laboratory! Please bear with us as we finish the migration over the next few days. If you find any issues, want to leave feedback, get in touch with us, or offer suggestions please post to the Support forum here.


smwinc
-
Content Count
188 -
Joined
-
Last visited
-
Days Won
1
Posts posted by smwinc
-
-
I'm struggling a little to describe this in a forum typing

One of those things that is much easier to explain visually. I'll give it a try.
20A
20A
20A
20A
20A (1)
10B (2)
10B (3)
10B
10B
10B
(1) is our last traded price (LTP).
(2) If someone wants to sell, they have to hit at level (2). That would be a TWO down ticks (notice the 'gap', this our spread).
(3) Let's imagine you want to sell 15 - motivated seller at market. You will take the 10 at the bid, and 5 from the next price level. We will down tick 3 times.
20A
20A
20A
20A
20A Prior LTP
<-- original spread.
<-- notice we have a new gap. Spread is temporarily 2 ticks.
5A <-- LTP
10B
10B
10B
Depth would now look like this.
----------------------------
Then, imagine this happens:
20A
20A
20A
20A
30A First Trade
40A <--new motivated sellers have come in, offering to sell larger quantites.
30A <-- more sellers
5A <-- LTP
50A <-- The 10Bid has been pulled, and replaced with 50A (50 offered)
1B <-- Someone else pulled orders, leaving only 1B here.
10B
5B
5B
Sellers are trying to Jam buyers here. We want to cause pain to whoever is caught long. Buyers are pulling their bids, and the price is trying to be forced lower.
Even if we were to BUY in this situation, we have to hit the 50 offered, which is still a downtick from the LTP 1 tick above (where the 5A is).
----------------------------
Next trade:
20A
20A
20A
20A
30A First Trade
40A
30A
5A <-- Prior LTP
47A <-- Someone hits the 50A and buys 3. (new LTP)
1B
5B <-- Someone else pulled another 5 bids.
80B <-- Longs are trying to stack the bids, to make it look strong. Probably Bullshit.
50B <-- again, more spoofing of the bid.
Price is still downticked, even though someone "paid up" to hit the offer.
----------------------------
Next trade:
20A
20A
20A
20A
30A First Trade
40A
30A
5A <-- Prior LTP
47A <-- Someone hits the 50A and buys 3. (new LTP)
4A <-- Someone tries to sell 5 at this price, taking the 1B sending it 4A.
<-- Someone else pulled another 5 bids. We have a spread.
8B <-- "Spoof" depth was pulled. He doesn't want to keep it there incase it's hit, now that he's the front of the bid.
50B <-- happy to keep the spoofing there, because he can hide behind the 8B.
Price is down ticked by hitting a bid (normal situation). However, we took out the price level, and sent it from being 1B to 4A. Now, if someone wants to sell at market, they will downtick TWICE (because we have a spread) to hit the 8B. If someone inserts an offer ("A") in our spread, a market order will hit that, creating a downtick even though they hit the offer.
This pattern can continue indefinitely.
When prices are pulled, no trade occurs. If a bid is pulled, and someone inserts an offer, then someone buying at market will still result in a downtick on the T&S.
If you think about it, this is how gaps occur on your chart. Prices are pulled, and someone hits market to cross the spread.
MANY traders make their money from just mastering this practice, generally locals, because of their speed.
E.g.
Look at the depth below. Weak sellers up above, and strong bids.
2A
2A
2A
2A
80B
50B
10B
-----------
2A
2A
2A
2A
5B <- You insert 5 to buy, "leaning" on the 80 B below you (strength).
80B
50B
10B
Uh oh. But meanwhile, I'm actually waiting for an idiot like you to do this.
2A
2A
2A
2A
5B <- You insert 5 to buy, "leaning" on the 80 B below you (strength).
80B <-- This is MY 78 on top of a "2B"
50B <-- Also MY 45 on top of a "5B"
10B
-----------------
Now you're in trouble. You reason for taking the trade disapeared.
2A
2A
2A
2A
45A <--- Sold 50 at this price, taking your 5B and sending it 45A.
2B <-- Pulled my bids
5B <-- Pulled my bids
10B
More sellers then come in to Jam any guys who are stuck long. Simultaneously Bids are pulled, sending the market down quickly. The goal is to try and create a wide spread, even for a split second. Hopefully Long Stops go off, sending "sell at market" orders into the market, which cross the spread for us, hitting the bids. Generally, those bids will be our "take profit" bids. Then we can reverse long, and try and kill some shorts who sold because we were selling.
Does this answer the question?
-
I too am trying to learn T&S, and to that end am evaluating market profile-type software that lets you see Bid/Ask volume at each price level on a bar chart. My question relates to what I'm seeing in the cumulative volume delta and Bid/Ask/Sales for each candle.I really think it's important to completely understand the raw data in trading. There is not very many variables (Price and Volume, that's about it.) BEFORE you start using more complex tools to analyse the raw data, or present it in another form.
This is an important point, if I could stress it more, I would.
Every single indicator or data tool is performing a calculation for you, and displaying the result. If you are going to make a decision (buy/sell/wait) based on that result, you need to understand the a) the underlying data and b) the calculation being performed.
Indicators are really just like math formula's. You should use them to calculate a result that is too cumbersome to do manually over and over again.
YM trades down all morning on decent volume but at some point around 10:30 AM there is a 60 point rally but I'm seeing only negative volume delta for every single 3m bar and the bid is getting hit at 5 times the ask.How is price going up if the "tape" shows only selling by any objective measure?What else moves price besides hitting the bid or ask?Whoa, whoa whoa.
Negative Volume Delta? Why do you care if volume is decreasing at a slower rate? and why 3 minute bars? What is 'decent' volume - are we comparing volume to an average in a 'look back' period? Do you see my point - there is nothing wrong with these specific things (I don't want to have a discussion about them), but you really need to understand what you are looking at, and most importantly, why you care about them.
Honestly, spend a week without charts, and just watch a price ladder & a time & sales window. I'm guessing you probably just need to be more familiar with the dynamics of how the market actually works - the mechanics of the auction process, etc.
I don't like talking about specifics, but this myth about needing complex tools to earn good money is just complete bullshit. Maybe people assume that successful traders "out there" all use hi-tech tools. All of the people in my office who earn 6 -7 figures a year have the most simple trading setup you could imagine, just using a price ladder & basic charts with no indicators. Just bars/candles and volume. I'm still waiting to meet a trader with a really advanced setup who actually makes a good living.
Time and Sales is showing you the end result of everything you need to know in trading. Buying and Selling. At the end of the day, if you can understand only a moment beforehand that people are likely to buy or sell at a particular point, that is ALL you need to know. It's actually pretty simple, just difficult to do consistently.
Hope it helps.
-
Nice Mong!
Very flexible spreadsheet.
Cheers
-
Few points,
We have two key areas here:
Time & Sales (actual trades)
Depth of Market in a price ladder (implied demand & supply)
I trade predominantly off the depth in a few markets. I work with traders who trade ONLY off the depth in some markets. It is not some mystical science.
However, this trading style is less suited to thicker markets. Broadly, when reading the depth, you are 'pulling apart the market' and attempting to analyse individual traders.
Is there a seller in the market?
Are they finished?
Where are they short from?
Where will weak hands be forced to reverse?
etc
E.g. 200 lot appears on the front of the offer in the DAX. Traders jump in front with 4,6,10 lots to get short, 'leaning' on the size.
The 200 lot is implied supply. If that gets pulled, the guys who just got short will likely cut & reverse, or at least cut their trade.
You see 1000 on the bid appears in ESXT50 and hit Long the DAX, on the view that the ESTX50 will get bid up, sending the DAX up. 200 lot gets pulled (maybe he was just pushing sellers into his bids?who knows, who cares). Weak shorts reverse as the DAX is bid up, etc.
This is just one example. This type of analysis is fine when you are analysing a market which is of lower volume - DAX, FTSE, etc. The lower the volume of a market, the more you really need to understand the intricate price action.
It is MUCH more difficult (and in my opinion, just not ideal) to try and read the depth of something like the ES, Nikkei, FX futures, etc. Big, thick markets dominated by much more complicated trading.
In something thicker, you are reading the flow of the time and sales. I do like to pay attention to Accumulated Depth, as markets do tend to attract to size, but only on a minor note.
-
Really think that is a great post. Respect DB.
-
good, general rule:
ANYTHING IN TRADING THAT TALKS ABOUT SECRETS. THROW IT AWAY.
-
Yep, too often we look for everyone else's solution instead of creating our own.
wow - clearly someone smart, attractive, popular, sophisticated & good with ladies thought of that sentence!
:rofl: -
I think it's best to take a top down approach.
1) get some charting software & a good trading simulator. E.g. Ensign & Bracket Trader plugin. Low costs. Total costs = 49.95/month.
2) Just study and watch the market. Write down the things you don't understand & lose money from, and research them.
I've seen plenty of new traders come into the office, given a 2 week "101 of what markets are", and then just study price action on the sim, before making money.
We buy software/books because we underestimate our own ability to figure it out.
-
It depends on your software.
99% are just showing:
if the last price on the tape is less than the previous last price (n < n-1) then it will be displayed in red.
If the last price on the tape is greater than the previous last price (n > n-1) then it will be displayed in green.
You are seeing red for a downtick, green for an uptick. Generally an uptick is because someone lifted prices to hit an offer (ask), or prices fell because someone downticked prices to hit a bid.
I say generally, because that's not always the case. Especially in markets where there is variable spread (e.g. DAX, most thinner futures/stocks), it can change. Let me try and draw an example.
A = Offer/Ask
B = Bid
*** = Traded Price
1.
A
A
A
A
B*** <--- last traded price at the bid.
B
B
B
2.
A
A
A
A*** <--- last traded price at the ask. Price is "upticked" by TWO ticks.
<--- SPREAD (the gap) also widens as traders pull their offers up.
B <--- Previous last traded price at (1)
B
B
B
3.
A
A
A <--- previous traded price level at (2)
A*** <--- last traded price at the ask. Price is "downticked". Someone inserts an Ask into the Spread, and it's hit.
B (spread has closed).
B
B
B
In part 3, price is downticked as well as traded at the ask / offer.
-------
If you are trying to learn to read tape, I highly recommend reading straight from a good price ladder where you can see the bids and offers as well.
That way, you see the whole picture:
Implied Supply
Supply
Equilibrium
Demand
Implied Demand
Cheers.
-
*waits for super-trader Ebook-selling 1-poster to emerge with the holy grail*
-
I'm still waiting for 1400 to be broken. It's against my rules to buy in front of resistance. Until then, I still view this as rangebound. Sure there are plenty of things that are in place that SUGGEST price COULD break 1400. But it hasn't happened yet. Price is king, and price is yet to break that level.Yes. I realise I'm getting a little off-topic here, but there is a financial writer than I'm a real fan of, John Mauldin. He continues to refer to the U.S as a "Muddle Through Economy". He is usually right on the money, and I think it's a good way of explaining what is going on.
The ES has been "grinding up" since the 22nd January - this entire year to date.
Since this is the Candlestick forum, I better refer to them :-)
To mix it up a little, I thought we could look at the Bund. Different market, but still clear implications for the ES/YM.
I've attached 3 charts of the Bund that I referred to in the Chat yesterday.
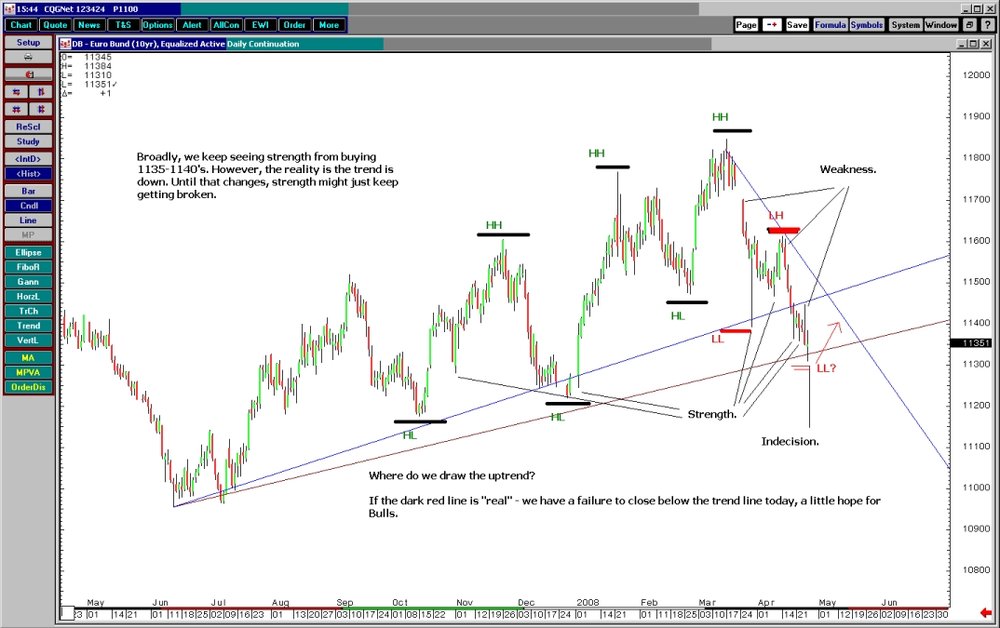
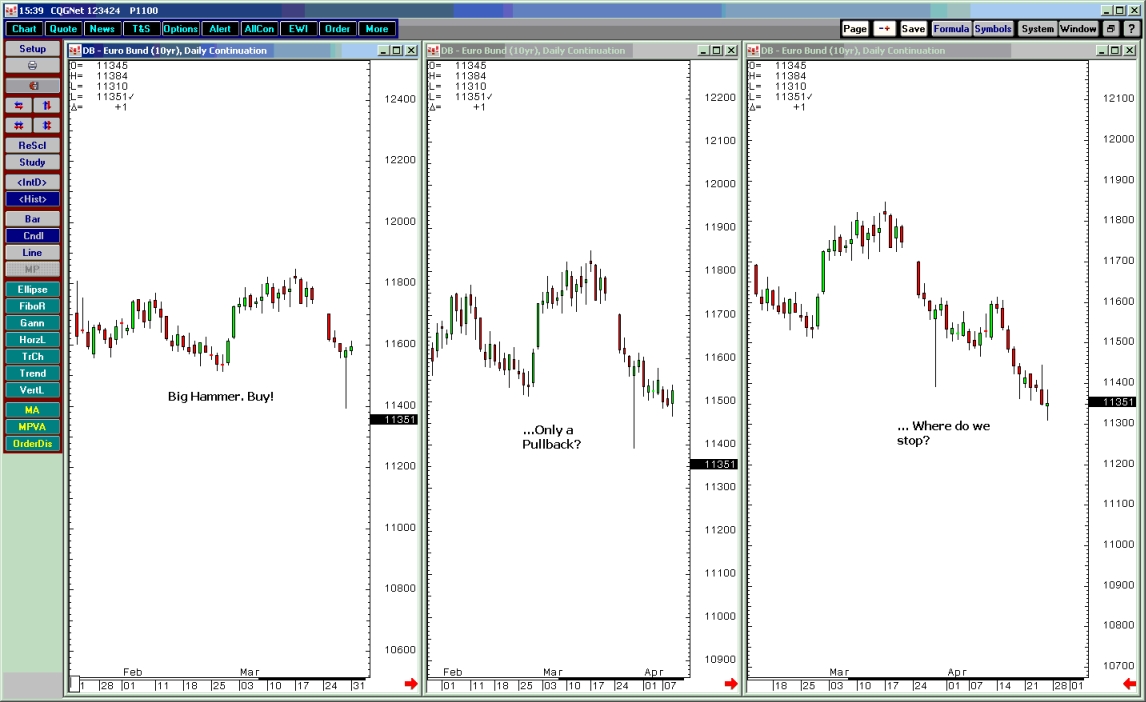
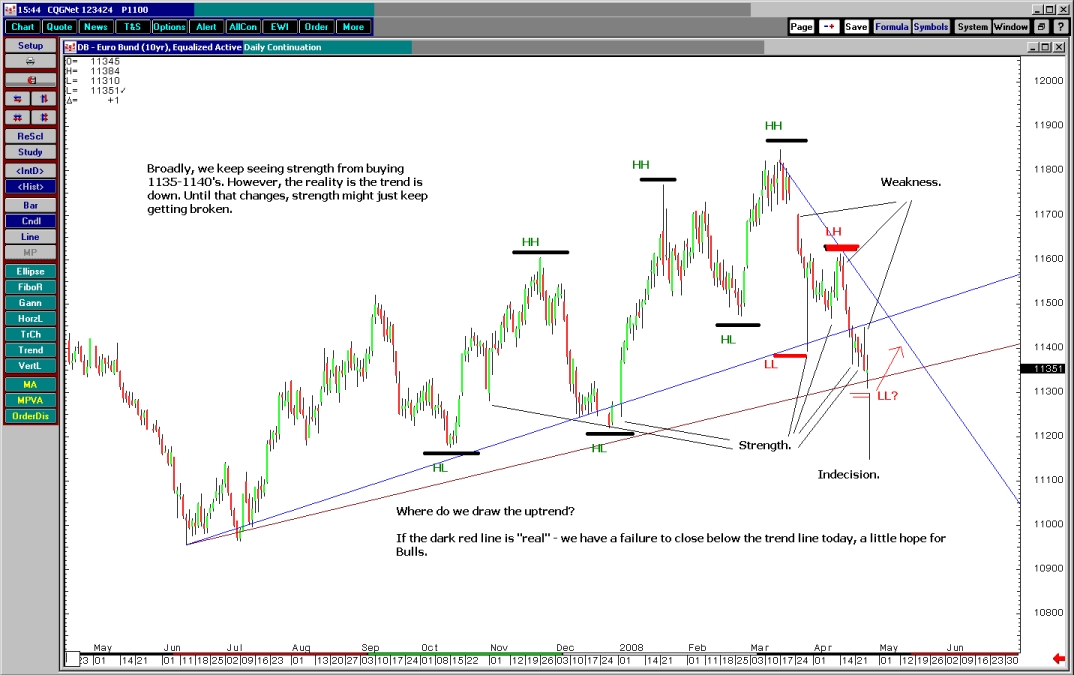
Chart 1 - 3 pictures of the same Daily chart, "scrolling through" the days. You can see that at the time, there was very clear strength, however as we progressed the strength was broken, Hammer after Hammer. Difficult entires.
Chart 2 - basic picture of the Daily Bund chart as it stands. We keep seeing strength, followed by failure. To me, this chart looks like it just wants to rally, but for whatever reason, it's not. You can literally count 3-5 strong bullish hammers that would be a normal "get ready to buy" signal, that failed.
As the Bund is (all else being equal) inverse to equities, the implications is similar for the ES but in opposite. The US market is weak, but it keeps limping higher.
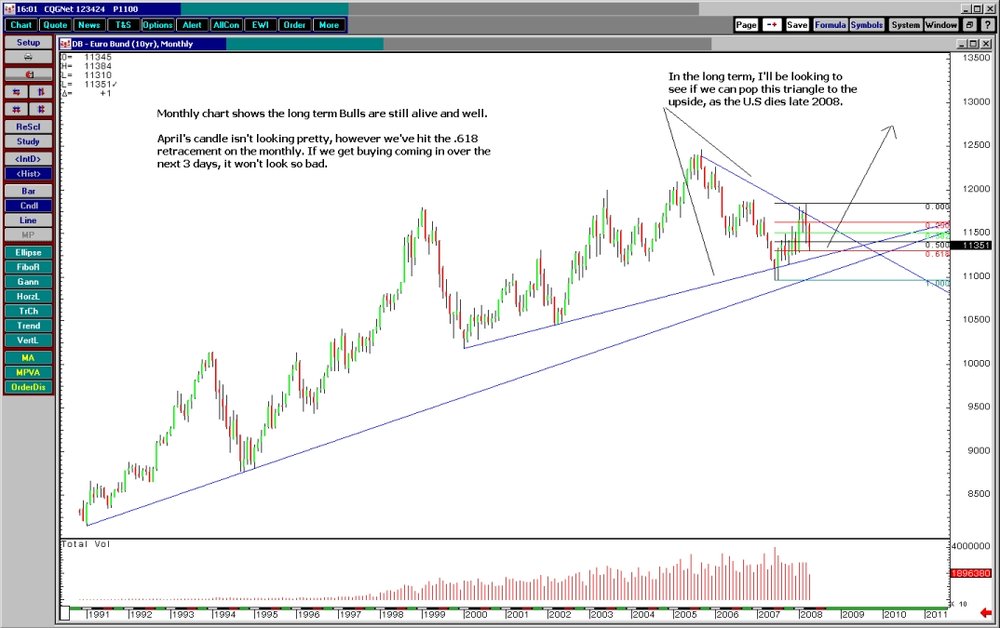
Chart 3 - taking a step back and looking at the monthly Bund chart, you can see this is still a very clear long-term trend UP. If the US is really recovering for the long-term, this chart needs to be bearish. As I mentioned on the chart, I'll be keeping an eye out for any signs of a breaking of a building triangle to the upside.
Cheers

-
I tend to disagree with the bearish tone of the majority of the posts here - we haven't really seen 'strong' volume in any of the US markets or European equities indexes (DAX / ESTX50) yet. Perhaps I'm a little hopeful, but I'd like some good news intraday, or an 'event', which gives some nice capitulation to the upside.
..........................
I'd like to see us head up towards 1415's in the S&P.
We have an area of confluence broadly from 1410 - 1430. That is where I would be comfortable buying puts.
But perhaps I'm too optimistic. I'm sticking to daytrading that's for sure !
Good luck
I posted that on the 9th April. Seems I wasn't the only one thinking of buying puts up here.
We will probably slowly gyrate higher into October eventually. However, don't forget good ol' "Sell in May and Stay away"
-
You are a Planning Trader!
You tend to be decisive and to the point. You'll quickly assume leadership when it is called for by the circumstances around you. You have the ability to quickly develop and implement trading systems to meet your needs. You have the three core qualities that are essential to being a great trader (i.e. you have the ability to see the big picture, new possibilities and connections between things. You make decisions based on logic and analysis and you are decisive, orderly and do things sequentially). You can easily spot logical inefficiencies in the market and take advantage of them, especially if you are pointed in the right direction. You enjoy long-term planning and goal setting and seem to enjoy learning, expanding your knowledge and staying well-informed...
One of your Trading Strengths
Originality and drive; willingness to follow your ideas through to completion.
One of your Trading Challenges
Probably so logical that you don't recognize when emotions are causing you to self-destruct.
-----------
Interesting, thanks for the link.
-
This thread reminds me of an interview with the greatest chess player of all time, Gary Kasparov. The interviewer asked him, “Which is your favourite piece”?
Garry replied: “I don’t have a favourite piece, I believe in all the pieces, from the pawn all the way up to the king”.
Really nice analogy Lote_Tree - very true when you think about it.
-
Here's another link.Enhanced Trader Performance - A Detailed Review
Works perfectly fine here with IE or Firefox.
Enjoy.
-fs.
Thanks,
SMW
-
Here's a link to a review of this book that you may find fascinating.Enjoy.
-fs
Do you have a copy of the video, or another link? Doesn't seem to be working anymore.
I've said this numerous times - Brett is a great guy, and his books are a reflection of that. Make sure you read them.
He is coming out with a new book soon, should be good.
-
Nice short Brownsfan - hopefully was of value to a few people!
Keep up the good work.
I actually bought the close of the ES @ 1335. Expecting a bounce Monday. See how we go.
-
Good points SMW; however.... managing OPM can be VERY lucrative. Much more lucrative than your personal deal at a prop.And that's what managing OPM is about - MONEY. AND MORE OF IT.
Think of it like this - if you can do what you are doing now and just trade much bigger sizes, why not? A 3 pt trade on the ES is 3 pts no matter if that's on 5 or 500 contracts. Only difference is the amount of zero's behind the P&L.
I think you've painted a very bleak picture of OPM and it's simply not the case. If you find competent advisors (key word competent) it's not that bad at all. It depends on how much you personally want to do vs. paying someone else to do it.
And not to mention, there are MANY tax, retirement, etc advantages to running a fund and/or CTA setup for you and the clients.
It's really about whether or not you want to scale your trading up or not. That's it. It's much easier to become personally wealthy trading 500 ES contracts vs. 5.
Of course, you have to be able to make money at it too.I'm not really biased towards one or the other.
I was illustrating it is a lot harder to get hold of OPM, and I don't really think it is worth it until your in a bigger league.
Most of the successful traders who go into managing OPM is because of the reasons I stated. They either 'hit their head' on the limit through prop, or have a trading style not suited to prop. They also want to do different things - run long positions, short term positions, options, etc. When you start getting too big and too complicated, you need a whole firm just to manage "you". You need more than a risk manager split between all the other traders at a prop. firm, you need your own risk manager, your own admin, etc.
The 'limits' you would run into at prop would be greater than 1000 ES. The biggest traders in the office I used to be at in London had limits of 4000 Bund contracts. 4000 not enough for you? Then yes, head over to manage OPM.
I guess it depends on your own local tax laws, but in London the tax situation is basically the same.
-
Thanks a lot Simon - wish I could program. Also thanks to the guys providing the debug feedback.
-
Guys, this is getting a little beyond a joke.
I don't want to create a long post, however I think problems come about from either misunderstanding or forgetting the core concepts types of analysis such as VSA are built on.
Markets have buyers, and sellers. They move in a direction when one exceeds the other.
Getting caught up on the nuances of the 'open' of a bar, etc. does not make any sense. Who cares.
Apologies if I sound a little blunt, but focusing on minor, insignificant details is what software advertising tends to do, trying to make you think it's important. This is designed for retail trades, who on net go broke. Avoid thinking like that.
For any valid type of analysis, often you can 'follow through' the reasoning of it, and get the same conclusions as you with another type of analysis.
An example scenario:
Market is falling.
Trader A suddenly sees huge bids waiting down in a correlated market. He buys the market, anticipating the implied demand from the other market, will send his market up.
Trader B sees that the market is about to hit XYZ moving average (insert: indicator name) and decides to buy.
Trader C sees that this bar was a widespread off the close with significantly above average volume. They buy.
Trader D sees that the market has hit a support level, and created a strong bullish hammer on above average volume. They buy.
Trader E sees a green light on his black box trading system, and buys.
End result = we all bought the market, for various reasons. Demand was there, for "whatever" reason - a candle, VSA, black box system, moving average, whatever, who cares - there was demand. The profitable trader bought it. The losing trader sold it.
All you want to do is be the trader who has 'some' way to identify those situations to profit more often than not.
Worthless types of analysis is generally when it can't be tied back to (real or implied) demand/supply in some way.
-
The next week or so will be interesting.
I tend to disagree with the bearish tone of the majority of the posts here - we haven't really seen 'strong' volume in any of the US markets or European equities indexes (DAX / ESTX50) yet. Perhaps I'm a little hopeful, but I'd like some good news intraday, or an 'event', which gives some nice capitulation to the upside.
While it was negative news, NFP data on 4th April was being bought after the capitulation selling. Today (April 9th) we broke those lows. Whoever bought that negative news is now offside, I'm expecting some level of 'position protecting' tonight/tomorrow.
Verbally if we had to describe the action in the S&P, I'd say:
14th March - tested prior lows, false break.
24th March - broke the mid point, pull back into the lower quartile of the range.
3rd / 4th April - tested prior highs, false break.
We are still (well) within the WRB 01 April. The low of the S&P mini missed the 50% retracement of this minor swing down by a whisker - 2 points.
It's tricky - I'm overall bearish in the longer term, but I believe we need to see capitulation to the upside. We need everyone to get bullish again so we can move lower.
I'd like to see us head up towards 1415's in the S&P.
That would be nice clean break of this range, a 50% retracement from the high in 11 Oct 2007 to the low in 17 March 2008.
1.0 (100%) extension of the swing down 24th March (1361.5) to 31st March (1309.25) = 1413.5
.618 (61.8%) extension of the current* (assuming tonight/tomorrow we don't make a new low) swing down from 07 April (1389) to April 09 (1351.25) = 1412.25
We have an area of confluence broadly from 1410 - 1430. That is where I would be comfortable buying puts.
But perhaps I'm too optimistic. I'm sticking to daytrading that's for sure !
Good luck
-
SPOILER ALERT (highlight text to see):Good chance that in a day or two, we find another brand new poster that will come in and save the day by providing use with a website that will lead you to many riches...
aaaahahahahahahaha :o Was thinking the same thing bro. It must be some sort of new "Auto spam bot".
Step 1:
Sign up newbie account and ask superdumb question
Step 2:
sign up 'pro trader' account who recommends superdumb service to solve supernewbies problem
-
When you are just paper trading, I completely agree that you want to keep costs as close to zero as possible.
In my opinion, this is the best combo:
Charting:
Ensign Windows is 39.95 / month.
Data:
FXCM feed is included free.
Interactive Brokers provides stock/futures/bond data for free. Account minimum required is $2,000 USD (or is it $5,000USD?)
HOWEVER: a "bug" if you like with I.B; once you have deposited the funds and your account is active, you can withdraw your 99% of your funds (leave like $50 in there).
After a few months, they will send you an auto generated email along the lines of:
"please note, your account is below the minimum, please deposit additional funds or your account will be closed..." etc.
What they actually do is seize the funds from inactive low-balance accounts, however because that is such a cruel thing to do, they have to give plenty of warning. Like 2- 4 months.
After you get the warning emails, go into your I.B account and click the button that indicates you are putting in a deposit. This begins the cycle again - After a month your 'pending deposit' expires, you get another warning email, send another 'pending deposit' note, wait a month, etc etc..
I have had an old I.B account with less than $10 in it for over a year now.
-
If I told you, it would be a matter of days before we no longer saw you around here. And while that may bring joy to others, I just couldn't let that happen to you DB. :rofl:PS
If you like the link, hit the THANKS button on the post! I have so little thanks compared to others.
*furiously clicks the thanks button*
Champion!

Question About Time & Sales
in E-mini Futures
Posted
Thanks mate. Sorry, yes I was mistaken.