
Welcome to the new Traders Laboratory! Please bear with us as we finish the migration over the next few days. If you find any issues, want to leave feedback, get in touch with us, or offer suggestions please post to the Support forum here.


analyst75
-
Content Count
658 -
Joined
-
Last visited
-
Days Won
2
Posts posted by analyst75
-
-
Annual Forecast for Ethereum (2021): ETH Is Expected to Reach High of $2,500
Major supply zones: $800, $820, $840
Major demand zones: $360, $340, $320
In 2020, Ethereum traded mostly in a bull market. In January, the biggest altcoin has an opening balance of $129 which rose to a high of $287. In March, the biggest altcoin encounter bearish rejection as the coin plunged to $89.66. The bulls bought the dips as they resumed an upward move in April. The coin has risen to $621 in November but it is facing resistance in December.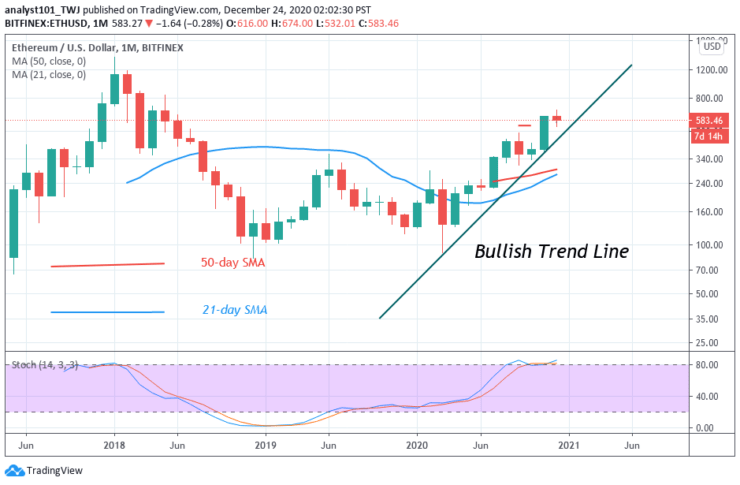 ETH/USD – Monthly Chart
Ethereum (ETH) Price Predictions: Monthly Chart
Since April, Ether’s price has been making a series of higher highs and higher lows. A trend line is drawn showing the support levels of price. The candlesticks are testing the trend line and trending upward. However, if the price breaks and closes below the support line, the current uptrend is presumed to be terminated. The uptrend will continue as long as the trend line remains unbroken.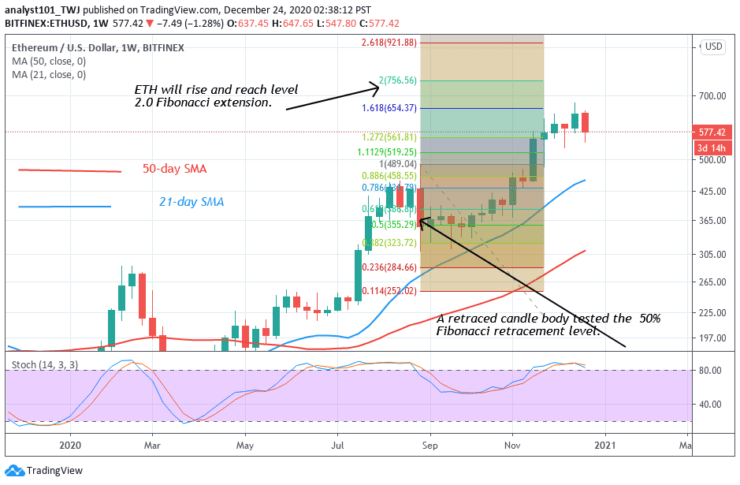 ETH/USD – Weekly Chart
Ethereum (ETH) Price Predictions: Weekly Chart
Ethereum is in an upward move, the chart shows the resistance at $440 which was broken in November. A Fibonacci tool has indicated an upward movement of the coin. On the August 10 uptrend, a retraced candle body tested the 50% Fibonacci retracement level. The retracement indicates that the coin will rise and reach level 2.0 Fibonacci extension. That is the coin will reach a high of $756.56.
Conclusion
Analysts believe that Ethereum will be range-bound between $500 and $700 this year. Where Ethereum is heading to in 2021? By end of 2021, Ethereum is likely to reach a high of $2500. This will depend on the growth of Ethereum in 2020. The growth phase can extend to 2021.Source: https://learn2.trade
-
GOLD PRICE ANALYSIS — DECEMBER 16
Gold (XAU/USD) inched lower in the early European session on Monday and has recorded a fresh daily low of around $1825. The renewed selling pressure got sponsored by the prevailing upbeat market mood as a result of the blooming optimism over the rollout of COVID-19 vaccines by Pfizer (NYSE: PFE).
Investors’ risk mood got further bolstered by the news that the UK and the European Union have agreed to extend the post-Brexit trade talks, as both parties attempt to reach a compromise deal.
The risk-on market mood got highlighted by the leg up in the equity markets and a positive bounce in the US Treasury bond yield, which naturally undermines demand for the non-yielding metal. Furthermore, hopes for additional stimulus measures, and the prevailing bearish pressure surrounding the US dollar (DXY) failed to woo gold bulls or extend any support to the dollar-denominated commodity.
The greenback is currently languishing near a 30-month low amid fears of economic fallout from the imposition of stricter Coronavirus restrictions across several states in the US. Meanwhile, it is becoming more likely that the proposed bipartisan $908 billion COVID-19 stimulus package could be split in half to get approval by Republicans.
Moving on, traders will remain cautious around placing any aggressive bets on gold as markets anticipate the two-day FOMC monetary policy meeting, which commences tomorrow. That said, it is advisable to wait for a sustained drop before placing any trades.
 XAUUSD – Hourly Chart
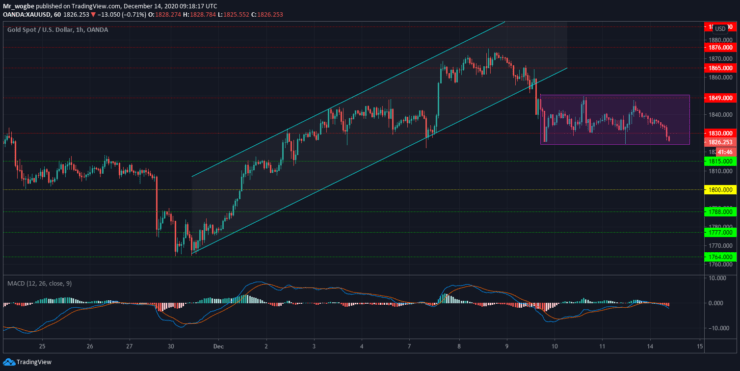
Gold (XAU) Value Forecast — December 16
XAU/USD Major Bias: Sideways
Supply Levels: $1850, $1865, and $1876
Demand Levels: $1823, $1815, and $1800
Gold is currently trading within a consolidation range between $1850 and $1825. A sustained break above or below this range would determine what bias the XAU/USD will likely trade on in the coming days.
However, it is very likely to see a break towards the downside, given the fundamental factors surrounding gold. That said, a sustained break below the $1800 psychological level remains unlikely at the moment.
Source: https://learn2.trade
-
SILVER PRICE: BULLS RETURN PAST $24.00 LEVEL ON XAGUSD AMID DOLLAR WEAKNESS
XAGUSD Price Analysis – December 15
Silver (XAGUSD) price registers technical buying early in the European session while bulls return past the $24.00 level. The white metal is up ahead in trend amid continued dollar weakness on Tuesday as a result of an improved risk appetite.
Key Levels
Resistance Levels: $27.50, $26.00, $24.50
Support Levels: $23.50, $22.83, $21.89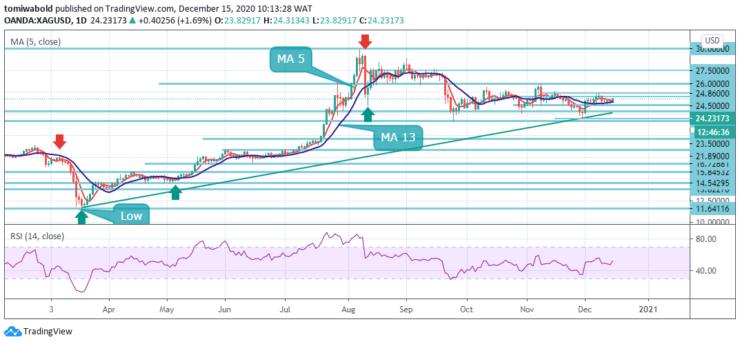 XAGUSD Long term Trend: Ranging
Silver (XAGUSD) moving average 13 which currently sits as support at $23.82 level has been like a solid base to the price action over the past few days, with the moving average 5 at $24.10 acting as solid resistance.
The price of XAG continues to trade well within know levels to the upside, there is decent resistance in the $24.50 region, while to the downside, the bottom of the recent range comes into play just around the $23.50 level. At present, XAGUSD is up and the bulls may attack further north is of the $24.50 level.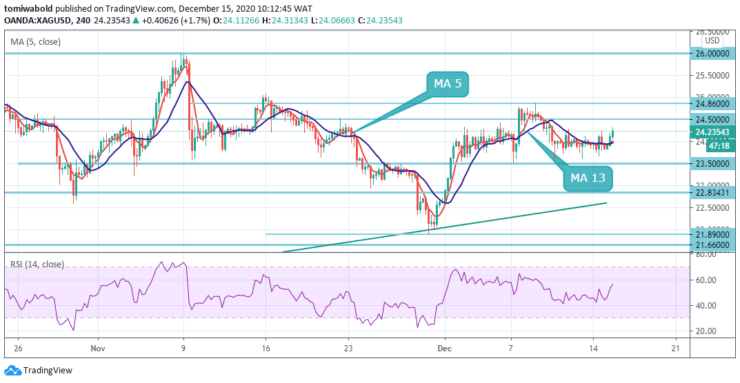 XAGUSD Short term Trend: Ranging
A bout of technical buying on the rebound of a short-term downtrend around the ascending trendline support at the $21.89 level from Nov 30 has continued to sustain spot silver prices in the short term frame to reclaim past the $24.00 level. Nevertheless looking at the white metal over a medium time horizon, silver still trades well within recent ranges.
Silver (XAG) is now attempting an upside breakout today and a breach of $24.50 minor resistance may usher in price to the $25.00 threshold. There is no follow-through buying yet. But sustained trading beyond the $24.00 mark should confirm that a rebound from $21.89 has been completed at the $24.86 level before another advance.Source: https://learn2.trade
-
ARE THERE THE BEST AND THE WORST MONTHS TO TRADE?
The first time I set my eyes on a Meta Trader platform, I doubted I would be able to master its use, since the figures and features I saw seemed daunting to me.
When I even heard about candlesticks, I didn’t know what it meant. Stupefied, I wondered whether I’d need to light some candles before I would be able to trade. Did this have to do with the environment?
That was the year 2007.
I got used to the markets and the Meta Trader, and I fell in love with them. Yes, I may be considered a pro now; but I was once a noob.
I’ve had much experience and I’ve seen the good, the bad, and the ugly in the markets. I stay in the markets days in days out, learning many things.
One important thing I learned is that there are some months of the year in which trading is easier and there are some months in which trading can be difficult. Just as the ‘sell in May and go away’ idea, yes some observations confirm repetitive patterns in the markets, and the patterns are valid. Best and worst months?
I’ve observed that, in the months of January, February, March, and April, the markets tend to move seriously and predictably. Reversals are huge and sustained, as they form new trends. Trend continuations are more pronounced. This is also true of the months of October, November, and December. Trend-following strategies usually work well around this period.
In the months of May, June, July, August, and September, false breakouts are never a curiosity and sustained trending movements are rather rare. During these months, the markets are difficult to predict, and most traders to get suboptimal results. Mean-reversion strategies tend to work around this period.
Although there are exceptions, as this doesn’t mean there can’t be large movements anytime between May and September each year. Large movements do exist, and they often come as surprises. You can see them in historical data.
Generally, I find trading easier from October to April; I find trading difficult from May to September. What about you?
At times, this also has to do with the kind of trading system one is using.Source: https://learn2.trade
-
EURUSD UPSIDE RUN HALTS UNDER THE BARRIER AT 1.2150 LEVEL SUGGESTING DEEPER PULLBACKS
EURUSD Price Analysis – December 9
The major European currency adds to prior session corrective downside and takes EURUSD to fresh lows in the sub-1.2100 area. EURUSD appears to be fading after its upside run halts under barrier 1.2150 level. The pair is off its highs could extend its downward correction.
Key Levels
Resistance Levels: 1.2350, 1.2200, 1.2150
Support Levels: 1.2040, 1.1920, 1.1800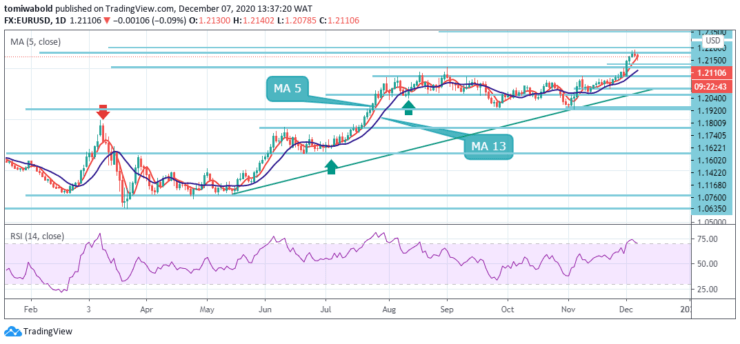 EURUSD Long term Trend: Bullish
The upside traction in EURUSD eased in the proximity of the 1.2200 resistance level in prior sessions. At the moment, the pair is losing 0.12% at the 1.2110 level and confronts the next support at 1.2040 level seconded by 1.2011 level and finally 1.1920 level.
On the other hand, a breakout of 1.2150 level would target 1.2177 level (high Dec 4) en route to 1.2200 resistance level. The alternative scenario sees the loss of the 1.20 zone as an initial bearish signal, which would be boosted on a breach beneath last week’s low at the 1.1922 level.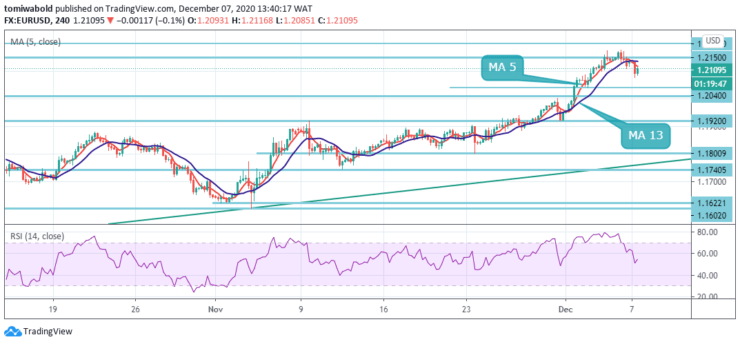 EURUSD Short term Trend: Ranging
The intraday bias in EURUSD stays neutral for some range trading beneath the 1.2177 temporary high level. Meanwhile, the downside of the retreat should be contained by the 1.2011 support level to bring another increase.
On the upside, breach of 1.2177 level may aim for 61.8% forecast of 1.0635 to 1.2011 levels from 1.1602 at 1.2200 level next. The pair is currently signaling a short-term downside correction towards 1.2040 levels. Any more losses could lead the pair towards the 1.2011 support zone.Source: https://learn2.trade
-
NASDAQ 100 PRICE ANALYSIS — DECEMBER 1
The Nasdaq 100 (NDX) has rounded off November on a positive note, after the month up by more than 11%. This surge was mainly stimulated by the recently-concluded US Presidential election and the discovery of potential COVID-19 vaccines.
These themes were the major dominating fundamental factors through November, as hopes for things to go back to normal (pre-covid) ignited some sectoral rotation. The rotation occurred mainly between work-from-home stocks and traditional businesses, which helped indexes like the Dow Jones (DJIA) and Russell 2000 take the lead from the Nasdaq 100.
Nonetheless, the NDX remains in a favorable position as markets enter the close of 2020. That said, stimulus hopes and potential political stalemate in Washington over most of President-elect Biden’s policies could cause the Federal Reserve to maintain its dovish outlook, which would be very beneficial for NDX bulls.
That said, it is likely that there are tailwinds present in the equity market ahead of December and 2021. However, there’s the possibility that the NDX could fall into consolidation before we see a continuation to the upside, as the US Presidential election-induced volatility has now been weaned out of the market.
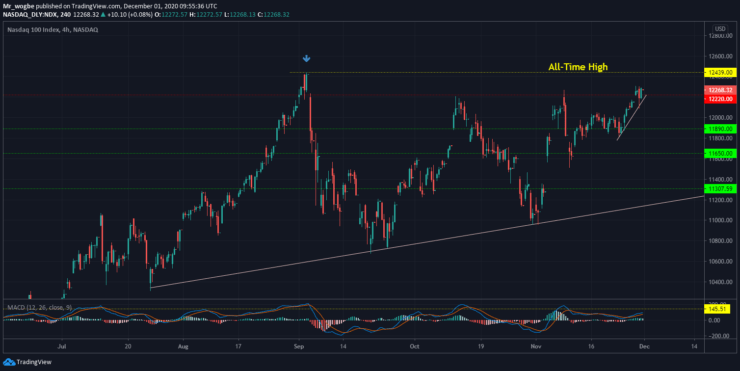
Nasdaq 100 (NDX) Value Forecast — December 1
NDX Major Bias: Bullish
Supply Levels: 12300, 12370, and 12439.
Demand Levels: 12220, 12000, and 11890.
The NDX is on an aggressive bullish rally as it inches closer to its all-time high at 12439. At the moment, the 12220 support will likely prevent any sustained decline given the confluence of indicators (ascending trendline and 12220 crucial support) at that level.
We expect the NDX to break its previous all-time high and record new peaks in the coming days before consolidation likely sets in.
Source: https://learn2.trade
-
GERMANY 30 (DE30EUR) IS IN A DOWNWARD MOVE, MAY FALL TO LEVEL 13153.70
Key Resistance Zones: 13600, 14000, 14400
Key Support Zones: 11200, 10800, 10400
Germany 30 (DE30EUR) Long-term Trend: Bullish
The index is an upward move but it is facing resistance at level 13200. It must have reached bullish exhaustion as it faces rejection. On November 10, a retraced candle body tested the 88.6% Fibonacci retracement. This indicates that the index will rise to level 1.1129 and perhaps reversed.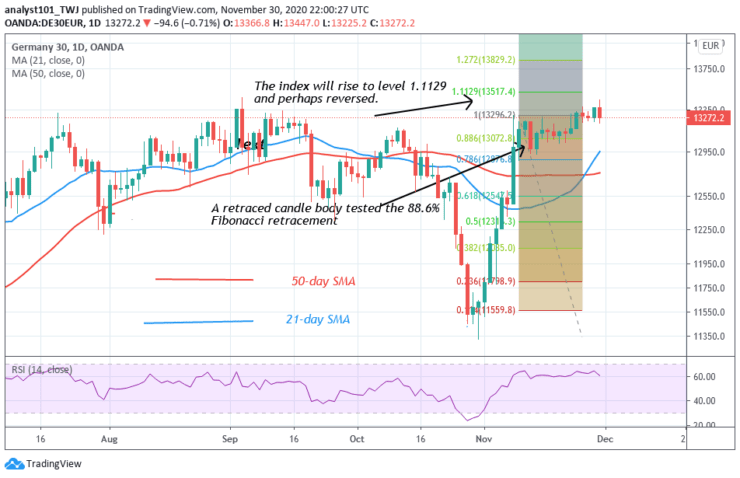 DE30EUR – Daily Chart
Daily Chart Indicators Reading:
Presently, the SMAs are sloping upward indicating the uptrend. The index is at level 64 of the Relative Strength Index period 14. This indicates that it is in the uptrend zone and above the centerline 50.
Germany 30 (DE30EUR) Medium-term Trend: Bullish
On the 4- hour chart, the index is in a downward move. On November 30 downtrend, a retraced candle body tested the 61.8% Fibonacci retracement level. This implies that the index will fall and reach level 1.618 Fibonacci extension.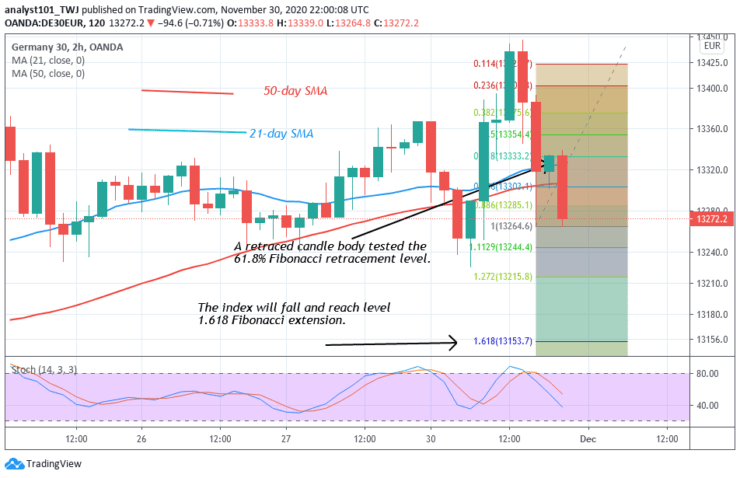 DE30EUR – 2 Hour Chart
4-hour Chart Indicators Reading
The market is below the 80% range of the daily stochastic. It indicates that the index is in a bearish momentum. Meanwhile, the 50-day SMA and the 21-day SMA are sloping upward indicating the uptrend.
General Outlook for Germany 30 (DE30EUR)
DE30EUR is likely to take a downward movement. The index has been trading in the overbought region. Sellers may emerge to push prices down. However, in a trending market, the overbought condition may not hold. That is the pair will continue to rise.Source: https://learn2.trade
-
Those who take quick and payday loans and refuse to pay them back are now hooked.
Normally, it is not a good thing to go into debt unless that is your last resort. We know that people are fond of borrowing and they seriously hate paying it back. Even when it comes to paying back what was borrowed, your creditor will become your enemy. Such is the nature of human beings.
Debtors don’t want to return money even when they eventually have means of repayment. If anyone borrows money and returns it, it means the person has a Godly spirit in him.
If people ponder the power of compound interest, they would stay away from loans. If you pay 1.33% or 1.79% interest per month on a loan, you will need to pay back roughly 16% or 20% per annum. And this will begin to compound as long as you don’t pay.
Most borrowers who are now in trouble have realized that the interest rates are eventually higher than the capitals borrowed. They realize that the creditors are using an indirect way to enslave borrowers (go and work for me, bring back the capital plus profits).
The banks themselves know that business environment is very tough and are now indirectly asking people to work with or spend the banks’ funds and bring the funds plus profits back to them. Many borrowers really have poor mentality and they don’t know the gravity of what they’re putting themselves into.
If a bank could lend out 1 billion USD per annum, it would reap a return of 150 million USD (at least on paper). Do you think they will forget about you if you owe them even a small amount?
Loans without collateral are now popular. But your collateral is your BVN – unless you don’t want to operate accounts again in the country.
I have heard people saying” Don’t pay to my Access Bank account again, but pay into my UBA bank account.” “Don’t send that cash into my GTBank account again, but send it to Zenith Bank.” It’s like postponing the evil day.
Ti iya o ba i tii je eniyan, iya nri nkan panu lowo ni (Yoruba adage). I literally means: If Suffering has not come to attack you, it means Suffering is currently busy with something. If you think you can avoid payment by abandoning the account you used to borrow money, you’re only postponing the evil day.
They cannot come for you when your debt is small, but the debt will begin to compound and compound till it would make sense for them to come for you.
BAD NEWS FOR DEBTORS
CBN has given banks permission to deduct from funds a debtor has in another bank account. For example, if you borrow quick loans from FCMB and you abandon your FCMB account and you are now operating another account with First Bank, FCMB can make a request to First Bank, and the money you owed will be deducted once or gradually from your account at First Bank, without your permission.
Would you now keep money at home, so that bad boys will come to you to take their dues?
Borrowing isn’t a good thing, no matter how plausible it looks.
Profits from games of knowledge: https://www.predictmag.com/
-
LITECOIN (LTC) SUSTAINS RECENT RALLIES, FACES RESISTANCE AT $90 HIGH
Key Highlights
Litecoin rallies to the high of $90
The crypto may be range-bound between $80 and $90
Litecoin (LTC) Current Statistics
The current price: $89.20
Market Capitalization: $5,900,735,267
Trading Volume: $7,953,660,011
Major supply zones: $70, $80, $90
Major demand zones: $50, $30, $10
Litecoin (LTC) Price Analysis November 24, 2020
Litecoin has continued its rallies as the coin reached a high of $89.86. LTC price has been making a series of higher highs and higher lows. The upward move has been facing resistance at $90. On the upside, if buyers can push LTC above $90, the coin will rally above $100 high. However, if buyers fail to resume the upside momentum, LTC will be compelled to a sideways move for a few days. If the uptrend is resisted the coin will be range bound between $80 and $90.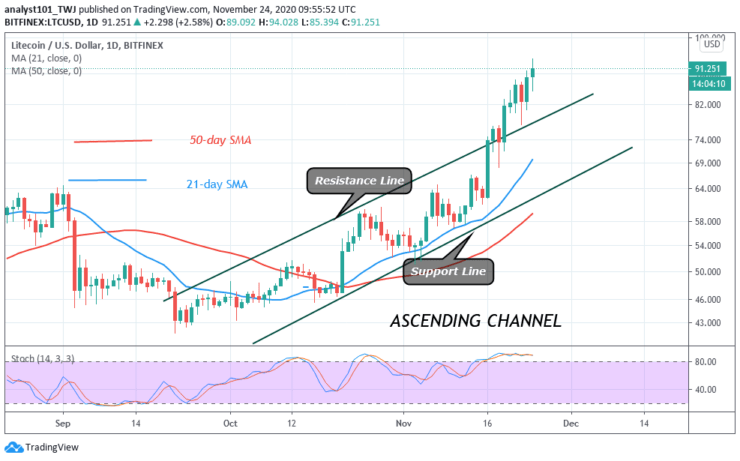 LTC/USD – Daily Chart
Litecoin (LTC) Technical Indicators Reading
LTC price broke the resistance line of the ascending channel. This indicates a further upward movement of the coin. The crypto is at level 74 of the Relative Strength Index period 14. It indicates that the coin is in the overbought region of the market.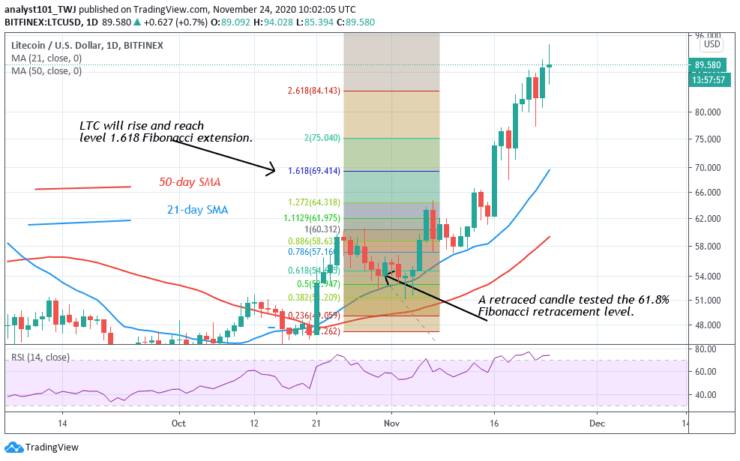 LTC/USD – 4 Hour Chart
Conclusion
Litecoin has made an impressive bullish run on the upside. Nevertheless, the retraced candle body on October 31 tested the 61.8% Fibonacci retracement level. It indicates that the coin will rise to a level of 1.618 Fibonacci extension level. This extension is equivalent to $70 high. Meanwhile, the price action is above the projected price level.Source: https://learn2.trade
-
XRP/USD PULLS BACK AT RESISTANCE LEVEL OF $0.72
XRP/USD MARKET NOVEMBER 26
After the price retracement, it may resume its bullish trend and the resistance level of $0.79 and $0.88 may be reached. Below the current price, the level is found the support levels at $0.55, $0.44, and $0.39. However, the relative strength index period 14 is at 70 levels bending down to indicate a sell signal which may be a pullback.
KEY LEVELS:
Resistance levels: $0.72, $0.79, $0.88
Support levels: $0.61, $0.55, $0.49
XRP/USD Long-term Trend: Bullish
XRPUSD is bullish in the long-term outlook; the crypto soars towards the north by the strong bullish momentum. The bulls’ momentum breaks up the resistance levels of $0.28, $0.33, and $0.36. The price has tested the resistance level of $0.79 on October 24. The price pulls back to retest the broken level of $0.61. Today, the XRP market is dominated by the bears and the daily candle is bearish. The price may increase further after the pullback.
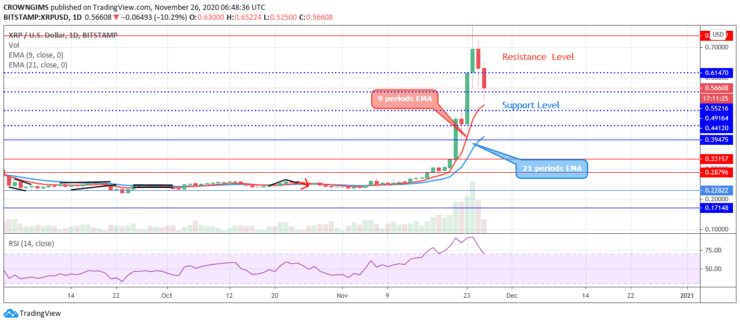 XRPUSD Daily chart, November 26
The two EMAs are located below the coin and it is trading far above 9 periods EMA and 21 periods EMA which indicate a strong bullish momentum. After the price retracement, it may resume its bullish trend and the resistance level of $0.79 and $0.88 may be reached. Below the current price, the support levels is found at $0.55, $0.44, and $0.39. However, the relative strength index period 14 is at 70 levels bending down to indicate a sell signal which may be a pullback.
XRP/USD medium-term Trend: Bullish
The bulls dominate the XRPUSD market. Immediately after the breakout from the consolidation zone, the bulls push the price high above the September high. It is currently pulling back at the resistance level of $0.72. The price is testing the support level of $0.55 at the time of writing this report. In case the just mentioned level does not hold, there will be a further price reduction.
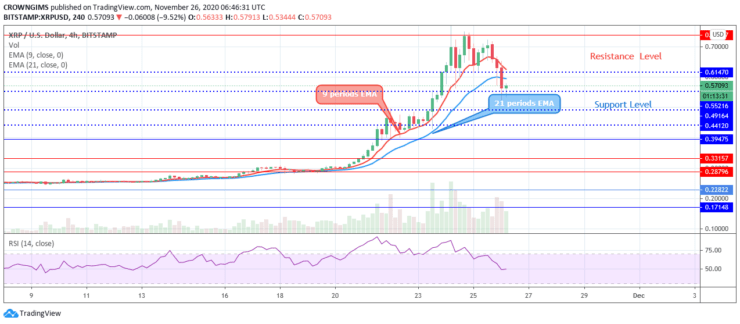 XRPUSD 4-Hour chart, November 26
The price has penetrated the two EMAs downside and it is trading below 9 periods EMA and 21 periods EMA. The fast-moving EMA is trying to cross the slow-moving EMA downside. The relative strength index period 14 is pointing down at 50 levels which connotes a sell signal and it may be a pullback.
Source: https://learn2.trade
-
USD/JPY IS REACHING BEARISH EXHAUSTION, MAY REVERSE AT LEVEL 103.23
Key Resistance Levels: 111.000, 112.000, 113.000
Key Support Levels: 104.000, 103.000, 102.000
USD/JPY Price Long-term Trend: Bearish
The USD/JPY pair has been in a downward move since November 12 after a rebound above level 103.30. The pair is approaching the previous support at level 103.30. The selling pressure will resume if the current is broken. The Yen will resume an upward move if the support holds.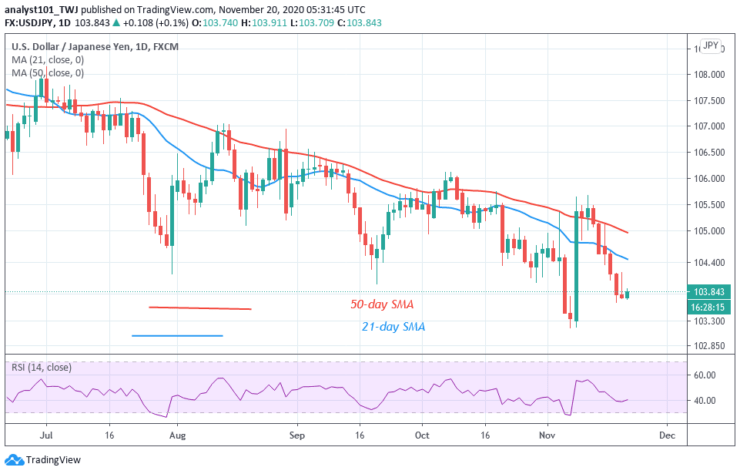 USD/JPY – Daily Chart
Daily Chart Indicators Reading:
The 21-day SMA and the 50-day SMA are sloping downward indicating the downtrend. The pair has fallen to level 40 of the Relative Strength Index period 14. The pair is in the downtrend zone and capable of falling.
USD/JPY Medium-term Trend: Bearish
On the 4-hour chart, the pair has been in a downward move after rejection at 105.00. On November 18 downtrend; a retraced candle body tested the 78.6% Fibonacci retracement level. This indicates that the market will fall to level 1.272 Fibonacci extensions. That is the Yen will reach the low of level 103.23 and reverse.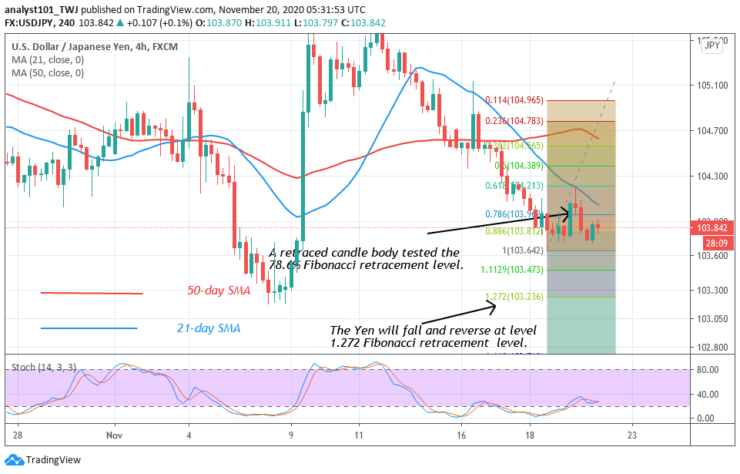 USD/JPY – 4 Hour Chart
4-hour Chart Indicators Reading
The USD/JPY pair is currently above the 25% range of the daily stochastic. It indicates that the pair is in a bullish momentum. The SMAs are sloping downward indicating the downtrend.
General Outlook for USD/JPY
USD/JPY has been on a downward move but the selling pressure is reaching bearish exhaustion. According to the Fibonacci tool analysis, the Yen will fall and reverse at level 103.23.Source: https://learn2.trade
-
EURJPY BEARISH MOMENTUM REMAINS TOWARD 123.00 LEVEL
EURJPY Price Analysis – November 20
The EURJPY pair is attempting to close beneath the 123.37 price zone as speculative interest stays trapped between coronavirus outbreaks and vaccine hopes. The pairs selling momentum remains toward the 123.00 level.
Key Levels
Resistance Levels: 127.07, 125.00, 123.37
Support Levels: 122.37, 121.61, 119.31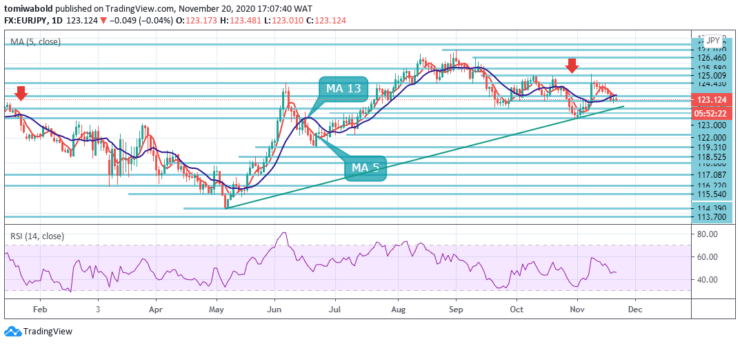 EURJPY Long term Trend: Ranging
As seen in the daily time frame, the downside pressure is expected to accelerate if EURJPY breaks below the 123.00 support, exposing the ascending trendline support and the 122.37 low. Meanwhile, the moving average 5 and 13 stays mixed for a range in the coming sessions.
If the 123.00 support holds, a surge towards the 123.40 level could be expected during the following trading session. However, a barrier around the MA 13 could serve as a limitation for bullish traders within this session. Lower here a firm breach of 119.31 level will argue that the rise from 114.42 level has completed and turned the focus back lower.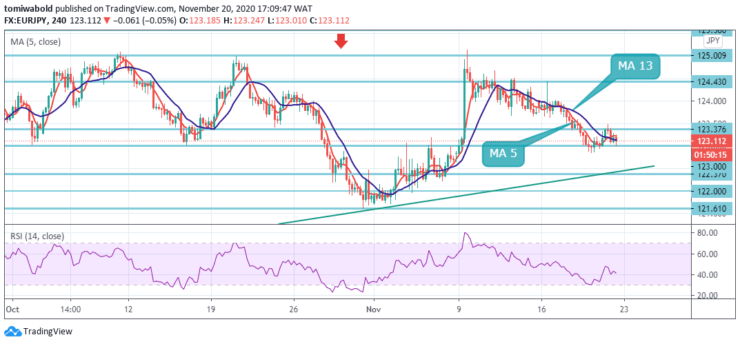 EURJPY Short term Trend: Ranging
The intraday bias in EURJPY is staying in consolidation with the current recovery. A much more decline is mildly in consideration with 123.37 minor resistance level intact. Beneath the 122.37 level will target a test on the 121.61 low level initially.
The resolute breach there may restart the trend from 127.07 level with another decline to 119.31 key support level. On the upside, though, a breach of 123.37 minor resistance level may shift sentiment back to the upside for the 125.00 level instead.Source: https://learn2.trade
-
ANALYST BELIEVES BITCOIN IS WORKING ACCORDING TO PLAN AHEAD OF SIX-DIGIT PROJECTION
The creator of the popular stock-to-flow model, PlanB, has affirmed that Bitcoin (BTC) is going according to plan like “clockwork, “ following its third halving event. PlanB, an anonymous developer, has lauded the S2FX model and believes that BTC will be trading between $100,000 and $288,000 by the end of 2021.
The stock-to-flow model and other existing variations are some of the most used BTC prediction tools within the cryptocurrency community.
The first version of S2FX, known as the original stock-to-flow ratio, outlined the stock of existing reserves and the flow (the annual supply of BTC in the market). The ensuing version provided more complex and comprehensive Bitcoin information. Apart from stock and flow, it also showed the different phases BTC has passed through since its creation in 2009. These phases include proof-of-concept, the payment phase, e-gold, and financial assets.
The Bitcoin halving, which occurs automatically every four years, is arguably the most crucial part of the models because it cuts BTC supply in half, which decreases the flow. That said, PlanB and S2FX supporters monitor Bitcoin’s price performance assiduously after every halving.
The analyst asserted that the benchmark cryptocurrency is moving like clockwork since its third halving in May. already, Bitcoin is showing some similarities with the price dynamics in 2012.
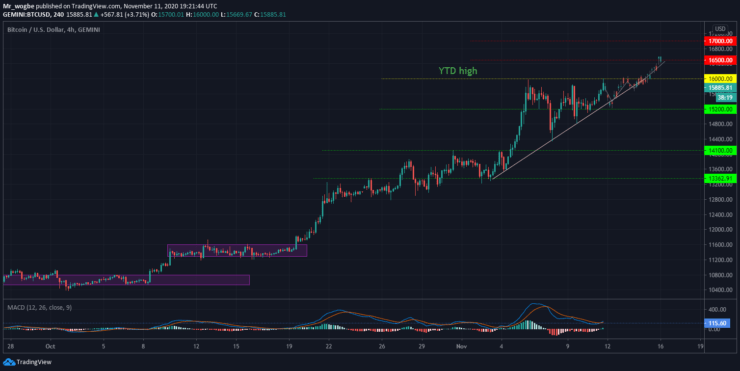 BTCUSD – 4-Hour Chart
Key BTC Levels to Watch in the Near-Term — November 11
Bitcoin remains on a strong bullish trajectory, despite many projections that bullish steam might be running out. The cryptocurrency has renewed its 2020 high, after hitting $16,000 just a few hours ago. This is a good sign that the bullish momentum is still intact. That said, we could see BTC hit the $16,500 – $17,000 area soon.
However, we could see a mild pullback towards the mid-$15,000 in the coming hours.
Total market capital: $453 billion
Bitcoin market capital: $291 billion
Bitcoin dominance: 64%
Source: https://learn2.trade
-
ETHEREUM (ETH) PRICE ANALYSIS: ETHER HOVERS ABOVE $450 SUPPORT FOR A POSSIBLE UPTREND CONTINUATION
Key Highlights
Ether fluctuates above $450 support
The coin has a target price of $488 high
Ethereum (ETH) Current Statistics
The current price: $458.89
Market Capitalization: $52,029,363,330
Trading Volume: $14,108,917,588
Major supply zones: $280, $320, $360
Major demand zones: $160, $140, $100
Ethereum (ETH) Price Analysis November 11, 2020
On November 10, the altcoin rebounded but could not break the $470 resistance. The upward move was repelled as price retraced to the $455 low. The upside momentum will always resume as long as price finds support above $450 support.
Presently, the coin is trading at $462 at the time of writing. On the upside, a strong bounce above $460 will propel price to break the $470 resistance. Ether will rally above $488 once the $470 resistance is breached. The upside momentum will be invalidated if the bears break the $450 and the $430 support level.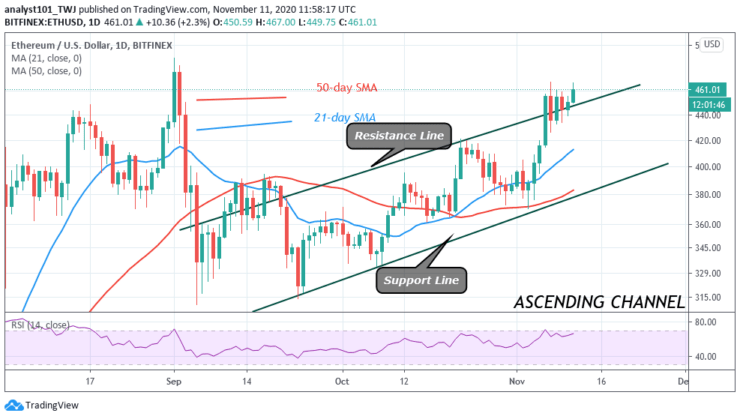 ETH/USD – Daily Chart
ETH Technical Indicators Reading
Ethereum is trading above the resistance line of the ascending channel. The biggest altcoin will continue to trend higher as long as price is sustained above the resistance line. The coin will resume a downward move if the price breaks below the resistance line.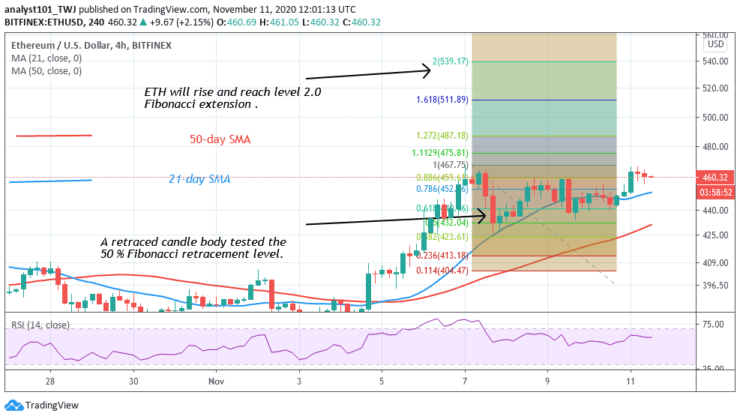 ETH/USD – 4 Hour Chart
Conclusion
Ethereum bulls are close to breaking the resistance at $470. Once the resistance is broken the Fibonacci tool analysis will hold. When the coin was resisted on November 7 uptrend, the retraced candle body tested the 50% Fibonacci retracement level. This explains that the coin is likely to move up to level 2.0 Fibonacci extension which is $539.17 high.Source: https://learn2.trade
-
LITECOIN (LTC) IS LIKELY TO SINK BELOW $51 AS BULLS AND BEARS TUSSLE FOR PRICE POSSESSION
Key Highlights
Litecoin plunges to $51 low and corrected upward
LTC risks further downward move as price reaches overbought region
Litecoin (LTC) Current Statistics
The current price: $52.49
Market Capitalization: $3,453,939,467
Trading Volume: $2,849,880,504
Major supply zones: $70, $80, $90
Major demand zones: $50, $30, $10
Litecoin (LTC) Price Analysis November 3, 2020
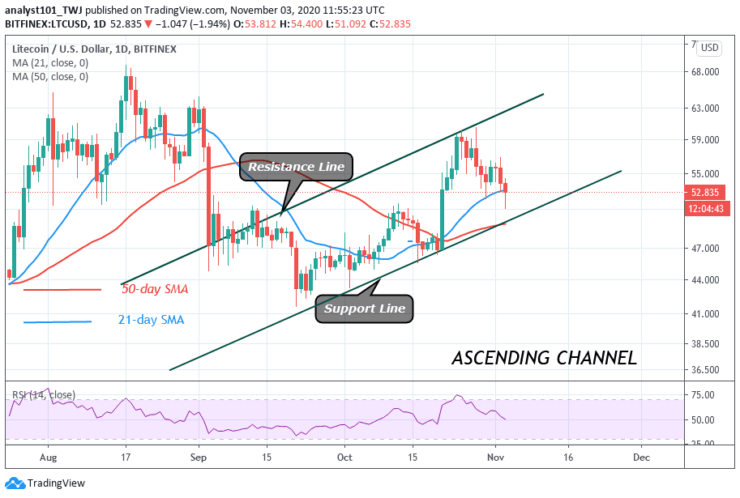
Litecoin has been on a downward move. Today, the bearish impulse reached a low of $51 and corrected upward. Presently, it is facing another rejection at the $53 high. There is a likelihood of a further downward move.On the downside, if price retraces and breaks below the $51 support, the market will drop to $46 or $47 support. The coin will resume an uptrend if the price finds support above $51. The $51 support is where the coin resumes upside momentum.
 LTC/USD – Daily Chart
Litecoin (LTC) Technical Indicators Reading
The coin is below the 60% range of the daily stochastic. It indicates that it is in the bearish momentum. The selling pressure of the coin will persist once the price breaks below the SMAs. The coin is at level 50 of the Relative Strength Index period 14. It indicates that there is a balance between supply and demand.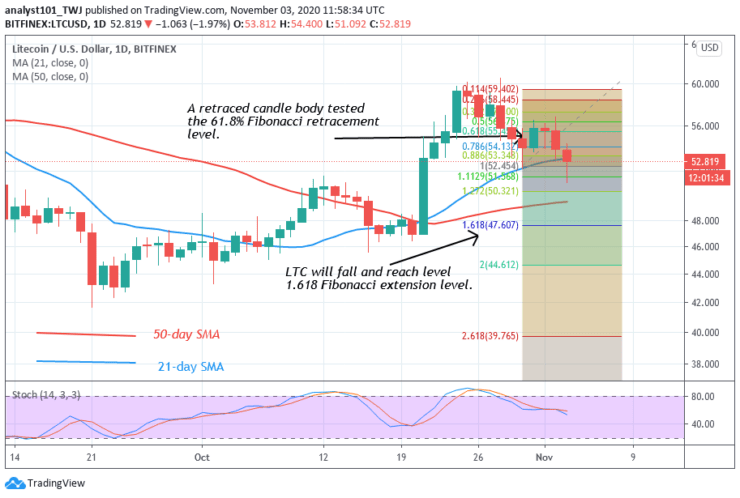 LTC/USD – Daily Chart
Conclusion
Litecoin is likely to further decline as price retests the $56 high. On October 30 downtrend; a retraced candle body tested the 61.8% Fibonacci Retracement level. This indicates that the market will further depreciate to level 1.618 Fibonacci extensions or $47 low.Source: https://learn2.trade
-
WILL THE 2020 UNITED STATES PRESIDENTIAL ELECTION UPHEAVE THE MARKETS?
The 2020 United States presidential election is here and traders are expecting high volatility in the markets.
My Take
Nothing unusual and nothing extraordinary will happen in the markets. The markets don’t surprise people when they’re looking out for such; surprises come only when people don’t expect them. An informational traffic sign post indicating a financial market business concept – a clipping path is included to separate sign from bkg. Canon 5D MarkII and composition in Photoshop.
Let’s use an example of an eye that has seen the ocean and the sea. When that same eye observes a pool of water in the bathroom, it would be as though it has seen nothing; when compared to the ocean and the sea. The effects of the election on the markets might turn out to be a pool in the bathroom.
I forecast that the elections might bring a measure of volatility, but the volatility would pale into insignificance when compared to what happened as recent as March 2020. Those March events caught the world by surprise.
There are many examples like that. So elections are being held in the US, and you’re expecting something extraordinary? Sorry, the market has a knack for going against the expectations of the public. Because you expect storms in the markets; the storms won’t be as extraordinary as you currently imagine.We may see a continuation in the current market directions or spikes in opposite directions, followed by trend continuations. It may even be complete and sustained changes in trends. But whatever happens, it is not going to be anything new or unusual.
 American flag waving with the Capitol Hill in the background
What I Will Do
That is why I hold some positions. If things go against me, I can’t lose more than say, 1.5% per trade (perhaps huge slippage and spreads factored in). In case things move in my favor, then I would be grateful for whatever the markets give me. After all, my rewards are always higher than the risk.
What can you do if you disagree with this post?
The answer is simple. Stay out of the markets. But you will realize later that there is no big deal after all.Source: https://learn2.trade
-
EUR/CHF IS IN AN UPTREND, MAY REACH LEVEL 1.0730
Key Resistance Levels: 1.0800, 1.0900, 1.1000
Key Support Levels: 1.0600, 1.0500, 1.0400
EUR/CHF Price Long-term Trend: Ranging
EUR/CHF has been on a downward move since September 25. On October 15 downtrend; a retraced candle body tested 78.6 % Fibonacci retracement level. This indicates that the pair will fall and reach a low of 1.272 and later reverse.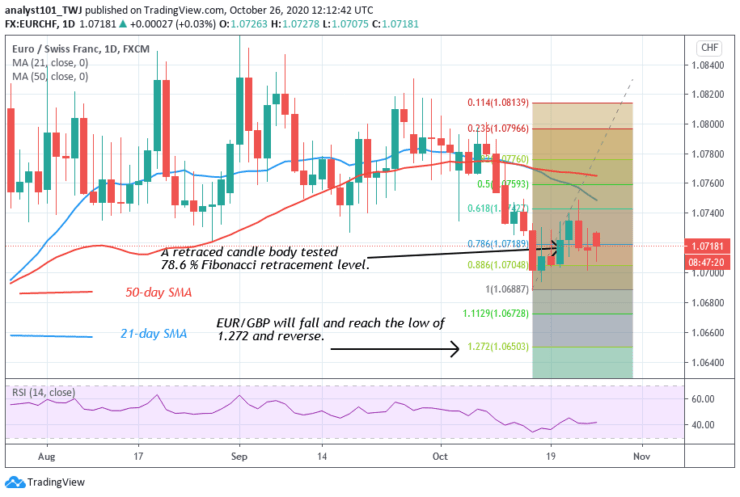 EUR/CHF – Daily Chart
Daily Chart Indicators Reading:
The pair is at level 41 of the Relative Strength Index period 14. It implies that the market is in a downtrend and below the centerline 50. The 50-day SMA and 21-day SMA are sloping horizontally. It indicates the sideways trend.
EUR/CHF Medium-term Trend: Bullish
On the 4-hour chart, the pair is also rising. On October 20, a retraced candle body tested 50 Fibonacci retracement level. This also indicates that the pair will rise and reach level 2.0 Fibonacci extension. That is the low level of 1.0730.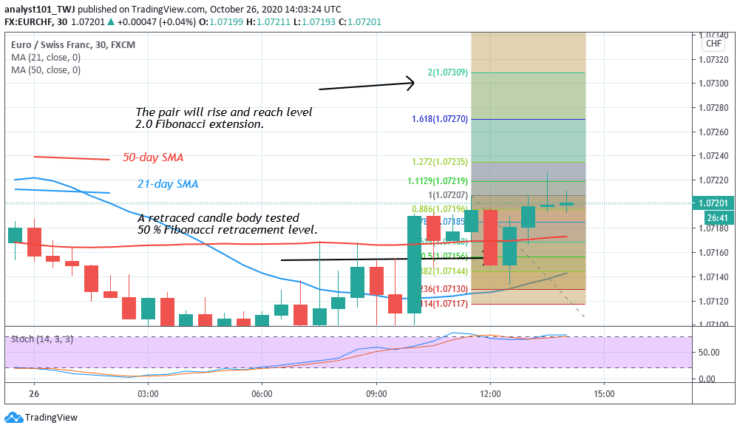 EUR/CHF – 30 Min Chart
4 Hour Chart Indicator Reading
The 50-day and 21-day SMAs are sloping sideways indicating the previous trend. The pair is below the 30% range of the daily stochastic. It indicates that the market is in a bearish momentum.
General Outlook for EUR/CHF
EUR/CHF is rising after breaking the initial resistance. The price rebounded at level 1.0714 to resume the upward move. According to the Fibonacci tool, the market will reach level of 1.0730.Source: https://learn2.trade
-
EURUSD RISKS DEEPER DECLINE AT 1.1800 LEVEL ON SURGE IN EUROPE COVID-19 CASES
EURUSD Price Analysis – October 26
Growing fears of a surge in Europe Covid-19 cases may slowdown economic recovery as new infections trigger stricter measures and prompt investors into safety. EURUSD risks a deeper decline at the 1.1800 level as buyers repeatedly failed to make a sustained break above the daily cloud top around the 1.1850 level.
Key Levels
Resistance Levels: 1.2150, 1.2011, 1.1917
Support Levels: 1.1807, 1.1612, 1.1422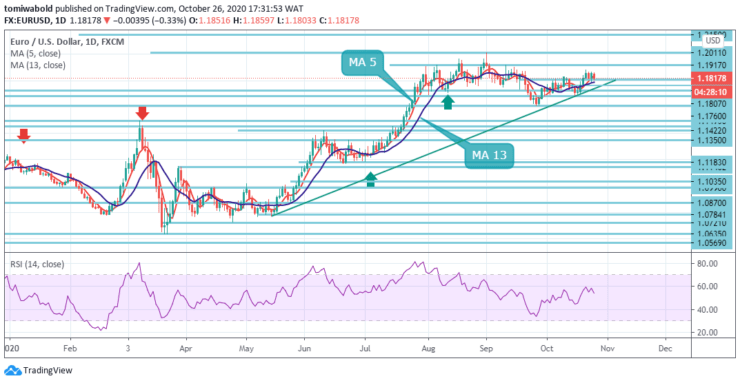 EURUSD Long-term Trend: Ranging
EURUSD is under pressure, trading near the 1.1810 level, and is in danger of further falling. The EURUSD rally appears to have hit a decent barrier at recent highs around 1.1880. A break of this area is expected to push the pair higher towards the 1.1917 area as the bullish trend is expected to resume at the key level.
In a broader context, the rise from 1.0635 is seen as the third phase of the pattern from 1.0339 (low). A further rally towards the cluster resistance at 1.2011 can be seen. This will remain a preferable case as long as the resistance at 1.1422 is held and turned into support.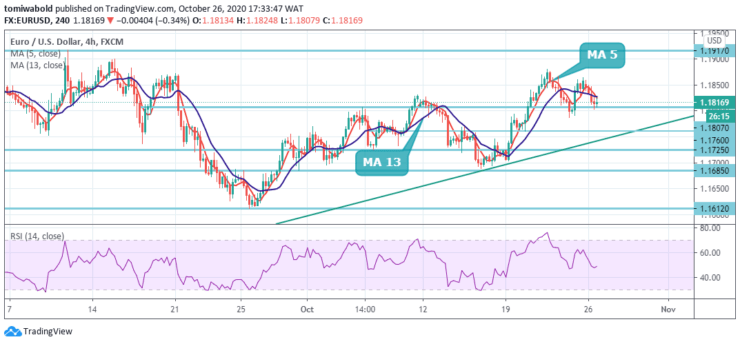 EURUSD Short-term Trend: Ranging
EURUSD intraday trend stays neutral as consolidation from 1.1880 regions continues. Nevertheless, further growth stays in favor while maintaining the support level of 1.1685. The break into 1.1880 regions will be a test at the 1.2011 high. The 4 hours chart shows that the pair is developing below the moderately bearish 5 and 13 moving averages.
A move below 1.1800 is needed to mark an immediate (minor) high for a pullback to the bottom of the short-term channel seen at 1.1725. On the other hand, a breakout of 1.1685 is likely to extend the corrective pattern from 1.2011 by one more phase. Intraday bias will return to the downside towards 1.1612 and below.Source: https://learn2.trade
-
BITCOIN PRICE ANALYSIS: COULD CBDCS BE THE END OF BITCOIN?
Ever since Facebook publicized its plans to develop a digital currency called Libra, central banks across the globe have tried to counter it with their cryptocurrency. While Facebook’s Libra has come under heavy scrutiny and regulatory obstacles, more than 80% of the world’s central banks are working assiduously to develop a central bank digital currency (CBDC).
Meanwhile, the foundational basis of a CBDC is fundamentally disparate to what Bitcoin (BTC) is about. That said, the cryptocurrency community has begun speculating what the effect of a government-issued digital currency would have on the benchmark cryptocurrency.
Below are some of the possible outcomes of CBDCs on Bitcoin:
Plot A
The common expectation is that CBDCs will be bad for Bitcoin and the crypto industry at large, considering that world governments will place their weight behind CBDCs giving it a higher adoption rate compared to BTC.
Plot B
The next popular opinion is that CBDCs could give Bitcoin better widespread use and adoption, as it could spark heightened interest in digital currencies.
Plot C
Assuming that Plot A comes into fruition, there would be no use for Bitcoin as a peer-to-peer payment system. However, this doesn’t mean BTC becomes useless, instead, it becomes an excellent store of value.
 BTCUSD -4-Hour Chart
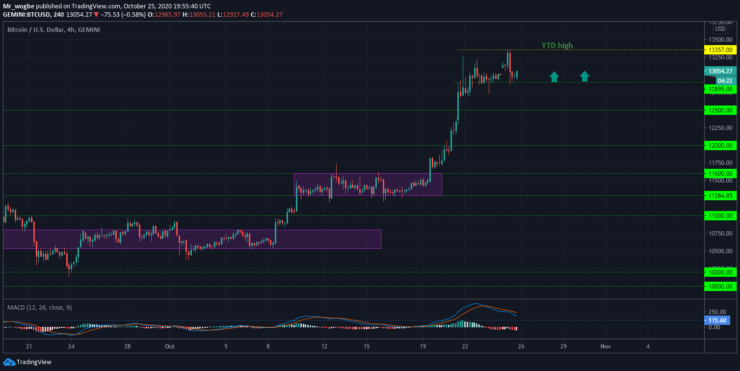
Key BTC Levels to Watch in the Near-Term
Bitcoin, against popular belief, doesn’t seem to be slowing down any time soon. The cryptocurrency just recorded a new YTD high at $13,357 in the past 24 hours. BTC has been trading within a consolidation range between $13,300 and $12,895 for the past four days, as traders expect a fresh bull wave.
That said, as long as Bitcoin maintains its stance above the $12,895 support, we could see a fresh bull wave in the coming days. A sustained fall below the aforementioned support could trigger an extended retracement for the cryptocurrency.
Total market capital: $395.4 billion
Bitcoin market capital: $241 billion
Bitcoin dominance: 61%
Source: https://learn2.trade
-
ETHEREUM (ETH) PRICE ANALYSIS: ETH FACES REJECTION AT $420, FLUCTUATES BETWEEN LEVELS $400 AND $420
Key Highlights
Ethereum battles resistance at level $420 high
The coin is likely to reach another high of $434
Ethereum (ETH) Current Statistics
The current price: $415.57
Market Capitalization: $47,020,287,242
Trading Volume: $12,506,980,622
Major supply zones: $280, $320, $360
Major demand zones: $160, $140, $100
Ethereum (ETH) Price Analysis October 25, 2020
Following the breaking of the $395 overhead resistance, Ethereum resumed upside momentum. However, the coin rallied to a high of $420 and was resisted. Since October 22, the upward move has been resisted as the coin resumed a sideways trend below the resistance. On the upside, if the price breaks the current resistance, the coin will resume the uptrend. However, Ether will face another resistance at $440. The coin will rally to $480 if the current resistance is broken.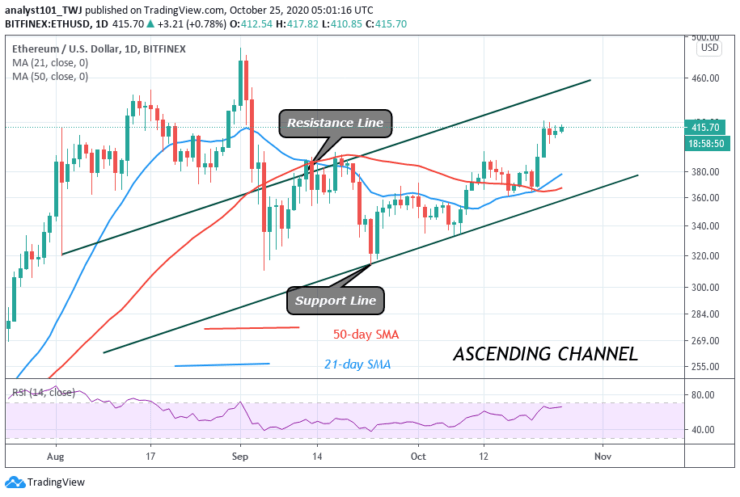 ETH/USD – Daily Chart
ETH Technical Indicators Reading
The 21-day and 50-day SMAs are sloping upward indicating the uptrend. Ether has risen to level 65 of the Relative Strength Index period 14. It indicates that the market is in the bullish trend zone. The coin is approaching the resistance line of the ascending channel. A break above it will push the coin upward.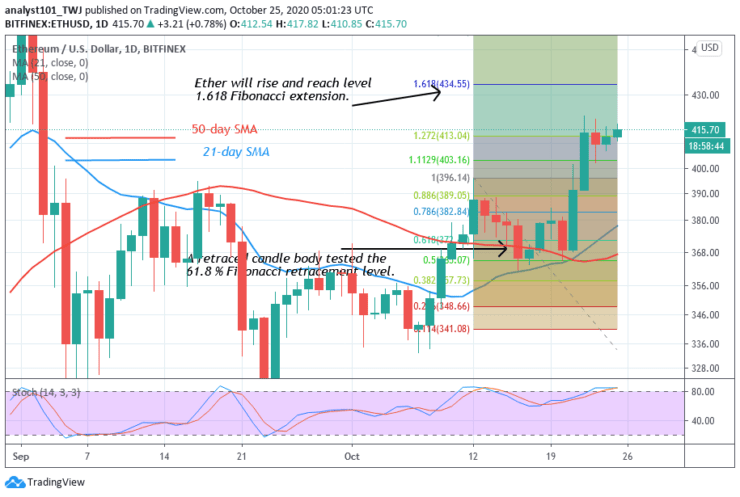 ETH/USD – Daily Chart
Conclusion
Ethereum will rise after breaking the resistance at $420. The Fibonacci tool analysis has indicated an upward move to level 1.618 Fibonacci extensions. The market will reach another high of $434.55.Source: https://learn2.trade
-
EURJPY UPSIDE TRACTION OVERPOWERS BEARS, EYES 124.00 LEVEL
EURJPY Price Analysis – October 16
EURJPY is accelerating from a low of around 123.00 as upside potential prevails over sellers for another session on Friday. The cross has so far managed to hold above the 123.00 level. Given the uncertainty, it would be a mistake to set an end date for the response to the pandemic, European Central Bank (ECB) governing board member said on Friday.
Key Levels
Resistance Levels: 127.07, 126.46, 125.00
Support Levels: 123.00, 122.37, 119.31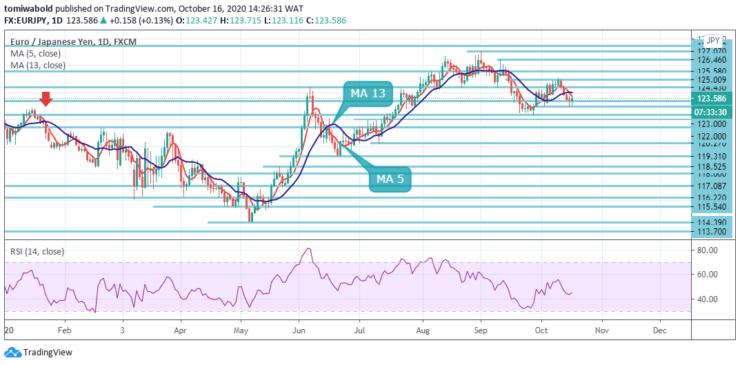 EURJPY Long term Trend: Ranging
As noted on the daily chart, if selling momentum picks up additional pace, then the pair is expected to continue to the next relevant area around 123.00, where it sits low in October. Further south, there is critical horizontal support just above the 122.37 level.
While the RSI recovery from the near oversold area suggests a further recovery in the pair, a clear break of the 124.00 marks becomes necessary for the EURJPY bulls ahead of the 124.43 level and the weekly high near the 125.00 level.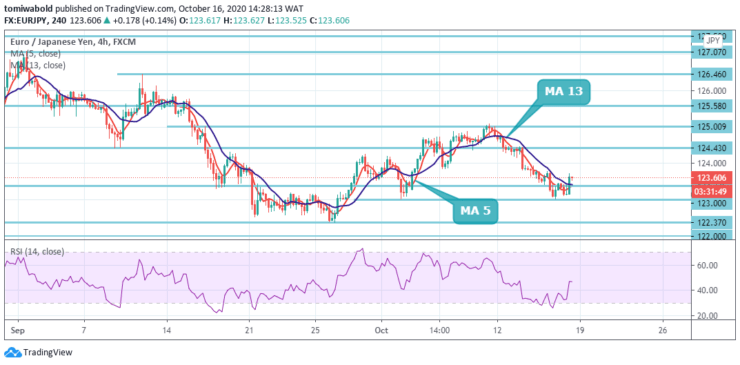 EURJPY Short term Trend: Bearish
EURJPY intraday bias remains bearish, with 38.2% retracement from 114.39 to 127.07 at 122.37. A solid break there would confirm a resumption of the entire corrective fall from 127.07 and aim a 61.8% correction at 119.25, close to the pivotal support at 119.31.
On the other hand, however, a break of the 125.00 level will bring the upward trend back to retest the 127.07 level. Conversely, a clear dip below the 123.00 level could plummet towards the 120.00 psychological magnets.Source: https://learn2.trade
-
Veterans of the markets generally agree that trading is largely psychological. That is one of the reasons why a trader with suboptimal strategy will trade profitably and another trader with a good strategy will be making losses. The method one trader uses to trader their way to financial freedom is what another trader uses and experiences pecuniary ruin.
Why are some people, who have access to excellent trading tools and strategies still struggle with the markets? It boils down to the mindset of the trader. To throw more light on this issue, you can read below a section from an article by Dr. Van K. Tharp, titled “Mental Strategies Versus Trading Systems.”
“One of the best traders in the world told me once that he traded a simple trend-following system. He taught other traders how to trade that way and in the process, he claimed that often they developed systems that were more profitable than his! Yet he feels comfortable following his system so he sticks with it. What about the traders he has trained? Most never completed his training but a few found some success — yet none of his students has ever achieved the many years of consistent profits that he has. Why not? Great trading systems do not produce success; great traders produce success!
Years ago, I visited the office of another well-known trader to profile him and his colleagues. What struck me was that several of the people in his office were not very successful — even though they were trading the same exact methods that he had used to make hundreds of millions of dollars. Why? In part, his mental strategy was quite different from those of his colleagues. How you trade relates more to your mental strategies than to your trading system. Would you disagree? Then how do you explain the lack of success of some of the people in his office trading the same great system as that top trader…
Another well-known trader actually wants to teach people to be as successful as he has been. Thousands of traders have gone through his training yet he claims that only about 10% of his trainees will actually be successful using his methods. And the record seems to support his claim — people go through the training, but few come close to his level of success. Again, we have examples of people who know the rules of a winning system yet aren’t that successful.
The reason that these top traders make money while others who use the same systems do not is — systems don’t make money, traders do.
Then Do You Need a Trading System?
Since the trader, not the system, is responsible for success, do you need a trading system? Top traders use systems so yes, you still need to use a trading system. What then is the purpose of a trading system? My research indicates that trading systems are an essential shortcut for human decision making.
You have probably discovered that most human decision-making strategies are complex and slow. For example, think about the last time you bought a car and had to decide on the make, model, color, dealer, price, etc. You probably took several days at minimum to decide. Traders cannot afford that kind of time to make a decision. They need a shortcut or system in order to make quick decisions. Ideally, your trading system should signal an action and you should go through a quick “see/recognize/feel/act” strategy and take the trade. That is, you see the signal, recognize that it is familiar, and because it matches what you are looking for, you feel good about it and act on it. This is the simple mental strategy for action mentioned in the tasks of trading — but most traders cannot do that! They were successful in some domain (engineering, business, medicine, etc.) using a particular decision strategy and they want to continue to use that strategy in the market. As a result, when they see a signal to trade, they use their well learned decision-making strategy to decide if signal is valid and whether or not to act on the signal. Their “normal” strategy that worked well for them for so long does not work well at all in the markets. They end up feeling some emotions when they trade and they lose money….
….I believe that any trader or investor can win in the markets if he or she uses his or her mind properly. Nothing in my experience to date has given me any reasonable counter examples. Some people just operate at a level that requires a much greater degree of change in their mental strategies than other people.
Mental strategies are not the kind of things most traders are interested in normally. They’d much rather learn a new indicator or system. Understanding that mental strategies are a huge edge, however, directs your attention away from external factors and leads you to explore your internal processes. Understanding and leveraging those processes can help you turn any good system into trading success….
Source: Vantharp.com
Note: What are the solution? You need to work on your trading mindset and mental strategies. We will explore how to do this in the coming articles.Source: https://learn2.trade
-
THE TECHNICAL ANALYST HAS BECOME AN ENDANGERED SPECIES
According to Investopedia.com, technical analysis is a trading discipline employed to evaluate investments and identify trading opportunities by analysing statistical trends gathered from trading activity, such as price movement and volume. Unlike fundamental analysts, who attempt to evaluate a security’s intrinsic value, technical analysts focus on patterns of price movements, trading signals and various other analytical charting tools to evaluate a security’s strength or weakness.
Given the definition above, you can see the important of technical analysis as far as trading is concerned. However, many people do not understand what it is, not to mention how to apply it in their trading. Most readers and visitors to shares, cryptocurrencies, forex, commodities, etc, news websites, do not understand technical analysis, and so they prefer to ignore it and read the articles they understand instead (such as those about fundamental market news and briefs).
Even in the nascent cryptocurrency industry, demand for the technical analyst is drying up, especially amid crypto winters, as well as protracted bear markets.
No wonder the technical analyst has become an endangered species, because most members of the public do not understand our work and therefore are not interested in our analyses. This is one of the reasons why the technical analyst’s career is threatened.
When the general public know more about technical indicators, they will be inclined to read technical analysis of the markets, whenever they come across such online. They will appreciate what the technical analyst does and the effort behind those technical productions. They will be able to understand what the technical analyst has in mind and how their thoughts can be applied to financial instruments.
More importantly, people will be able to apply technical analysis to their own speculation and investment, with satisfactory results. The truth is, when applied correctly and objectively, technical analysis works.
This book is also for those who want to consider a career as a technical analyst. It is very easy to use and understand; very easy to familiarize oneself with. It contains step-by-step explanations and it will launch you into the fascinating world of technical analysis.
The content of this book were originally published in TRADERS’ (https://www.traders-media.de/), and have been reproduced by their kind permission.
Teach Yourself Technical Analysis: https://www.advfnbooks.com/books/techanalysis/index.html
Teach Yourself Technical Analysis. UK Kindle: https://www.amazon.co.uk/dp/B08GPGS5GJ
Teach Yourself Technical Analysis. US Kindle: https://www.amazon.com/dp/B08GPGS5GJ
Teach Yourself Technical Analysis. UK paperback: https://www.amazon.co.uk/dp/1912741067
Teach Yourself Technical Analysis. US paperback: https://www.amazon.com/dp/1912741067
Teach Yourself Technical Analysis, Kobo: https://www.kobo.com/gb/en/ebook/teach-yourself-technical-analysis
Teach Yourself Technical Analysis, Apple: https://books.apple.com/us/book/teach-yourself-technical-analysis/id1534690445?ls=1
-
SILVER PRICE: BULLS TO RE-ATTEMPT THE PRIOR WEEK’S HIGH AT $24.40 LEVEL FOR NEW ENTRIES
XAGUSD Price Analysis – October 5
Silver (XAGUSD) price prints a $24.04 intraday high level with 0.50% gains during Monday’s session. Buyers may re-attempt the prior week’s high at $24.40 level for new entries. Traders also resumed accumulating Silver on price correction as safe-haven demand reemerged amidst the second wave of coronavirus outbreak in Europe, and political uncertainty in the US.
Key Levels
Resistance Levels: $28.90, $26.50, $24.50
Support Levels: $23.50, $21.38, $19.65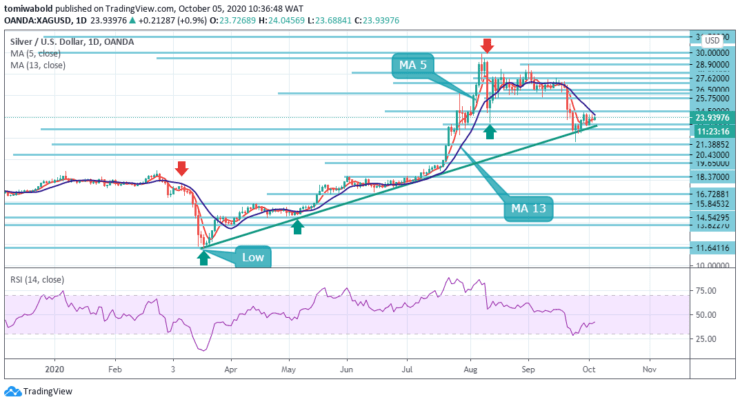 XAGUSD Long term Trend: Ranging
Silver (XAGUSD) has staged a dramatic decline to $21.66 low level and rebounded to trade at $24.40 level prior week high but still failed to close above the daily moving average 13. The failure to close beyond the MA 13 could increase that level’s importance as resistance going forward.
Although the overall daily market trend is currently in a near-term downtrend, this might just be a correction, as both the medium and long-term trends are still bullish. Buying could accelerate should prices move above the close-by swing high at 24.50 level where further buy stops might get triggered.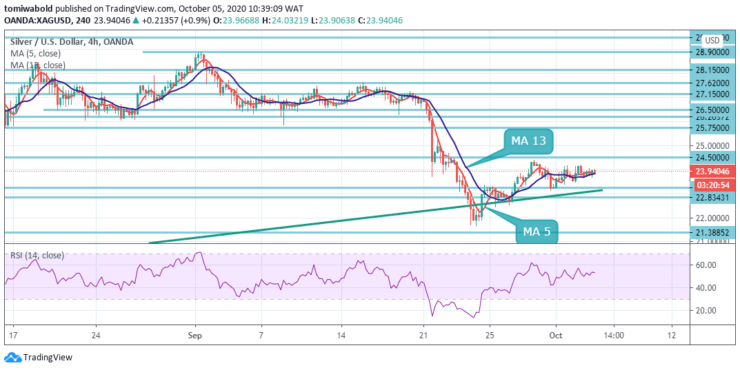 XAGUSD Short term Trend: Ranging
The momentum indicators are painting an optimistic short-term picture as well. The RSI has extended its rally into the positive area, while the moving average 5 and 13 are forcefully stretching towards the continuation of the rebound.
Should the $23.50 level give way, the bears may need to remove the $22.83 support level to pick up steam towards the $21.38 key area. In brief, silver may remain under consolidation control in the short-term if it fails to break past the $24.50 level, with the sell-off expected to gain fresh momentum beneath the $23.50-21.83 region.Source: https://learn2.trade
Insights from Learn2.trade
in Market News & Analysis
Posted · Edited by analyst75
Annual Forecast for Bitcoin (2021): Price Prediction Averages at $50K
After a multi-year bear run, Bitcoin (BTC) has finally shut the naysayers by clearing its previous all-time high at $20k and has recorded a fresh record high at $24,300 by December 2020. From the third halving event in May to dramatically dovish global economic monetary policies to combat the COVID-19-induced economic crisis, there have been several fundamental factors that supported the bull run.
We will be looking at some of the factors responsible for 2020’s bull run and 2021’s in extension and highlighting our price expectation for 2021 as the year comes to an end.
New Money
The first factor to consider is the influx of Millenials into Bitcoin compared to other assets. It got reported that Millenials and Gen Z inherited about $78 trillion of wealth, and some of that wealth has undoubtedly flown into BTC, considering it’s the preferred investment vehicle for people in these generation groups.
Limited Supply
The next factor bolstering the price of the benchmark cryptocurrency is its limited supply, especially now when demand is at an all-time high. Only 21 million Bitcoins will ever get created, and about 90% are currently in circulation. The current inflation of the Bitcoin network stands at 1.8% and will continue to decline as more Bitcoin mining reward halving occurs. As we know, Bitcoin mining is the only method through which new coins can get created.
Institutional Adoption
This year was a big year for institutional adoption and investment in Bitcoin, as corporations seek out hedging assets amid financial crisis fears. 2020 saw well-known Bitcoin critics like JPMorgan and Goldman Sachs switch their stance, while we saw significant investments/adoption from Square, PayPal, Microstrategy, MassMutual, Grayscale, One River, Paul Tudor, Bill Miller, and several others.
Bitcoin Price Outlook for 2021
Bitcoin has entered a new bull market, which can be observed through on-chain metrics, institutional investment inflows, and a booming retail adoption. That said, making a precise Bitcoin price prediction for 2021 is not an easy task. However, popular predictions average at $50,000 by 2021. The primary cryptocurrency will likely follow its historical price dynamics, but in a more subdued manner because of its maturity. Regardless of the inherent risk in cryptocurrency trading, one thing for sure is that Bitcoin will rally in 2021.
Bitcoin (BTC) Technical Outlook — 2021
BTC/USD 2021 Bias: Bullish
Supply Levels: $24,300, $25,000, and $28,000
Demand Levels: $21,000, $20,000, and $17600
Bitcoin is likely to perform on a bullish sentiment as adoption picks up. That said, we predict a revisit of the mid-$21,000 level in the coming weeks, where a rebound could be facilitated. We can see on our weekly MACD that BTC is now venturing into overbought territories like in 2017. Bitcoin will likely take a breather at this point before resuming its sharp bull rally.
The next break of the $24,300 ATH will likely get followed by an immediate clearance of the $25,000 round figure.
Considering the factors surrounding the Bitcoin market and the financial market at large, we expect a continuation of the parabolic bull run into 2021.
Source: https://learn2.trade