
Welcome to the new Traders Laboratory! Please bear with us as we finish the migration over the next few days. If you find any issues, want to leave feedback, get in touch with us, or offer suggestions please post to the Support forum here.


Dogpile
-
Content Count
584 -
Joined
-
Last visited
Posts posted by Dogpile
-
-
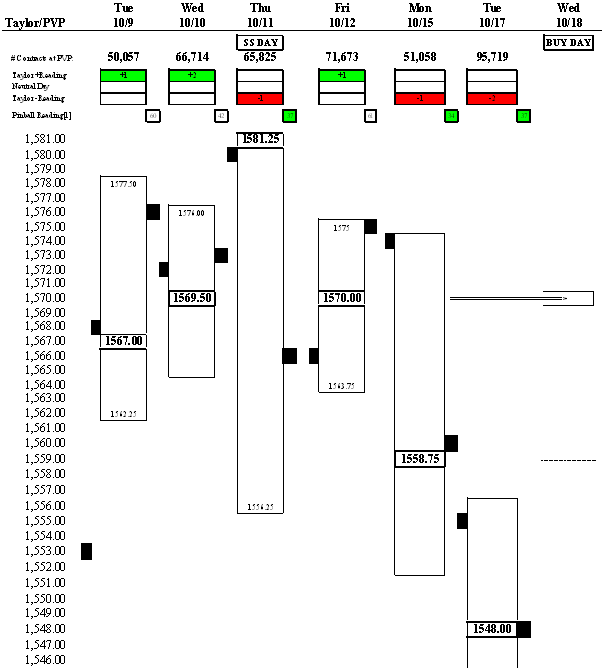
You can't go long on a sell day UNLESS a BV is made. You also don't short on a sell day.On a BV the idea is to sell your long position the SAME day on any penetration of the PREVIOUS day's (10-16) low which was 1545.20. So, on this sell day 10-17 one would have taken the long BV opportunity and shortly been out of the market the same dayexcellent, thanks.
I am clearly having trouble figuring out which day is a buy or sell or sell short day according to Taylor. (This was what Rashke said in her section of the book too). I thought 10/11 was a sure sell short day but you are calling it a 'buy day' -- and it is permissible to short a buy day if you suspect 'high made first'. So I was shorting that day thinking it was a 'sell short day' and you were shorting that day because it was a 'buy day - high made first'. What you name that day really doesn't matter in this case --- we are both shorting on the expectation that the high will be made first.
The problem arises on the other days; 'sell day' and 'sell short day' -- since you never go long on a sell short day but I might go long on a sell short day because I actually think the the sell short day is a buy day.
at the end of the day, your software is doing something that I am fundamentally missing. Can you outline the most basic rule for what sets up a 'sell short day'? ie, you know for sure it is a 'sell short day' if __________. The only thing that truly matters is which is the sell short day -- because you cannot go long a sell short day, per Taylor. It also matters which is a 'sell day' because you are only to go long on a Violation of the 'Buy Day Low' -- if it is a 'sell day.' It just doesn't matter if its a buy day so much because you can go long or short, per Taylor, depending on if you think the high is going to be made first or not. Thus, the rules for a buy day are not important -- except to the extent that locating the buy day might help you figure out which is the sell day and which is the sell-short day. Thus, this is an open question that I hope you are understanding -- how do you figure out the 'sell short day' -- from high-low calculations? or from counting over from a buy-day + 2 days? or some other way? same question for a 'sell day' -- how do you know for sure that the day that the next trading session is a 'sell day'?
This was long-winded but probably more than crystal clear if you interpreted Taylor already (and have therefore proven you can understand some poorly worded material).
-
let's go back to recent action.
WHY, so 10/11 was clearly a 'Sell Short' Day.
Thus
10/12 = Buy Day
10/15 = Sell Day
10/16 = Sell Short Day
10/17 = Buy Day
So we come into 10/17 on a 'buy day'. Taylor would look for a test of the 10/16 low to go long (a violation of previous day low or a higher bottom). Instead we gap up big, setting up possibility of 'high made first'. This is what happens as the violation of previous day low doesn't occur until the afternoon. In this case, what is Taylor looking for in his next trade? Is he waiting for the sell day price action to test the 'buying day low' in the morning session for a trade back up? Or is he waiting for a sell short day (10/19) to short on a test of a recent high? If waiting for the SS Day, which high (10/17, the buy day high or 10/18, the previous day high)?
I am confused on this past weeks action on what Taylor was looking for as his 'objectives' were just not met ('objective' is what Taylor uses to describe the zone in which he would like to initiate a trade).
I would think that when you go into 10/17 on a clear 'buy day' -- and it then trades 'high to low' -- then that is a sign of a downtrend. But you also mentioned that a violation of the buying day low can be a buy. It never violated the buying day low on Thursday 10/18 so it doesn't matter so much in this example -- so this is just a general question and is why I ask what Taylor does on the 'day after' -- when a buy day ends up trading High first --- or the day after a sell short day when the sell short day trades low first, high last.
here is chart of the action. I just can't see any trades that set-up per Taylor recently. Hence, my question.
thx in advance
-
Thanks WHY,
My strategy is to scalp a few points a day at high % and then occassionally catch that big move. Having a bias, be it a Taylor bias or any other directional bias, really helps in order to manage the intraday cross-currents. If you are thinking short, you can let the cross-currents set-up your shorts.
The best days for me many times are not strong single-direction days but those choppier days that have multiple set-ups. I make money on the dogpile days -- just not a ton. For example, I too did a short trade on 10/11 -- at 84.75. I had a directional bias of short and was looking for 'high made first' after 2 low to high days. We tested up and I was able to enter at a price that showed virtually zero adverse move after taking my position. The problem was I covered in pieces down to 79.75 --- only to watch it absolutely fall apart to 70.00 - a high-volume zone -- where it congested and then fell apart to 56.00. I would have re-entered short if a quick bear flag had set-up well above 70.00 -- and looked to cover into the 70.00 zone. This often does happen but didn't on this day.
I do also trade stocks and have more of a multi-day time-horizon than I do on futures. But I would like to trade a different futures account with a higher-timeframe focus, a la Taylor, where I could enter smaller size and play for bigger gains and allow more drawdowns -- I think this would complement my scalping/income strategy quite well as I often leave a lot on the table when I am right on the rhythm and would like to correct that. Thus, I would love some more Taylor tips.
Let me ask you a few quesitons:
1) Can you give just an idea of how your software projects prices to enter at assuming it is a buy day, or sell day or sell short day etc...? I don't need your code, I just want a direction in which to investigate. ie, Taylor talks about the 'spreads between the buying and selling objectives' (pg 76 in Pertinent Points). This is translated as the difference in highs and lows across days. Is this 'spread' used to calculate entries? If so, can you give some guidance on a direction to investigate?
2) How long did it take you to make a Taylor 'system' profitable? I assume there were some drawdowns along the way to refining your software.
3) Is your 'system' actually all mathematical or is there discretionary oversight by you? ie, can it be back-tested or does it rely on interpretation?
thx for any help in advance
-
Thanks WHY,
My strategy is to scalp a few points a day at high % and then occassionally catch that big move. Having a bias, be it a Taylor bias or any other directional bias, really helps in order to manage the intraday cross-currents. If you are thinking short, you can let the cross-currents set-up your shorts.
The best days for me many times are not strong single-direction days but those choppier days that have multiple set-ups. I make money on the dogpile days -- just not a ton. For example, I too did a short trade on 10/11 -- at 84.75. I had a directional bias of short and was looking for 'high made first' after 2 low to high days. We tested up and I was able to enter at a price that showed no adverse after taking my position. The problem was I covered in pieces down to 79.75 --- only to watch it absolutely fall apart to 70.00 - a high-volume zone -- where it congested and then fell apart to 56.00. I would have re-entered short if a quick bear flag had set-up well above 70.00. This often does happen but didn't on this day.
I also trade stocks and have more of a multi-day time-horizon than I do on futures. I would like to trade a different account with a higher-timeframe focus, a la Taylor, where I could enter smaller size and play for bigger gains and allow more drawdowns -- I think this would complement my scalping/income strategy quite well. Thus, I would love some more Taylor tips.
Let me ask you a few quesitons:
1) Can you give just an idea of how your software projects prices to enter at assuming it is a buy day, or sell day or sell short day etc...? I don't need your code, I just want a direction in which to investigate. ie, Taylor talks about the 'spreads between the buying and selling objectives' (pg 76 in Pertinent Points). This is translated as the difference in highs and lows across days. Is this 'spread' used to calculate entries? If so, can you give some guidance on a direction to investigate?
2) How long did it take you to make a Taylor 'system' profitable? I assume there were some drawdowns along the way to refining your software.
3) Is your 'system' actually all mathematical or is there discretionary oversight by you? ie, can it be back-tested or does it rely on interpretation?
thx for any help in advance
-
Back to Taylor,
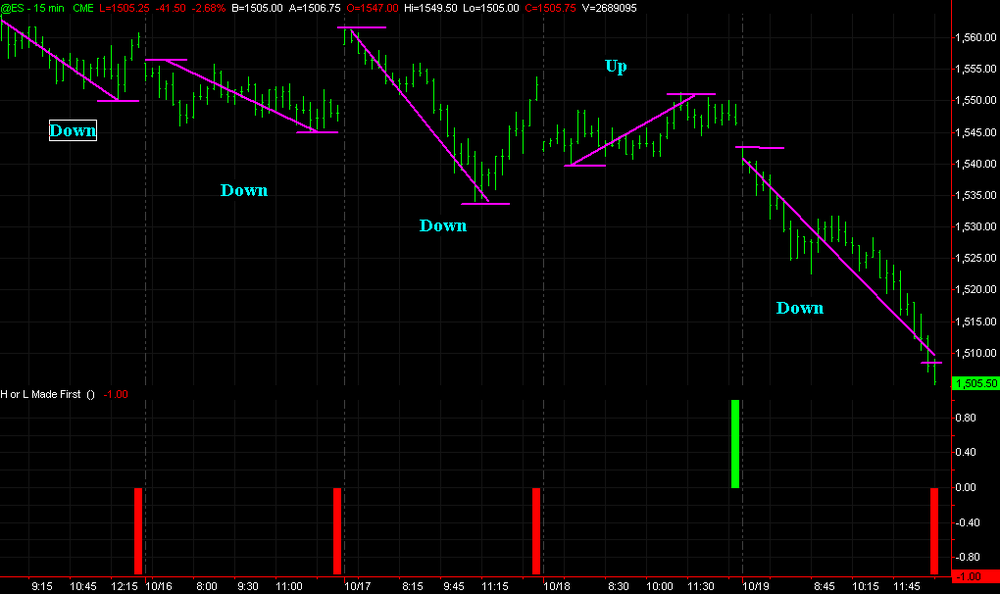
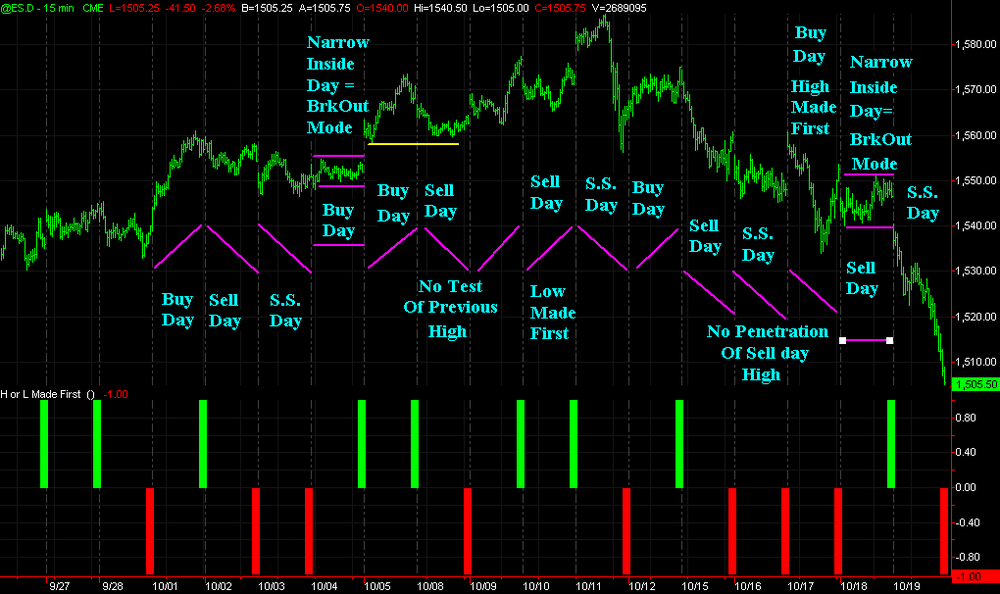
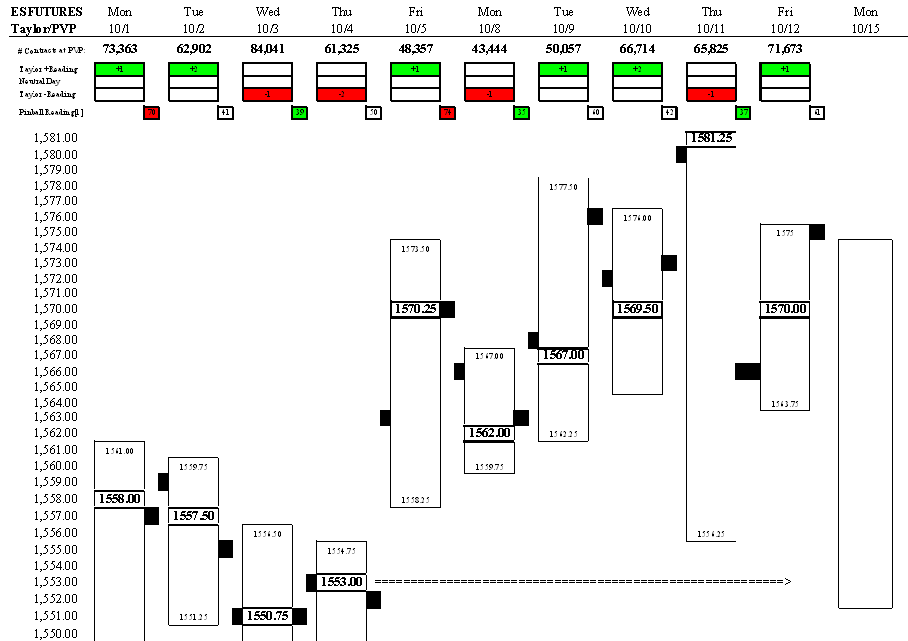
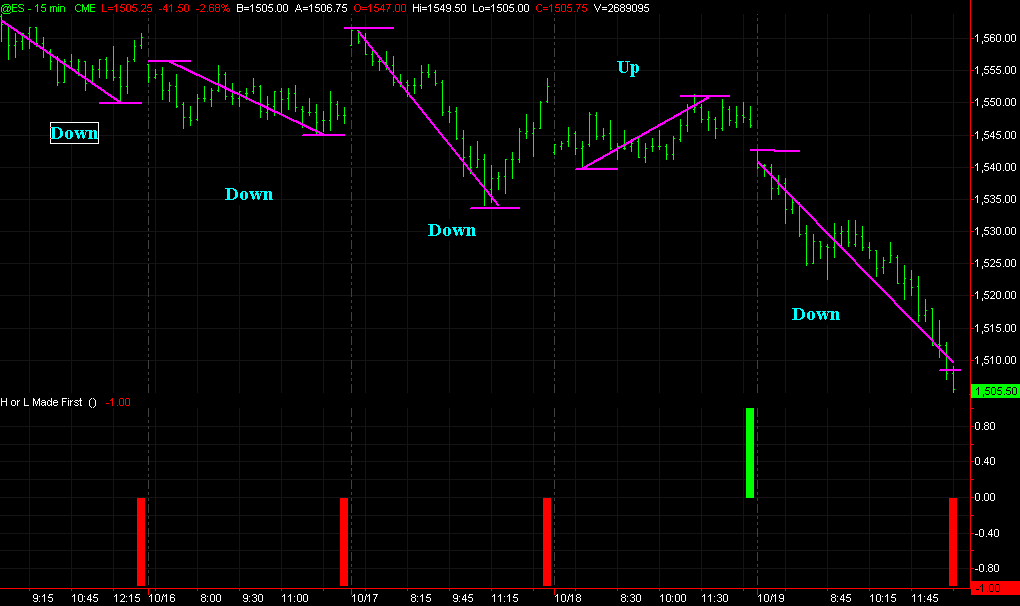
After running my simple 'High or Low First' Indicator on Tradestation (EasyLanguage) -- and of course its obvious with 20/20 hindsight but look at this:
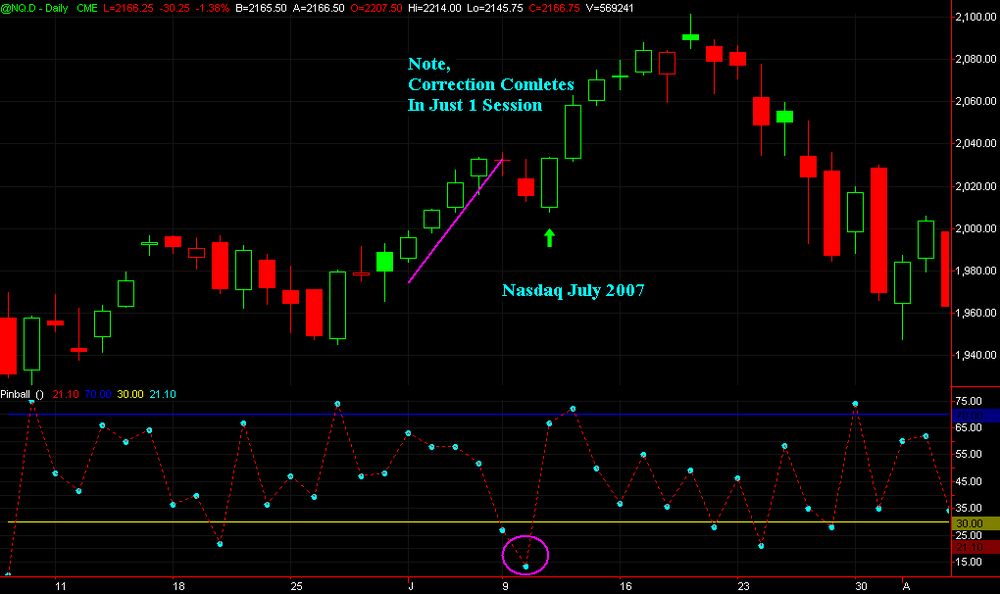
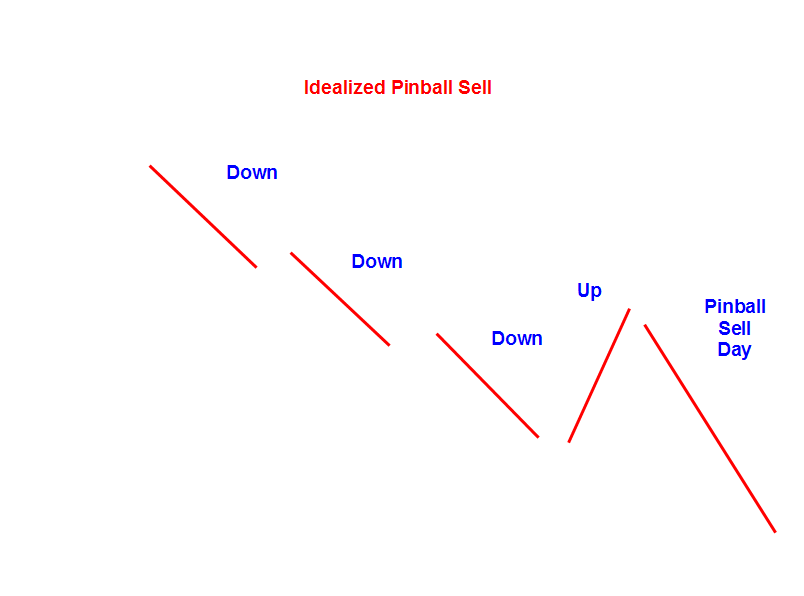
I first presented the 'Idealized Pinball Buy' at the beginning of this thread. The pattern was 3 up days and a down day leads to a Pinball buy.
An 'Idealized Pinball Sell' is the reverse of thisl. 3 down days and an up day leads to a pinball sell. See last 4 days of this past week.
just FYI.
-
<<On these two you would be allowing short or long on any day. This means there is no three day cycle. >>
In my view, there is sometimes a 3-day cycle and sometimes not.
WHY?, it would be helpful if you could post some examples of some classic Taylor that is not the standard 3-day cycle -- which is a lot of the time. I just can't imagine ONLY trading Taylor, there wouldn't be very many trades --- but this is where you could enlighten me on a good non-standard Taylor trade that occured recently. This screen capture software is simple to use and it offers a free trial for 30-days:
http://www.download.com/SnagIt/3000-2192_4-10717260.html
If you could capture some recent action and annotate a real-world example, that would go a long way to helping explain Taylors method.
I think I can offer a few trade ideas that may add an extra few points a week for you if we engage here. I am asking you to share some of your expertise publicly in exchange for that by showing some real-world examples of recent action.
I think of myself as a hybrid technician. I combine patterns and indicators and 'concepts' into set-ups. I will post a summary of Friday as an example. Maybe you could do something similar -- just pick a day and do it. I find that expaining it here on traderslab.com really imprints it on your own brain -- you gain by doing this kind of homework and you gain when somebody else shows you how they are thinking. I have had very positive experiences here and learned and shared a lot. 'ant' and 'jperl' stand out, to pick a few.
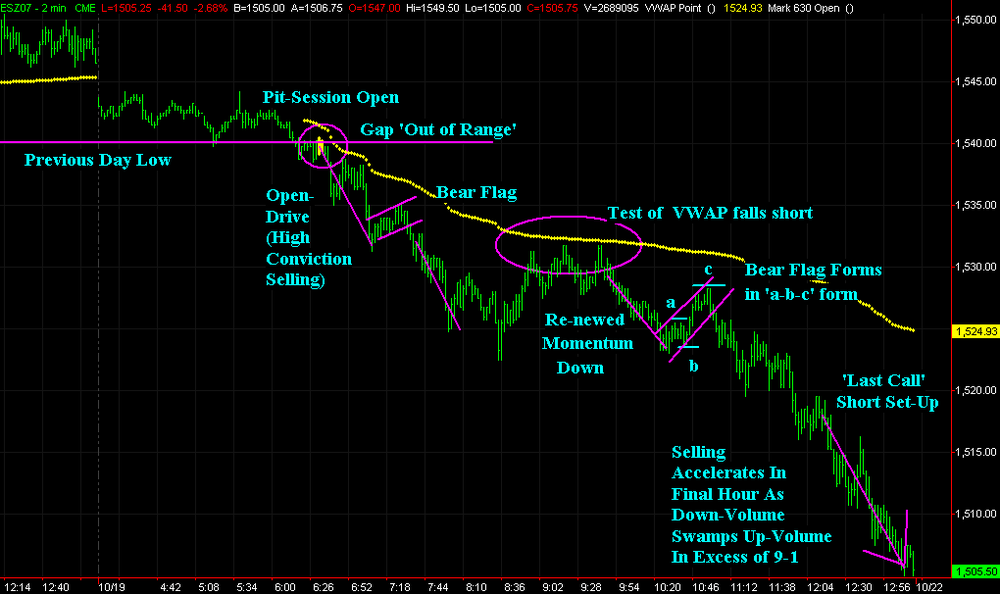
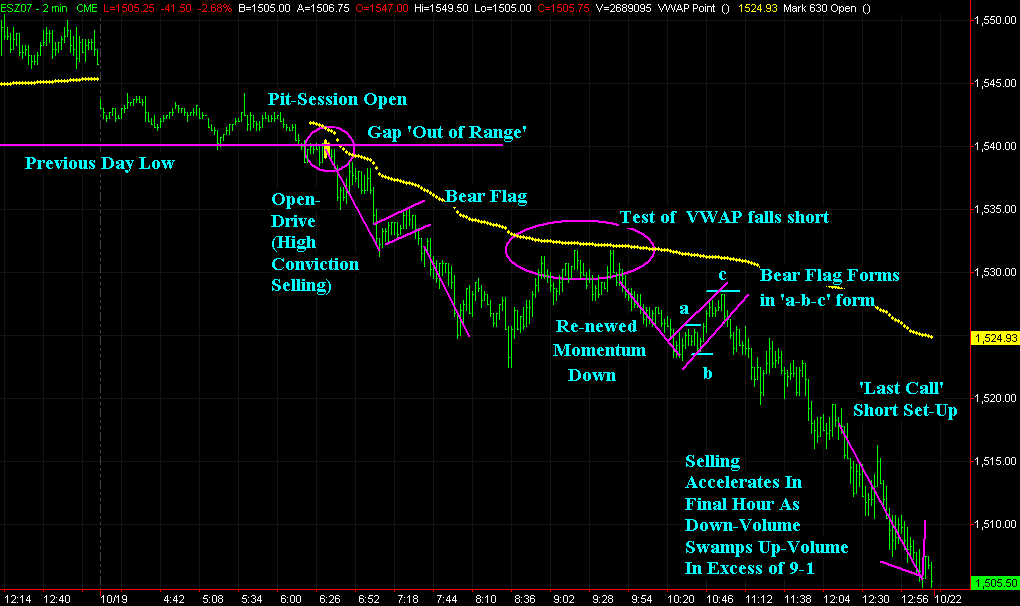
Here is how I look at Friday in retrospect. There is no 'Taylor' in this -- I just wanted to show you how I think and then you show me something about how you think.
Friday -- you had a 'gap out of range' (gaps above or below the entire daily-range of the previous day). This is a market profile thing. Thursday had a big gap down but the gap was 'within range' of the previous day. Fridays gap 'out of range' is hinting of a potentially dynamic day -- the 'gap within range' does not. This is offering a 'roadmap' which may or not play out -- but its nice to have the roadmap and know what you are on the lookout for to confirm this. You then had 'open-drive' -- a high conviction directional move off the opening price -- this again is a Market Profile concept and is confirming the bearish roadmap. This down move also comes after a 'narrow inside day' -- which is a standard breakout set-up. After the 'drive' lower -- you then later had a 'test' of the VWAP price --- which coincided with a '15-min First Cross Sell' -- this is a pattern recognition/indicator thing from Linda Rashke, which is my absolute favorite set-up for big moves. I also noted some bear flags that showed up. I find the 'first flag' after a strong inital thrust away from VWAP to be a very nice reward-risk set-up. When you enter the last hour and down-volume is swamping up-volume as it was on Friday -- you have the potential for accelerated selling into the close. Rashke calls this set-up 'last call' -- its a 'trend day' set-up where there is often a strong move that kicks in around 3:15pm on a true trend day.
-
I wrote some quick easylanguage (Tradestation code) to help visually define whether high or low made first historically.
I have annotated the chart a bit.
I note that the goal is to start with a thesis and then see how price action works out. Sometimes, you simply won't be able to figure out in real-time where you are in the Taylor Rhythm -- but you can have a roadmap with the 'idealized version' --- and then adjust on the fly as necessary.
Personally, I like to just think in terms of concepts:
1) When there is a morning test of a previous day low - consider a buy
2) When there is a morning test of a previous day high - consider a short
3) A 'Sell Day' low should not violate the 'Buy Day' low -- a morning low on a sell day may be buyable if it makes a 'higher low' vs the buy day low
--------------
WHY?, I would love to hear some concepts on how your calculations work. I assume you are comparing highs and lows across days but I would like to here a tip or 2 about how you are doing this.
thx in advance,
dog
I will post my EasyLanguage code when it gets better. Don't have time to finish it right now...
http://bp0.blogger.com/_5h-SWVGx6Ms/RxoaQSyj7hI/AAAAAAAAAeE/FbCAy9XtpXA/s1600-h/Taylor+Summary+10-1+thru+10-19.png <---- if thumbnail doesn't work
-
thanks WHY? -- there is definitely more I need to learn about taylor and you are definitely helping.
you are saying that when the market makes a lower low after a buy day, especially if that low is made AFTER the usual morning 'reversal time', call it the opening 90 mins, then you actually aren't going to get a true buy day until more weakness plays out? You may get an up day, but don't expect the typical up day, up day, sell short day to necessarily play-out. Not sure if that is what you mean but I will read pg 48 and that area this weekend.
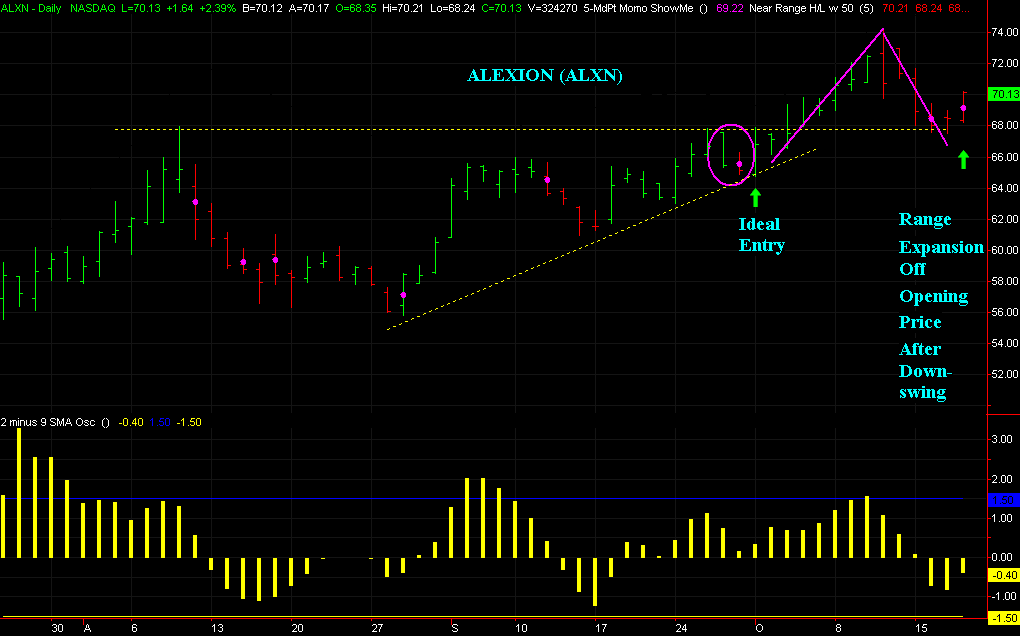
Historically, I have just thought about it like, start with a Taylor 2-3 day concept and see if action confirms or refutes this thesis. ie, we have seen a lot of down days lately and I thought we might be due for a day that makes a low in the morning and a high in the afternoon. This was wrong -- but price action clearly indicated this was not likely. We had strong range-expansion off opening price to the downside. We also had no visible pivots from any recent time in which to go long. Note my sheet of high-volume zones had no recent price to provide support for a long-scalp. that is, there was no area to 'test' --- a key, key, key Taylor concept -- that of 'testing'.
Thus, it made sense not to look for a 'morning reversal' today because there was no area of support. I ended up just waiting and catching a good chunk of the afternoon move down when it was clear that all signs pointed to 'trend day'.
I really want to read more Taylor and get to understand more about it --- I will try to add some value by offering up some of my thinking. Hopefully, we can keep this thread going a while longer. Some other Taylor types might start chiming in if we just keep at it a while longer. It is possible although maybe not looking that likely at the moment.
-
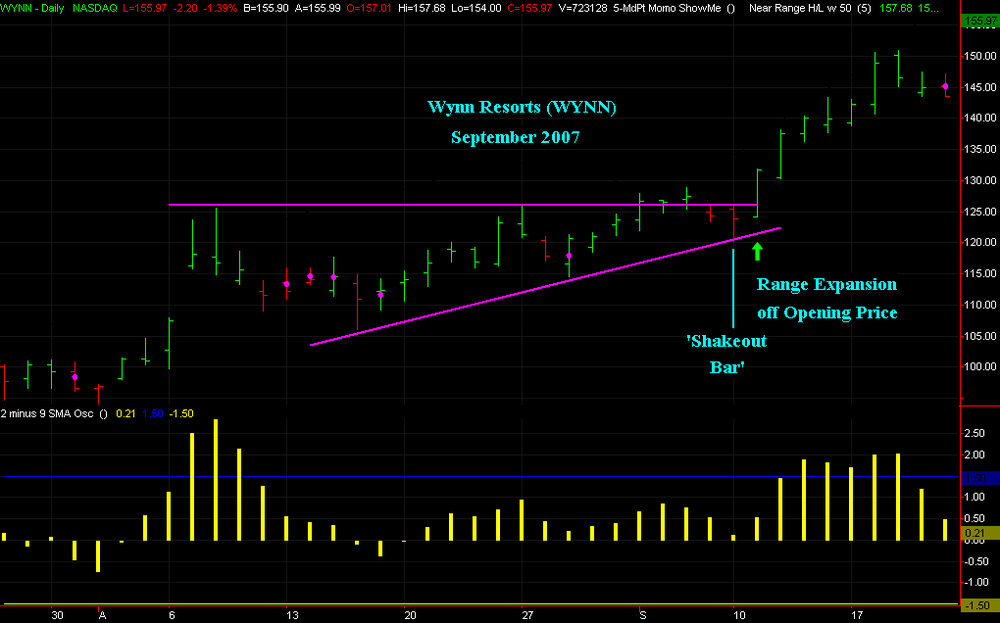
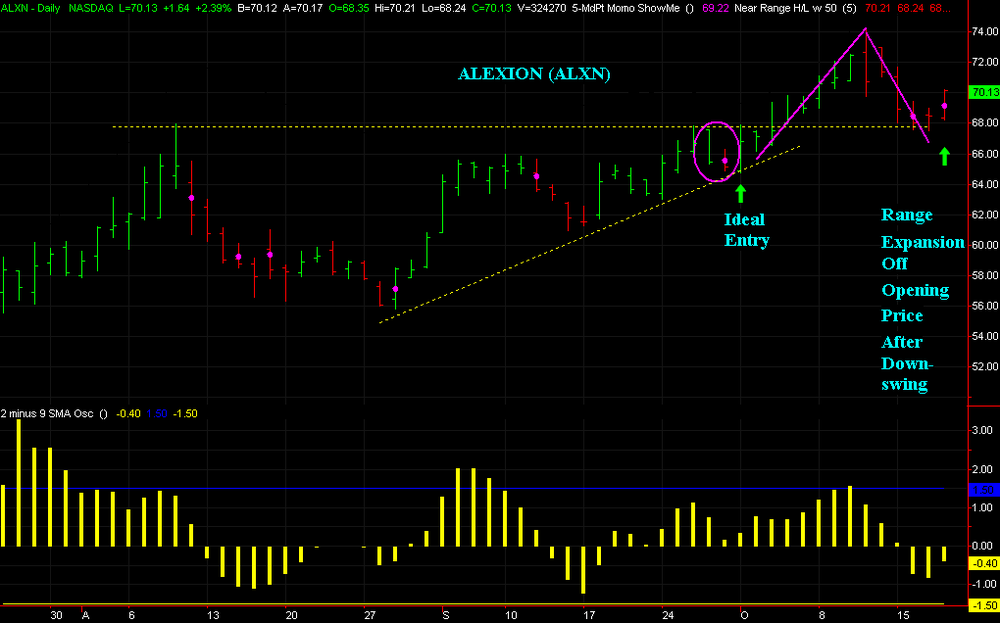
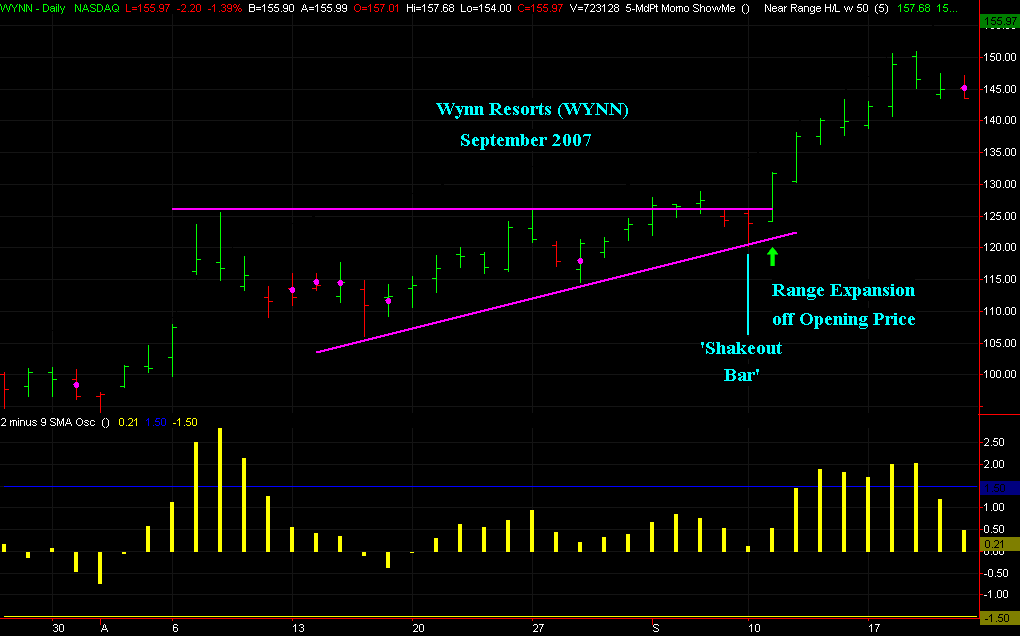
I find Ascending Triangles to be a fantastic pattern for swing trading. This thread is to keep a journal of some of these and hopefully others can find some good ones that I don't.
Idea is to play the short-term 'momentum off opening price' with intraday risk of maybe -2% stop loss with an upside of 5-10% if the intraday momentum leads to daily momentum (ie, the daily chart 'kicks in').
-
I don't think I understand Taylor as well as you do -- nor am I as strict about the rules. thx for the insight, very useful to hear how you are interpreting Taylor. You are educating me on a more strict Taylor discipline and I appreciate that.
As you can see, there was a buy today on a higher low and a sell into the outlined 48.00 pivot. This morning counter-trend strategy worked perfectly. I actually went long NQ for a trade and made good money getting lucky on exit -- but timing it watching ES move into 1548.00... I should have put a limit order to short ES at 1548.00 with wide stop but I have buy-bias at this point after so much selling over last 3 days.
I am thinking of continuing to look long as I am a swing trader and always fading the last big swing, mindful of the key pivots -- and adjusting on the fly as necessary -- with mind on whether we seem to be making high or low 'first'.
As of now, I think this is difficult structure with the 1548.00 resistance above, you need to buy well below 1548.00 to give yourself room to make money on long side so you can sell into that zone. But I think the next BIG move could be up rather than down so I don't want to miss that. I will protect myself with good discipline in case the next big move isn't up.
What do your calculations project as next downside pivot here?
-
Yesterday was Buy Day that played out in overnight session, as noted.
Today, I have a -3 Selling count which sets up another buy day. play is to look for a test of the low to go long. we are getting a gap down to test the low. If higher low, have loose 'head & shoulder' bottom -- which is very bullish if that happens.
There is a very high-volume zone at 1548.00 -- which makes this tricky. This could be a wall given sooo many contracts traded there.
-
<<I am still a firm believer in "Trade What You See and not What You Think">>
I think that the short-term 'set-up expertise' is 70-80% of the game. But just keeping in mind the high-volume pivots and watching the action there has really helped me. This is especially true in the morning, which tends to be a counter-trend environment anyway. I did a short scalp and a long scalp this morning and both worked. My oscillators lined up at exactly the point price entered the pivots I had identified. I feel comfortable using a wide initial stop at that point and scalp out partial positions in the noise and play the real pattern with the balance. I can also always 'scalp-out' if my oscillators do something I really don't like and take a small loss.
Also, watching the action around the pivots gives you valuable information. For example, you had a tight coil at 1548.00 yesterday and it pressed up to the 58+ zone overnight. A good upward coil break should not return to 1548.00. When it corrected down to 51.00 today -- it should have launched up. But it petered-out. This was the warning sign. Once it returned to 1548.00 -- that is a 'bull trap'. Now you go auction the other way. I didn't play that breakdeown because I thought 48.00 might get noisy --- but I certainly didn't go long into 48.00 just because it was a high-volume zone.
I don't know, it works for me. To each his own.
-
yah, today is clean buy day. the move is coming overnight however. a vague guess makes me think we could test the high-volume 1570 area today. but resistance around 59.00 also.
-
just a miserable session today.
monster volume built (95k contracts) at 1548.00. This is the highest volume PVP in weeks by a large margin.

-
<<Is that a spreadsheet or came from a piece of software ?>>
spreadsheet I keep by hand. keeps me away from buying right into significant resistance or shorting right into significant support.
-
<<The other is when there is an abberation in the market it "may" cause the day to change. I can't get into the details of it but what I have found interesting is that you end up on 10-15-07 calling for 10-16-07 to be a buy day. I ran both my calculations and I come up with both calculations saying it will be a short sell day on 10-16-07. My strategy for tomm would be to short. I would try to short near 1574 to 1576 or higher if market trades higher. >>
so you are looking to short 74-76? that is +15 pts vs the close. That is a long way up.
It is not really clean in terms of what it is Taylor-wise.
The pinball reading is low -- but we haven't had multiple up days in a row so its not a clean pinball buy day. The 2-ROC isn't real low due to Thursdays low-close. But we traded 65k contracts at 1581.25 on Thursday -- a significant amount -- and we have now flushed out many of those longs as we built value at 58.75 today, down -22.50 points lower than Thursdays value level and -35 pts high to low. A lot of volume built up in the low-mid 50's today and someone was buying down there. This sets us up for an up-auction attempt -- which may indeed fizzle.
Tomorrow could very well be a 'sell short day' -- but that might play out more in the afternoon anyway. Its option expiration week so maybe we get a roller coaster 'complex' day where we go lower, test way up and then close very low -- consistent with a sell-short day. No matter what it is though, I will just be watching my oscillators at key pivots and look to make a few low-risk points that way.
-
I will try to keep it going.
Today was sell day and late Friday and overnight strength was sold aggressively this morning. Keeping the 'sell day' in mind kept you out of trouble today.
We have now built lower value 2 straight days. Despite Friday being an 'up close' -- price was 'accepted' lower by forming a PVP at 1570 vs Thursdays 1581.25 level.
Thus, we have 2 straight days of building lower value. Tomorrow is another 'pinball buy day'. Look for a test of the low to go long. Remember, this is just a guideline.
Realize that there is substantial volume from past days in the 1570.00 zone so a direct push up into that level could set up a short.
There are 2 key concepts with Taylor.
1) look for 'tests' of important pivots.
2) look for morning reversals on key days.
We 'tested' up out of 1570 late on Friday and onto Globex overnight. This test led to a morning reversal and a hard flush lower.
Tomorrow, I will potentially be looking for a morning reversal either on the test of todays low -- for a long-side trade --- or potentially looking for a morning reversal into 1570 resistance for a short-side trade. It just depends on the action but that would be my high-level thinking for now.
-
Here is a look at the fight if you are to initiate a new short down here. Not saying that is what you are doing, just pointing out the problems in shorting in general at this level. I would almost expect a test up at this point and can short higher for a play back to test 1553.00 area.
-
don't apologize, elliott wave does work enough to be useful. Not ruling that out by any means.
that said, 1553.00 appears to have some validity to it. would look for better ABC type of correction up and then maybe a short-scalp -- but day might be over in terms of the fun.
-
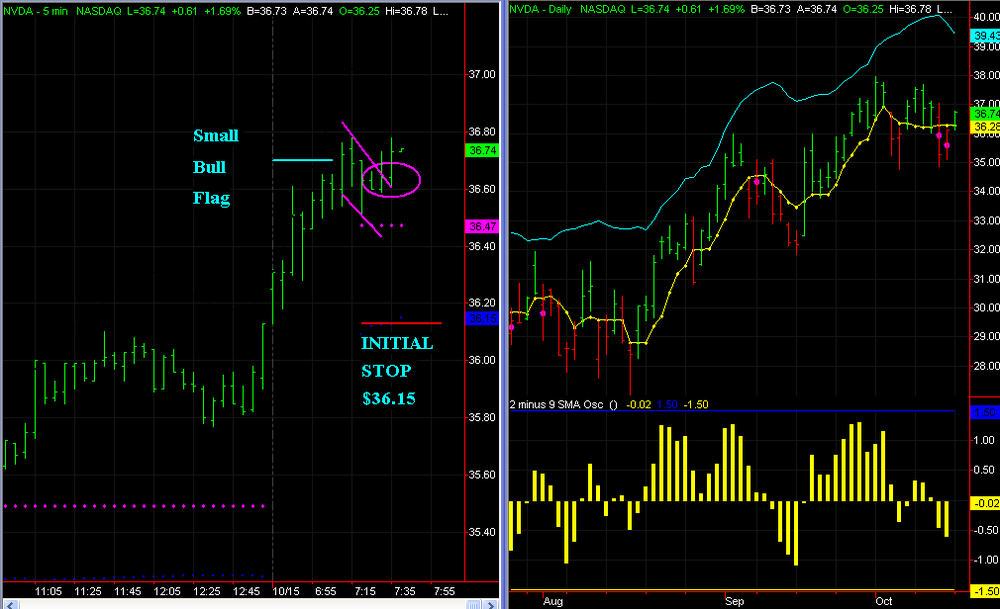
well, scratched the NVDA long as market is just too weak. NVDA made new high but net breadth is now -1600 and just fighting the current too much to stay with it.
-
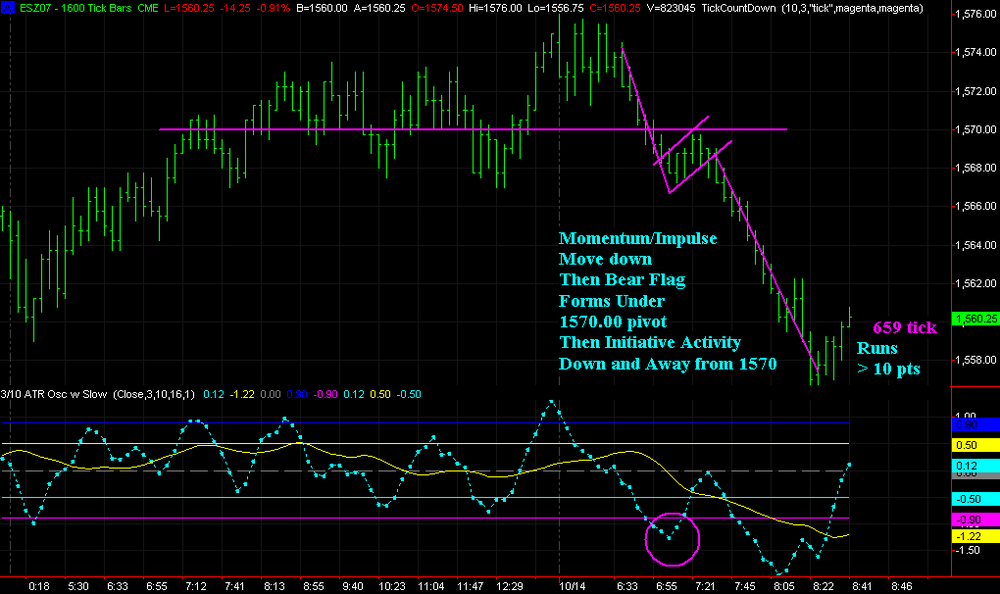
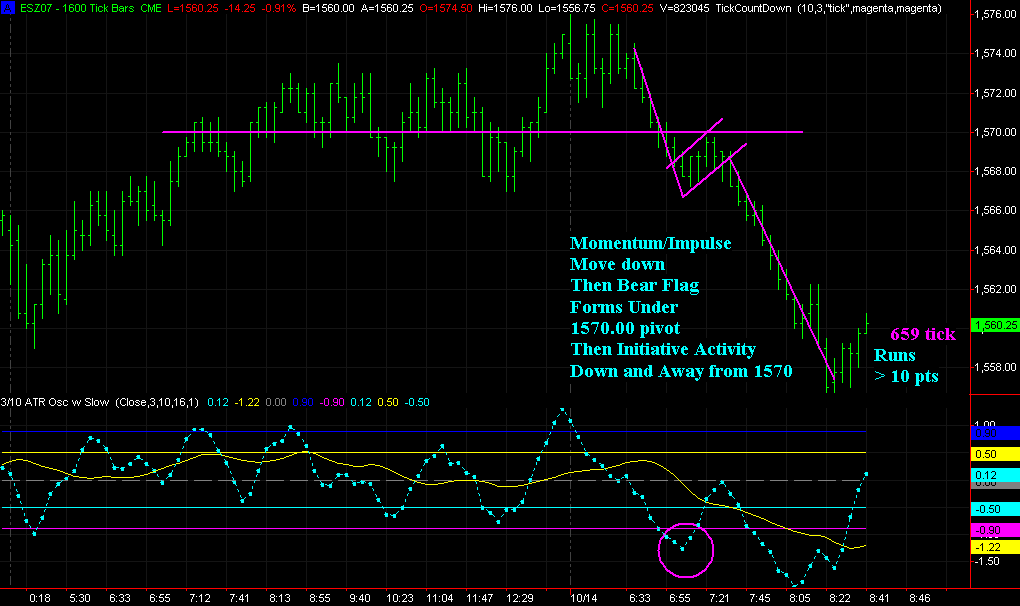
got a nice bear flag after strong momentum push lower.
Market then ran > 10 pts below 1570.00 pivot down to 1556.75.
1557.50 to 1558.00 was a very high volume area from 10/1 to 10/2 (those were daily PVP levels) so this made for some support.
-
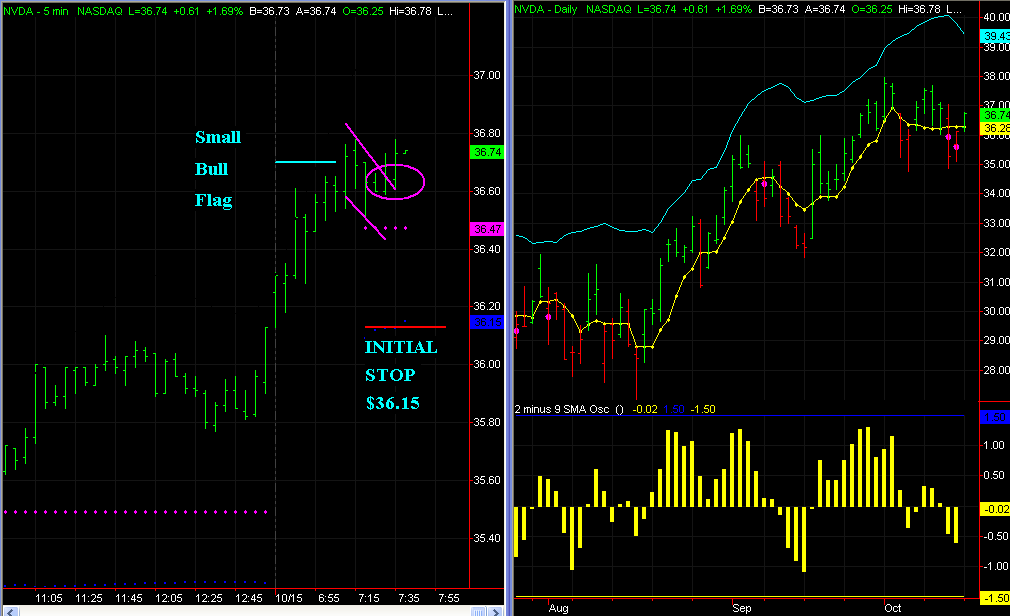
Entered NVDA long:
Intraday upside momentum either begins daily swing up or else stop out on intraday weakness. Initial risk is minus -55 cents.
Semiconductor stocks are strong today.
-
This thread is for discussing the major financial futures markets for the week. ES is the focus with NQ/YM/ER2 also watched closely.
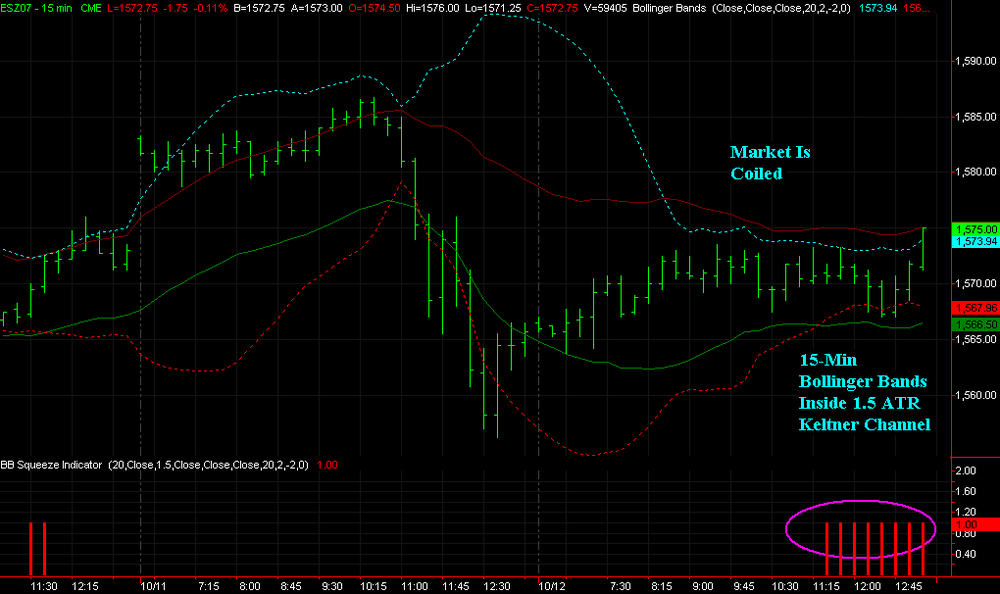
We have a selling tail above the old all-time, creating a a resistance zone 1579-81. We have some likely support from Fridays low near 1563.75.
We balanced at 1570.00 on Friday, with a low-ADX 15-min Bollinger Band Squeeze type of set-up.
2 potential types of plays I see here:
Go long should we get strong upward momentum off opening price.
Wait for the first bull/bear flag type of pullback following a strong impulse move.
-
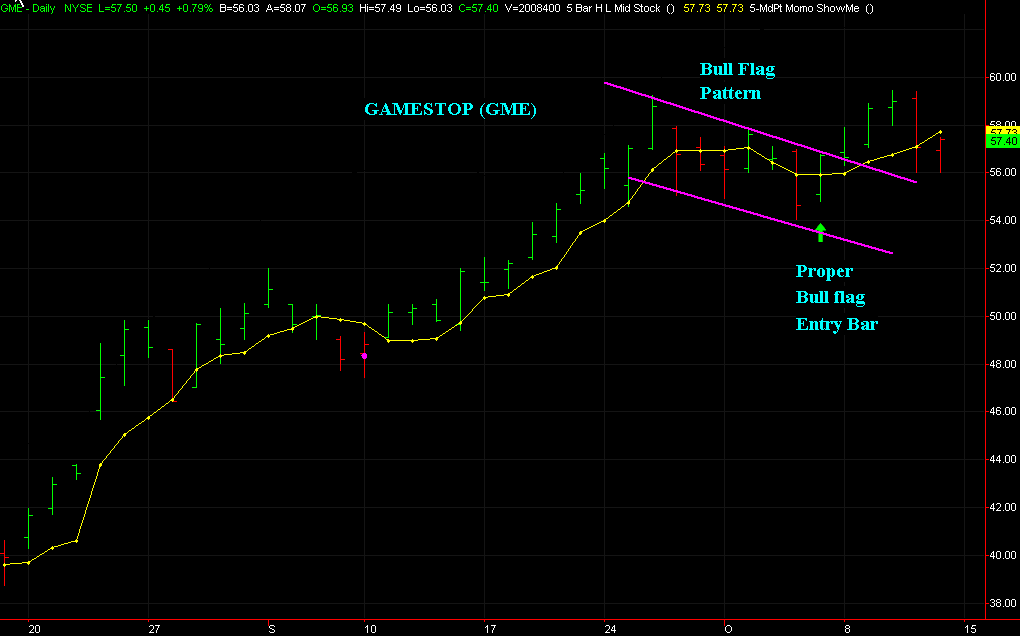
I actually kind of like the NVDA chart better.
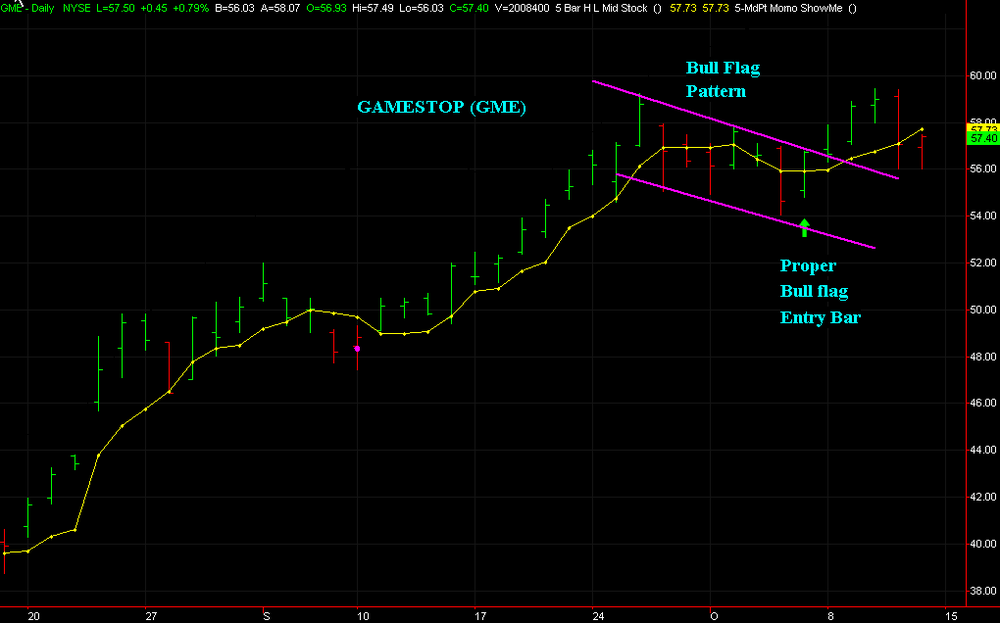
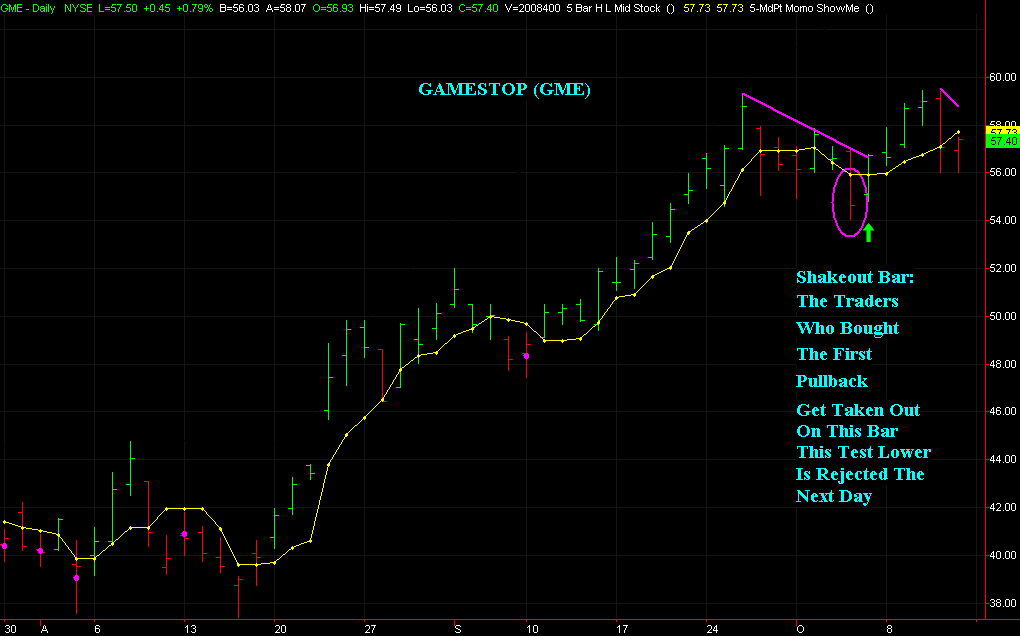
GME looks like it just completed an upswing and now might get choppy. The GME chart first showed a pullback from 9/27 - 10/1 off the high -- then it tested up which was a 'false rally' for the pullback-buyers. It shook those traders out with a big red bar -- and then it was ready to swing up. This is a classic 'false rally pullback' set-up. But that trade has now played out on that move from $55 to ~$59.
NVDA is in a multi-day down move already right here and did its big red bar on Thursday which likely shook out many of the weak-hands. Thus, the correction might be further along than it is for GME. This suggests more room for continuation on the upside should an entry present itself.
The FMCN chart is pretty on a higher-level due to the large base and continuation gap -- but the NVDA chart looks like the cleanest in the very short-term, IMO.


Tick chart for ES looks different than YM
in Technical Analysis
Posted
ES and YM have totally different trading dynamics, IMO. From a 'controlling risk' perspective, I think it is much easier to trade ES as it tends to 'back and fill' and will therefore 'let you out' if you think your trade is not right after giving it some time.
But from a 'reward' perspective, it is much easier to make big moves in YM because it can just fall apart or take-off in a 'spikey' type of move.
Thus, if I am 'going with' a momentum move -- I use YM as it tends to trend strongly on extended spikey type of movement. Nasdaq (NQ) and Russell (ER2) behave like this too. I don't have to trade that many contracts to make a lot of money and can control risk by using smaller size.
If I am 'fading' a move (trading against the recent move because I don't think it is set-up for continuation) -- I use ES with bigger size. This is because if I am wrong about fading this move, I can often get out as it backs and fills and not suffer too much damage in terms of ticks/points.
Being on the wrong side of a 'dogpile' YM/NQ/ER2 move can be absolutely brutal. Likewise, being on the good side of ES is rarely as lucrative as YM. Thus, I like trading small er size with YM and larger size with ES to even this difference out.
In terms of charts, ES trades a ton more ticks than YM -- thus one ES 100-tick bar might take 45 seconds to complete while a 100-tick YM chart might take more than a minute.