
Welcome to the new Traders Laboratory! Please bear with us as we finish the migration over the next few days. If you find any issues, want to leave feedback, get in touch with us, or offer suggestions please post to the Support forum here.


waveslider
-
Content Count
544 -
Joined
-
Last visited
Posts posted by waveslider
-
-
Hi Blowfish - been a while.
I think you were one of my inspirations for joining MC after leaving TS. Anyway - I still use them as a historical data provider. I am becoming more interested in intra-bar order flow and am about to migrate to IQfeed as a data provider.
Sounds like TS will not likely have sub-second data any time soon, agree?
Now my only issue with MC is on the automated side, but that is a different story...
-
Klotski-
I have recently moved my accounts from Tradestation and RJO to Optimus Futures, who clear with Vision Financial Markets.
The reason for my move began with the technology they offer, particularly the Rithmic data feed and platform interface (I use Multicharts and it works perfectly). But Optimus is not the only one offering good technology (I'm sure they interface with TT and/or CQG, though I would bet that Rithmic is just as good and definitely much much cheaper).
The playing field has been leveled with the brokerage business and what it comes down to now is the client service and attention that a customer receives. In this case Optimus is just amazing. Maybe I was jaded by the lack of attention I received from Tradestation, and RJO was not too bad, but Optimus really went the extra mile.
Matt, Jennifer, Sarah and the rest of the staff are patient, dedicated people. I got responses from Matt sometimes at 6 or 7 in the eve. PST and they are located in central time.
Anyway, if it is any help I would highly recommend Optimus for any type of trading needs. If they don't offer what you need they will bend over backwards to help you. I'm sure you will find their pricing is competitive as well. http://www.optimusfutures.com/
-
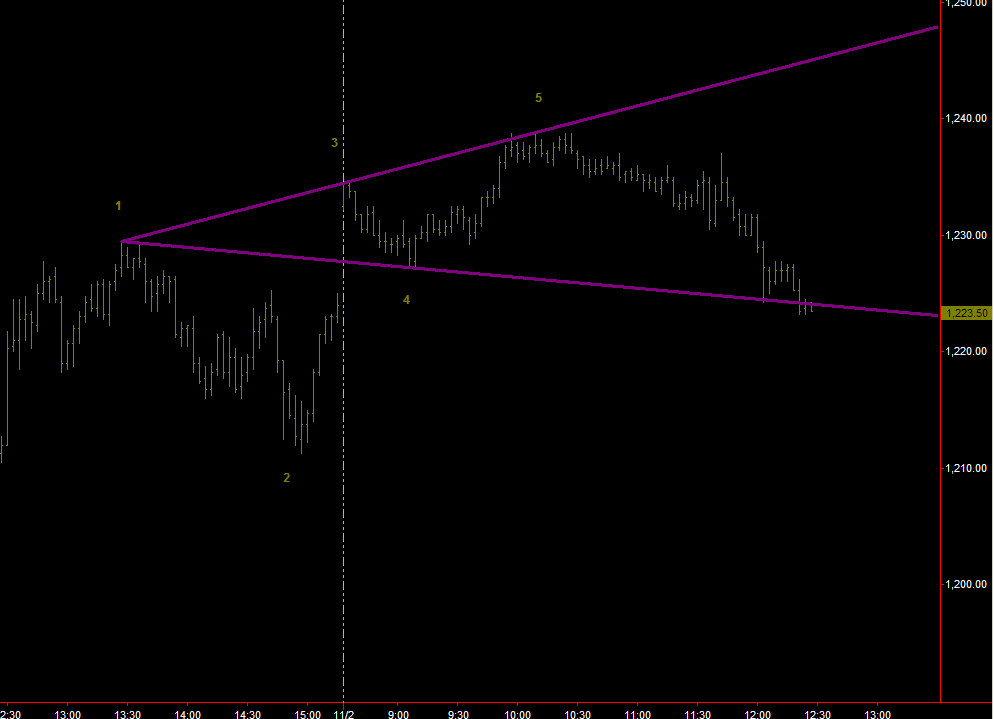
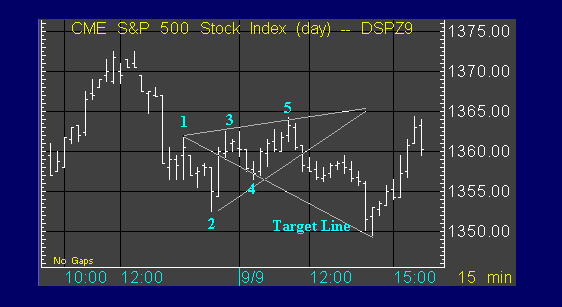
WWs all over the place lately.
3 minute chart of the ES
-
I see a few, but nothing obvious. Why don't you show me what you think you see...
-
Bob-
post a link please, I can't find it by searching
-
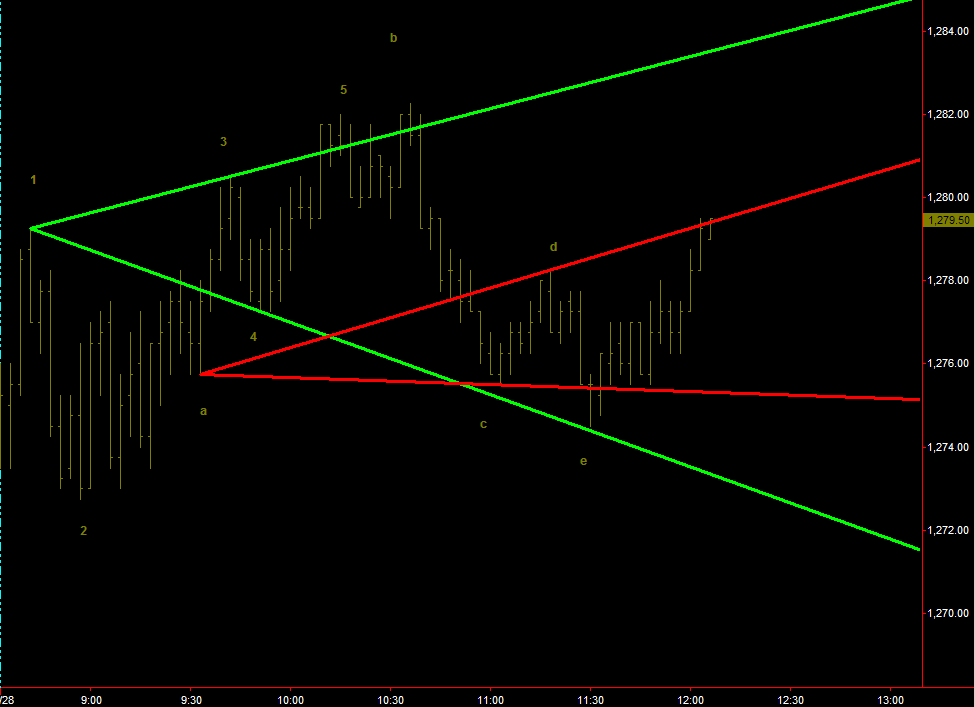
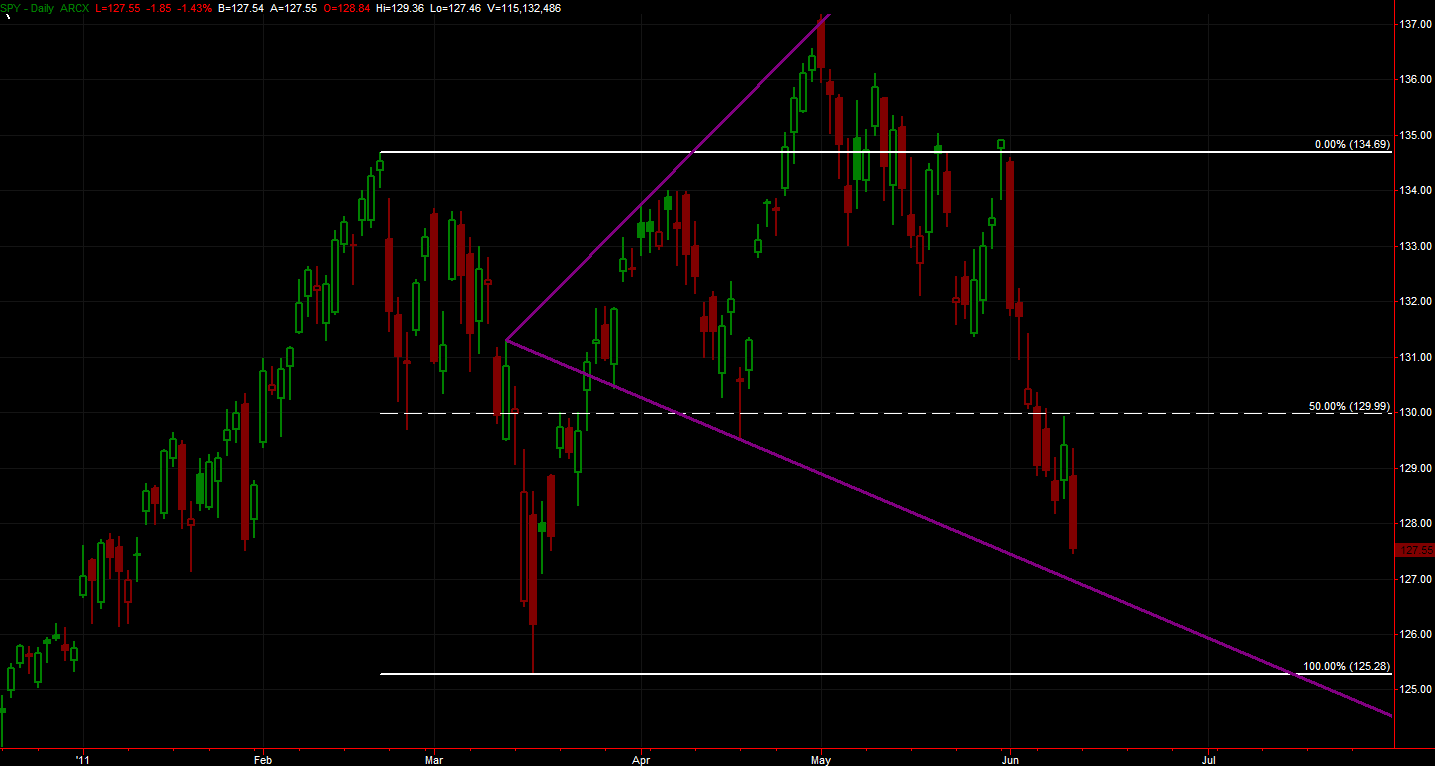
Two successful ones in a row.
Green one is labeled with numbers, Red labeled with letters.
Notice that the "2", and "b" points stuck out of the range. After that I was looking for the failure at point 5 and point e .
-
This morning in ES, a potential WW
-
looks to be a coil with a fakeout higher, overall a bearish pattern, but not a ww.
Point #2 should be where your point #1 is - Point #2 is always a major high/low. Keep studying. Look for Pt #2 to be a failed push to new levels.
-
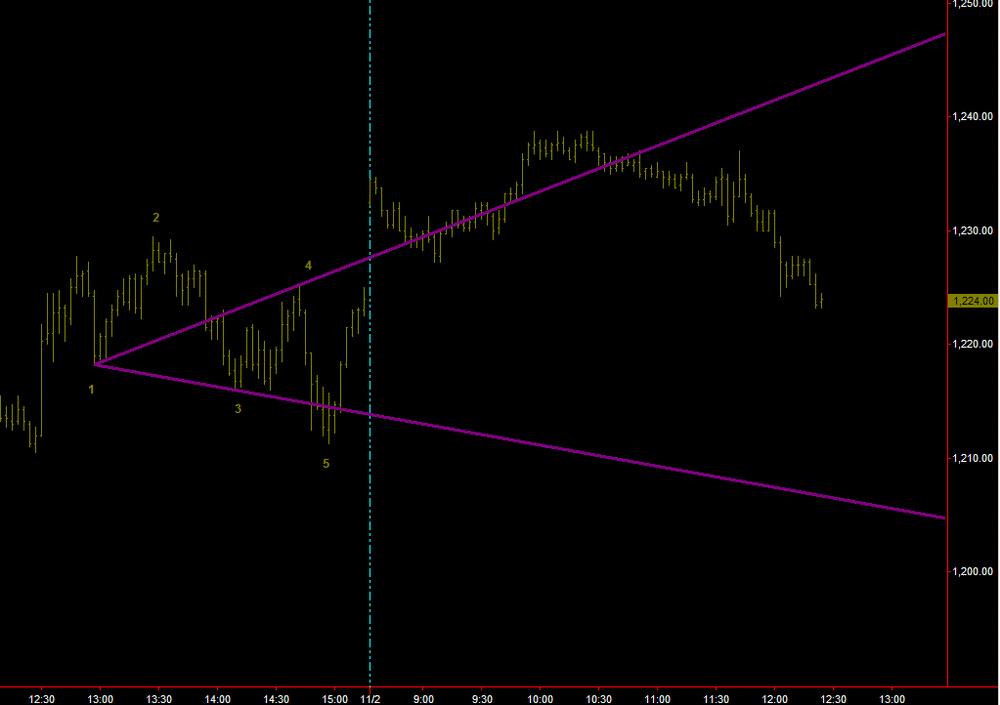
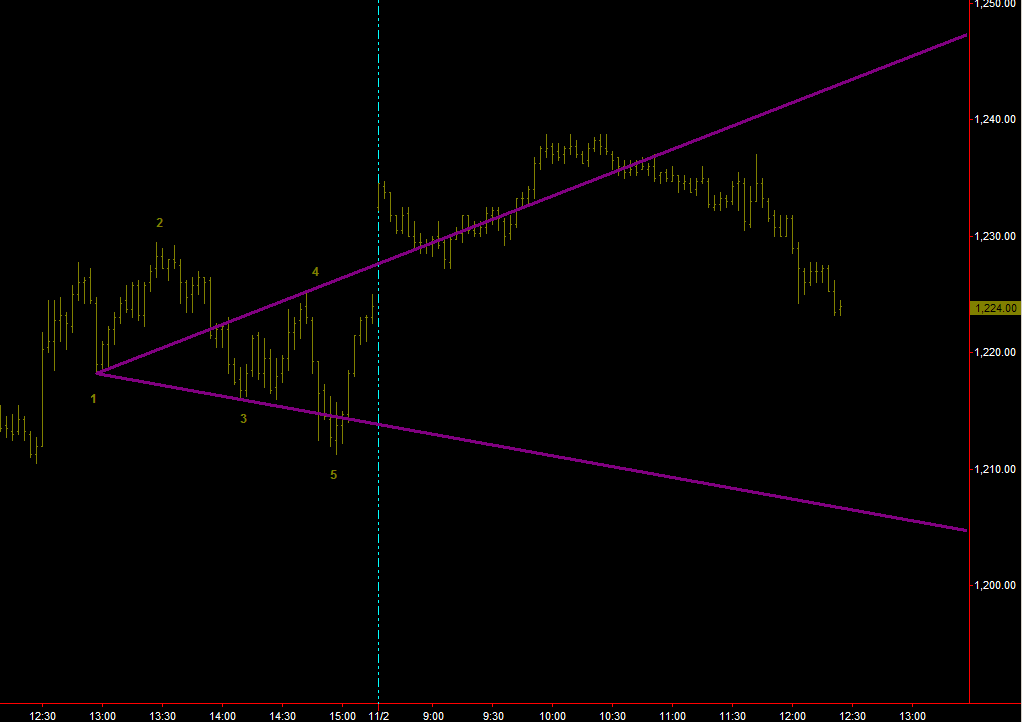
Here's one I was involved with today.
Notice the #2 point involved a good fakeout.
The wave from point 4-5 was fast and scary.
I was buying from 1220 to 1226

-
Thanks for your input waveslider.The software does it automatically in TS. Of course you have to cherry pick. With this one, I have noticed volume coming in with triangle breakout yesterday and today crossing 50MA . So some +...
I have that indicator in tradestation, it's always been buggy for me - what about you?
-
Hi wavesliderNew chart
Please check if the pattern is a wolfewave
Please also comment on my entry and exit
I bought 3 contracts when the bar closed above the moving average
I sold when the bar closed below my floor pivot for the second time
Total gain 62 points at $6 each
kind regards
bobc
not seeing it bob -
your #2 point should be at an extreme.
go back and study the pattern some more, your numbering looks incorrect. I don't see the entry
-
Looking good......Message is too short I guess I should be ok now?looks more like the top of a downward channel than a wolfe wave
-
exited with a small (.5) profit
pattern invalidated
-
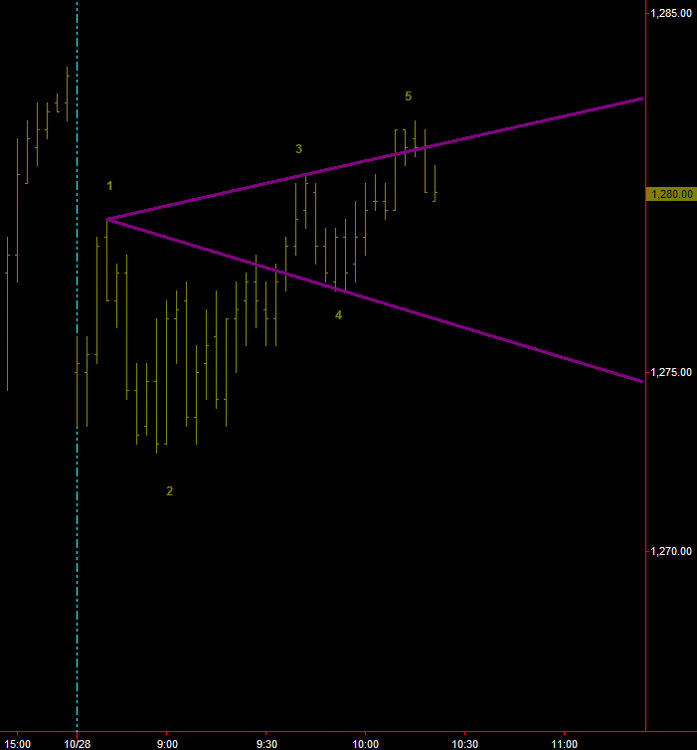
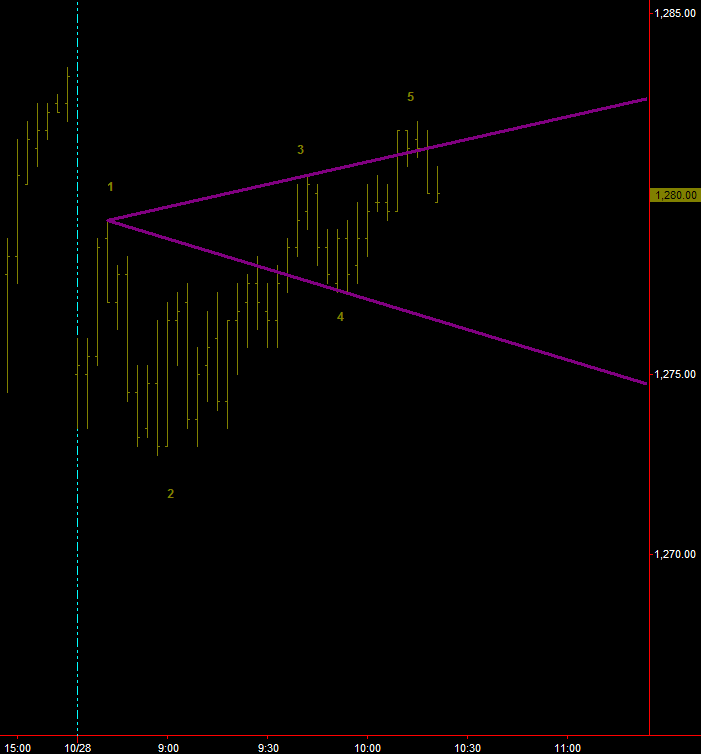
In progress in ES this morning, looks like a nice one on the 5 min. entry at 6.5 right here.
time will tell!
-
Dear wavesliderYou answered my next question before it was asked
Point 2 must be a recent high. Now I can see why the pattern is weak!!And there are four points at the top. I was lucky. I actually traded a failed wolfe wave.
Now you mentioned trading a failed wolfewave.
Please have a another look at my chart.
Going long would not have reached the target. It failed
But it will have to retrace some before you decide it has failed
How would you decide that?
Kind regards
bobc
You generally want to see extreme momentum on your side. The idea is that all the traders who are on the other side of your trade are panicking to exit their position, and this is driving price. If the trade does not maintain this momentum, I have found that failed WW patterns begin to have wide swings around the 1-3 line. Volatility is in a high state and the chop is large.
-
Bob-
Actually I very rarely trade them straight out, but I am aware of them as I know others are watching. Sometimes their failure creates an even better trade!
Love the mystery of market geometry though.
-
Dear wavesliderYES ,that makes more sense. Is there a rule to help in the position of "1" ?
Still a bit confused
Kind regards
bobc
best way is to look for #2 point first. Look for a #2 that creates emotion, activates stops by hitting levels that haven't been hit for a while. Then track price action when that move fails.
-
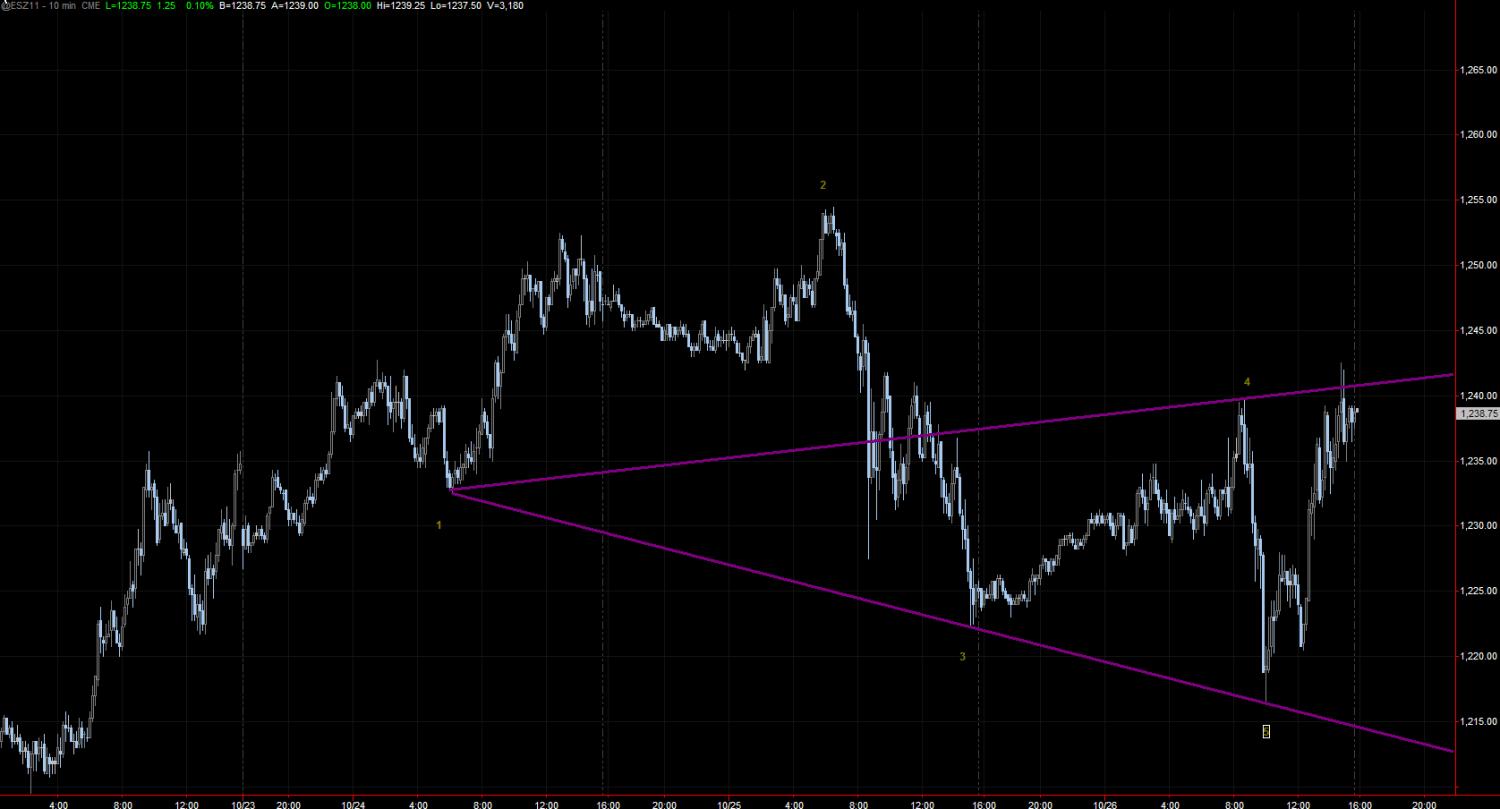
Not an ideal pattern, but I would have but the 1 where you have a 2. Bearish pattern.
-
Bob-
If you would like to discuss more you can PM me.
I trade mechanical systems, but on a morning like today when my systems were telling me that a range day was expected, and I see a WW pattern set up, I will add a few for my personal account. They worked well this morning, but they don't always.
Most important in any situation is risk control, WW is no different. When it works it's beautiful, and it has been working a lot recently. (In the S&P - that's all I trade).
best..
-
I first learned about Ehlers involvement in StockSpotter in Dec. 2010 - I believe that this is close to when his service initiated.
Ok great, here's the guy that wrote the book on DSP cycles - he knows about rigorous testing and pitfalls to avoid in optimization. Tracking his results real time and the attached picture are the results of his "five star" signals over the past 6 months.
So what is this telling us? Ehlers reputation is somewhat on the line here - I know he has released less than profitable systems in the past, but he also ranks pretty high in Futures Truth with some systems.
Maybe his results will turn around, maybe they are out of sync with the market short term. 6 months pretty much straight down is a long draw down to weather.
Comments?

-
I will vouch for Steve. Anyone that has read the posts here will see something interesting - the way Steve handles criticism. That one thing tells me he is a good trader: he does not respond to emotional attacks with revenge.
How many of us have lost money on a trade and then take revenge (usually on our own account)?
I have Steve's course and I will tell you that the simplicity of his method is not amateur - it is elegance. It is certainly anything but snake oil.
A good trader doesn't need more than moving averages to give them a mechanical reference point. Steve takes these and offers entries that are appropriate for the market context dictated by the position of the moving average. Yes moving averages lag, and Hull, Jurik, T3 are way more high tech - - but it is what it is - - high tech indicators are just a manifestation of price action.
Steve has boiled everything down to the bare essentials - with anything more there is too much interpretation - something that we humans unleash our emotions and will on.
I would say that Steve's method is excellent for a discretionary trader- but I am not a discretionary trader. To be honest I couldn't make it as a discretionary trader, maybe someday I will, but until then I am with the weaklings like Urma Blume who rely on probabilities.
Honestly it's a lot less work to be mechanical, but if I had the discipline and calm required - there is no other way to be as flexible as the markets require than to use the brain over probabilities.
I have communicated with Steve, and I believe him to be honest and incredibly disciplined. For an example, look at the tradestation forum where he posted every day. When the market was volatile in 2008-2009 his results were unbelieveable. Mine were too following his method, but I kept breaking the rules. I ended up about breakeven using his methods, and not due to their validity, but to my own short comings.
I do well trading mechanically, that's how I make a living. Maybe someday I will have a "fun" account where profits don't matter. I would use an adaption of Steve's method if/when I do that. Self improvement is the greatest challenge trading offers.
Hope you sell lots of books Steve - if that's what you desire. I can't quite figure your motive out for working so hard - I admire it as long as you're not sacrificing something more important.
I always thought Kiwi was extra hard on UrmaBlume, but now I can see why. I have no affiliation with Steve or his books/courses - I'm writing to defend someone I believe is honest and who offers valuable instruction.
-
Can't believe how many times this argument has come up in this thread (which I started years ago). It goes to show how much of an art it is identifying this pattern.
Directly from the WW site here is a picture. Tell me if you think his example of point 1 is outside or inside price action elovemer, or does Bill Wolfe have the pattern wrong? If you have the manual you see plenty examples of the #1 point normally within price action.
I identify #1 usually at the 50% area of a previous wave because this is where the wave is inverting as volatility enters the market.
Point #2 is the point that needs to stick out of price action for a purpose - it is there to draw in the suckers who will be exiting on the 4-5 move. Once you understand this simple concept you begin to see the psychology of the pattern.
It actually doesn't matter where point 1 is, as long as there are sufficient suckers acting on point #2.
-
I've been riding the nasdaq for this one... almost complete now.
If you read my early posts I like to have the 1 point starting at a 50% point of a move (not always though). This works best when there is high volatility

-
D or DCL means decline from the high of day 1 to the low of day 2R or RLY means rally from the low of day 1 to the high of day 2.
In conjunction it could be viewed as an "X" or cross.
You virtually cannot have a large rally day without a small DCL.
I'm lurking - can you explain your theory further
Samadams' Hurst Cycles Analyses on ES
in E-mini Futures
Posted
How about an update on your Hurst analysis? What have you learned?