
Welcome to the new Traders Laboratory! Please bear with us as we finish the migration over the next few days. If you find any issues, want to leave feedback, get in touch with us, or offer suggestions please post to the Support forum here.


karoshiman
-
Content Count
473 -
Joined
-
Last visited
Posts posted by karoshiman
-
-
Reduced short exposure in QM at 88.225.
-
Took part of my profits at 2634.Sold remaining at 2652.
-
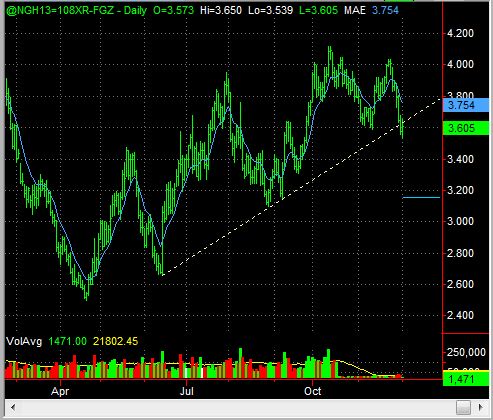
Out of my short NG position at 3.65. Watching closely whether to re-short or go long. Went long at 3.65... risky business.
-
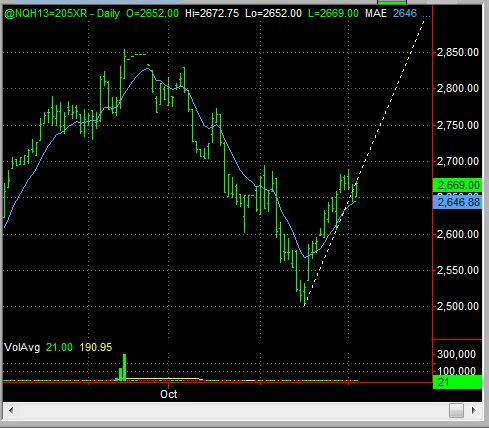
Shorted NQ at 2669 (March contract). Break of upward trend line yesterday.Took part of my profits at 2634.
-
Shorted NQ at 2669 (March contract). Break of upward trend line yesterday.
-
Stopped out of QM as well. Trying a short from 87.80. The long scenario is not valid anymore. Price needs to go above 90 in order for the long scenario to play out.
Various markets are taking a dive today.
-
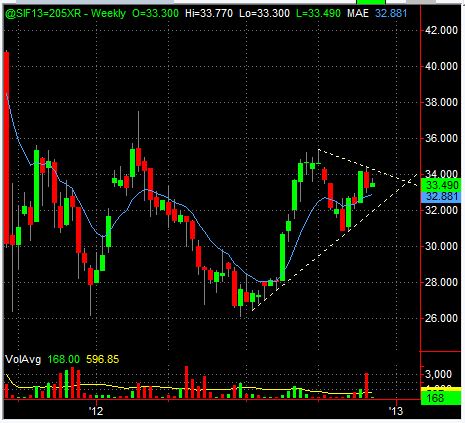
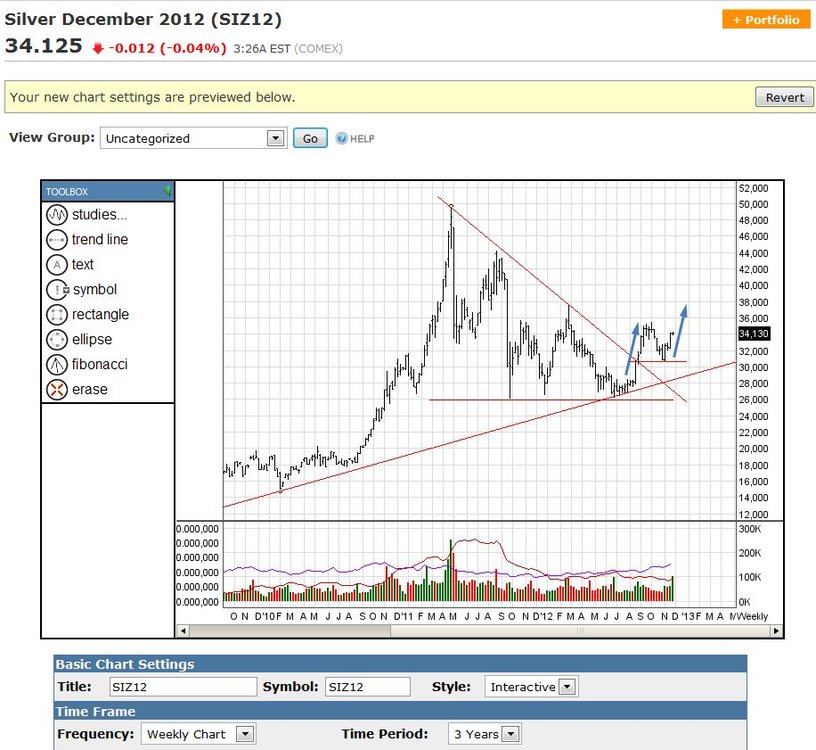
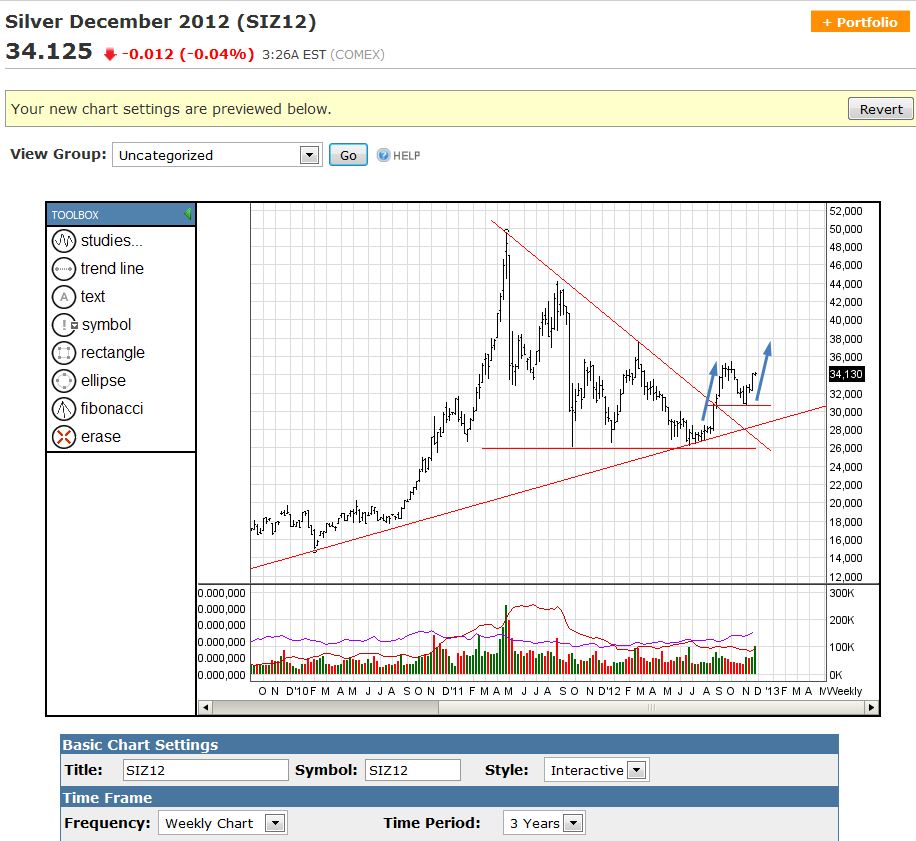
Got stopped out of my YI position. Think silver will consolidate first before moving up (see chart).
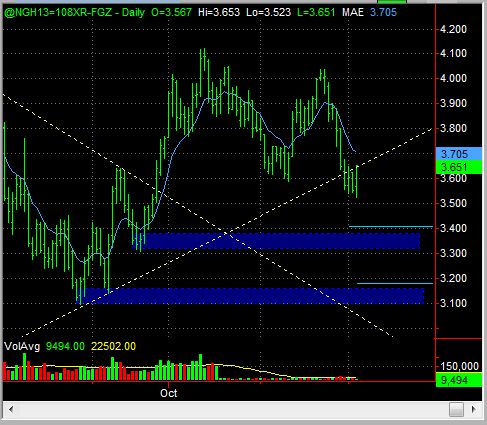
New trade: Natural Gas
Price broke upward trendline & last swing low on Friday. Got short at 3.600. Target below 3.200.
-
Very good thread and your thinking about swing trading and adequate capitalization is correct but still your stops are too tight in my opinion. Have you back-tested your method? I think you should do that. I am not sure but it may or may not be a profitable method. I tried swing trading GBPUSD before with 40 pips stops max and I lost 40% of account no matter how hard I tried. Then I saw the system they have in the price action lab blog (here, click on GBPUSD patterns) and I got suspicious that my stops were too tight. I now use 120 pip stops and I have doubled my account in 5 months.
Hi, thanks Gianno!
You are right about my stops. Agree 100%.
Yes, I've backtested my strategy manually for the last 11 years, but not on all instruments. I think that was the problem I had with Crude Oil as it is so volatile and my stops too tight for that one.
Regards,
k
-
Added to my positions:
QM now LONG from 87.18
YI now LONG from 33.56
No change in YK
(still LONG from 1446.44)
-
My long scenarios are still intact. Price tested previous resistance levels and bounced back. Should have had my stops below that levels. Learning point for next time.
Summary of current positions:
QM (mini-sized Crude Oil, Jan. contract):
LONG from 86.30 (will add if price breaches 87.60)
Stop: below 85
YI (mini-sized Silver, Dec. contract):
LONG from 33.52
Stop: below 32.90
YK (mini-sized Soybeans, Jan. contract):
Long from 1446.44
Stop: 1370
-
Hi,You begin your swing trade journal via specifically stating the problems "you had" with intraday trading as a retail trader and that you're now swing trading.
With that said, your trade management is in conflict. You're using swing trading profit targets and swing trading/position trading higher time frame analysis. In contrast, so far, you've been using intraday stop targets even though that's not what you have called them along with flipping trades and adjusting stops like an intraday trader.
Simply, you seem to "want" to be a swing trader prior to entry but you're still trading like a day trader (intraday trader) after entry.
Hi wrbtrader,
You are right in your analysis. Shakeout days like these still cause me trouble. My stops weren't placed well. They were still too tight and my position probably still too big.
Also, it's the first time I trade CL. Heard that it's volatile but was still surprised by the moves it makes. Flipping CL intra-day is probably not a good idea for swing trading...
Regards,
k
-
What a day...
Out of my Crude Oil short with a loss. Now long from 86.30. Will add if price breaches 87.
Re-entered silver long at 33.41.
-
Stopped out of my Silver position at the pre-determined level.
-
UPDATE:
Not yet out of Crude Oil. Moved my stop to $85.70 (yes, I do that sometimes). But it's still possible that I get out before that level, if overall market does not look healthy.
Today might be the day of the breakout either way...
UPDATE 2:
Out of Crude Oil at $86.10. Short now from $85.65 but not yet sure whether this is going to turn up again.
Stop for the short at $86.30. Going long again, if $87 is hit.
-
...
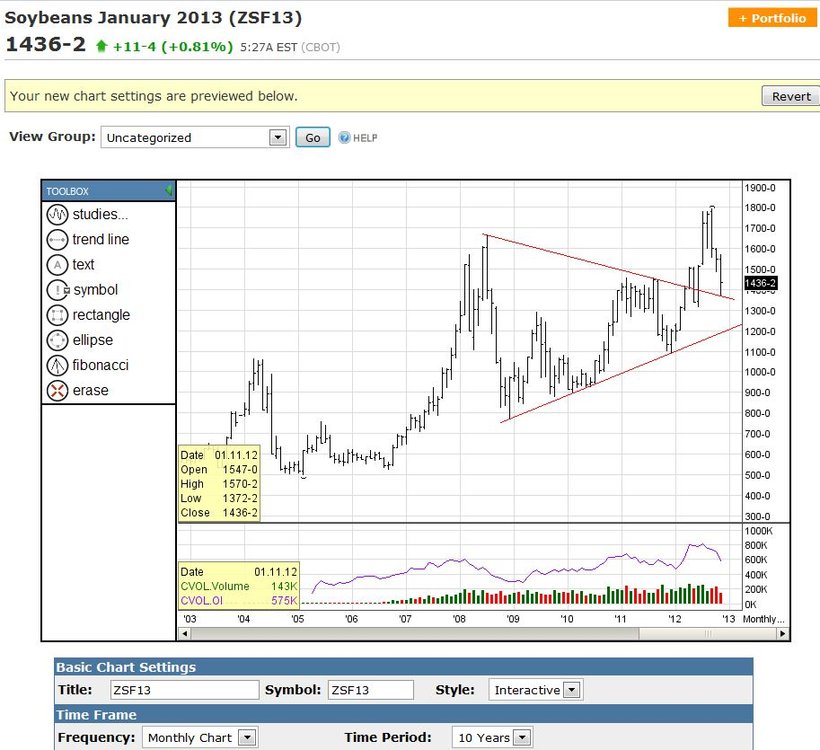
For the soybean I consider this trade to be a bit risky for my taste. The monthly chart shows the price was unable to go above the high and collapsed back below the 1650 level. This I would consider a sign of weakness in the longer intervals. The triangle break and retracement back to the top of it seems to be the key that might trigger a move in your favour. We'll have to see how the demand fares now.
The daily is in a downtrend as shown by the downtrend channel lines I have added. I would have at least waited until the the break of the channel before engaging in a long.
Nonetheless, I am sure with your stops the worst case is you'll just have to exit. Like you I also believe the coming weeks for the market are very crucial.
...
Hi Gringo,
Thanks for your productive reply and compliments. Great points you mention there.
I am especially worried about price moving into the $1,300-$1,400 area you have marked with a box. However, soybeans seem to be pretty volatile and prone to false moves, e.g. the breakout on the monthly chart was followed by a shakeout move before price continued its way up.
Volume development seems to favor also the long side. The breakout is accompanied by increasing volume and the retracement took place with lower volume (can be best seen on the monthly chart).
Anyway, I am just trying to convince myself to be right... ;-) But you are right, when my stop is hit I am out of my long and go short. My short target is by the way around $1,200.
-
New trade:
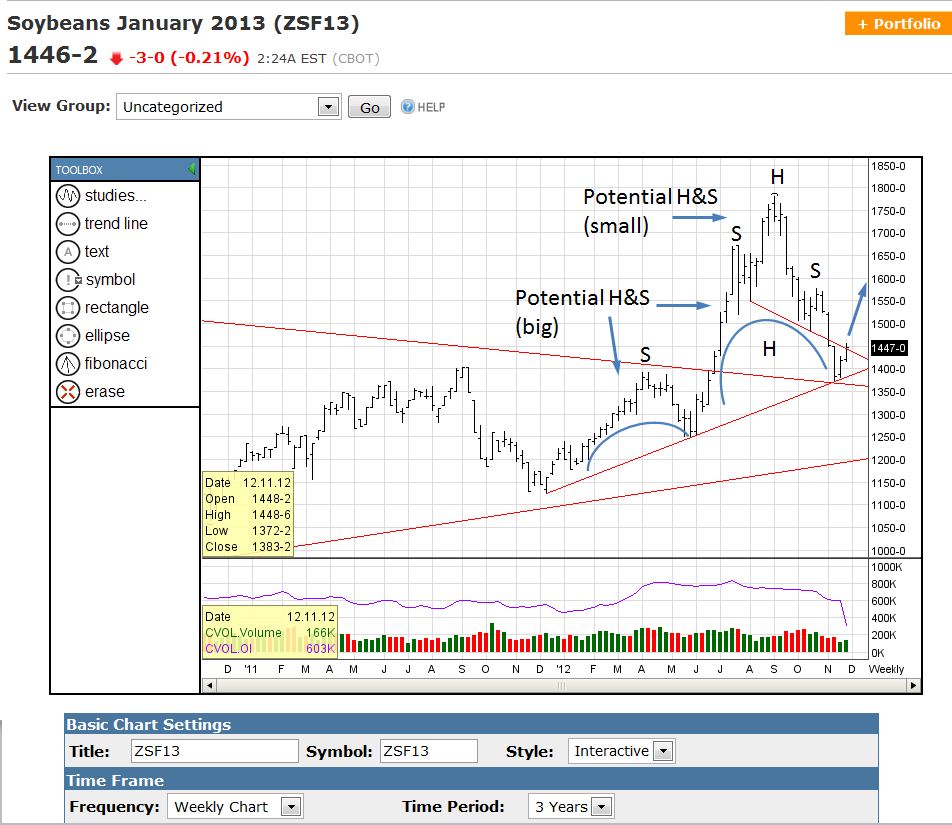
LONG Soybean (mini-sized Jan 2013) @ 1446.44
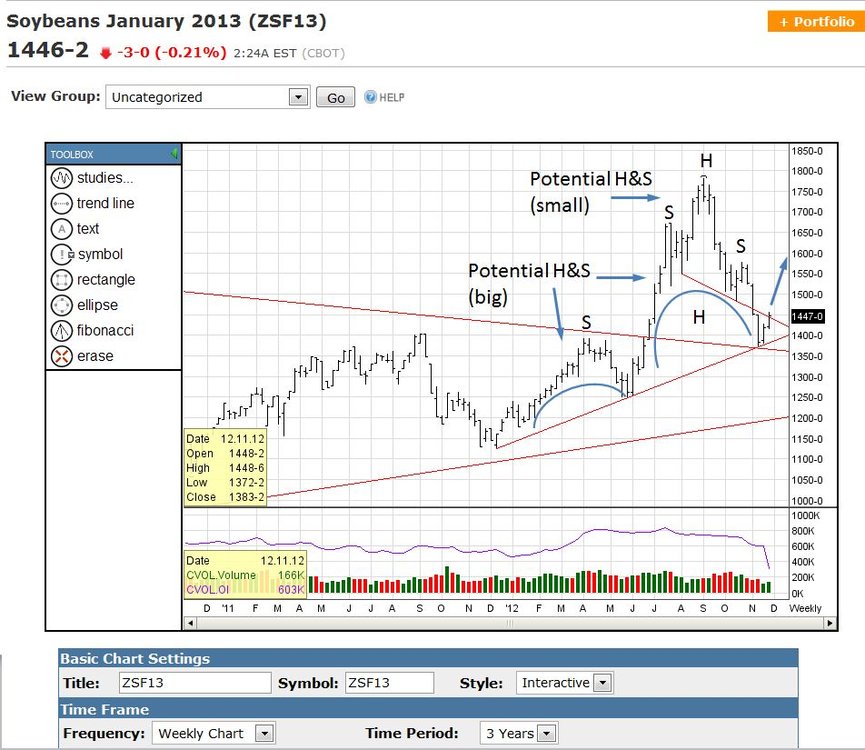
Price broke out of a huge triangle - which started in 2008 - in 2012 and retraced to the upper boundary of that triangle (see notes in previous posts on back-adjustment - ascending triangle on TS charts instead of symmetrical one). Now, on the weekly the picture looks a bit different - and that's why this is a risky trade. On the weekly, a small Head & Shoulder has been formed with a break of the neckline (disregard the "potential" in the text box of the pic - was too lazy to change it
 ). However, the neckline of that H&S was pierced yesterday again from the downside. Hence, my bet on a continuation of the move upward.
Interestingly, a further bigger H&S formation could form in my LONG scenario. The left shoulder and the head are visible, but the right shoulder has yet to be formed.
Target: around $1,600
Stop: $1,370
Overall, watching different markets now in the last few weeks I saw some correlation between different instruments. From my perspective the next 2-3 weeks are crucial for the general market direction. This relates for instance to this trade but also for the S&P or Nasdaq. Do we get the next strong upmove or the final break down? The next few weeks will probably give an answer to that.
-
What I'm currently watching:
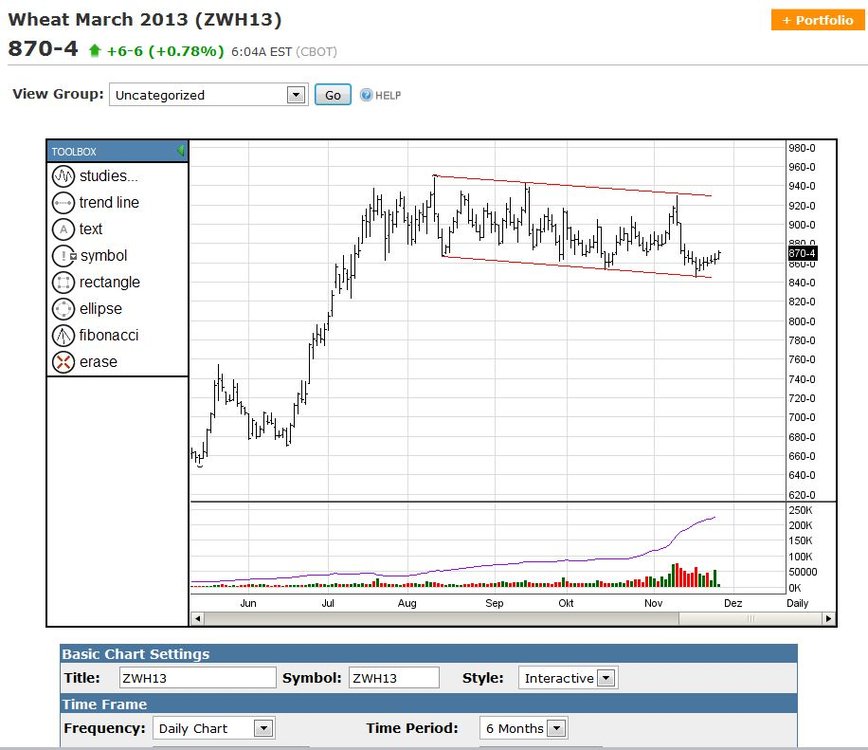
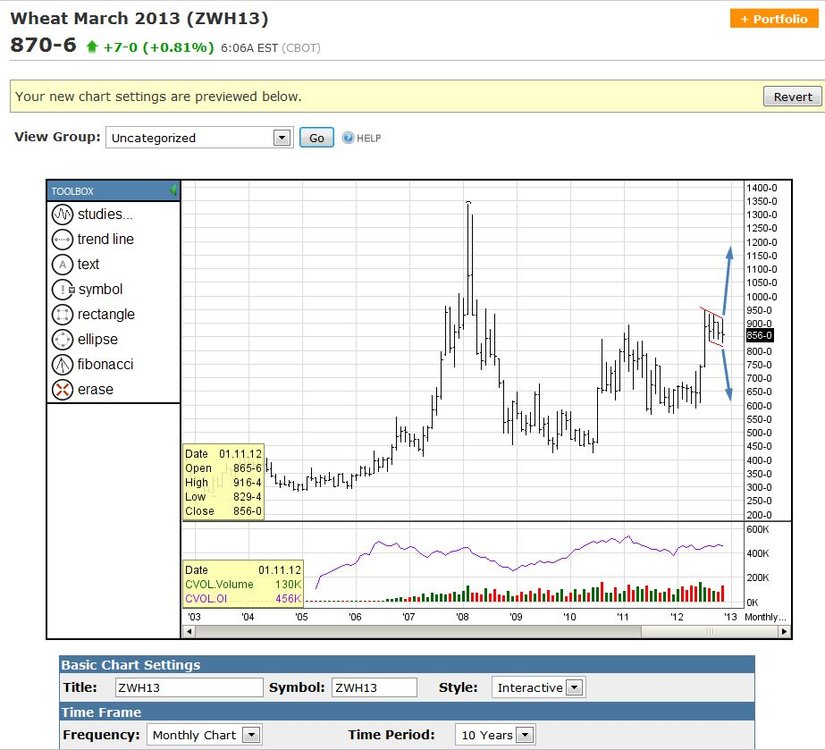
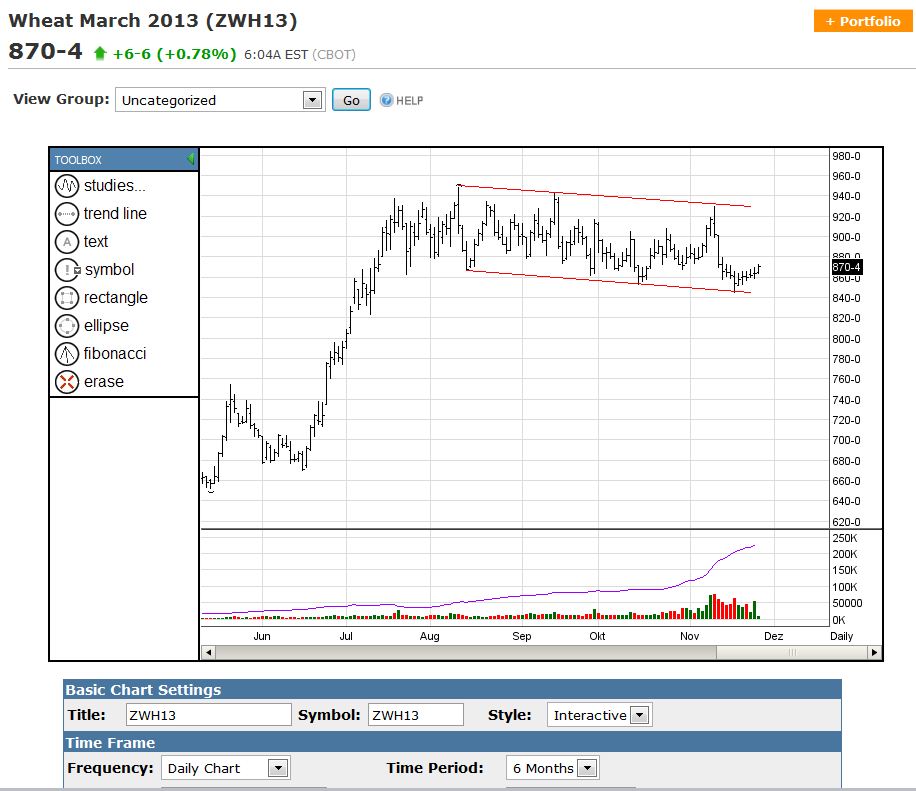
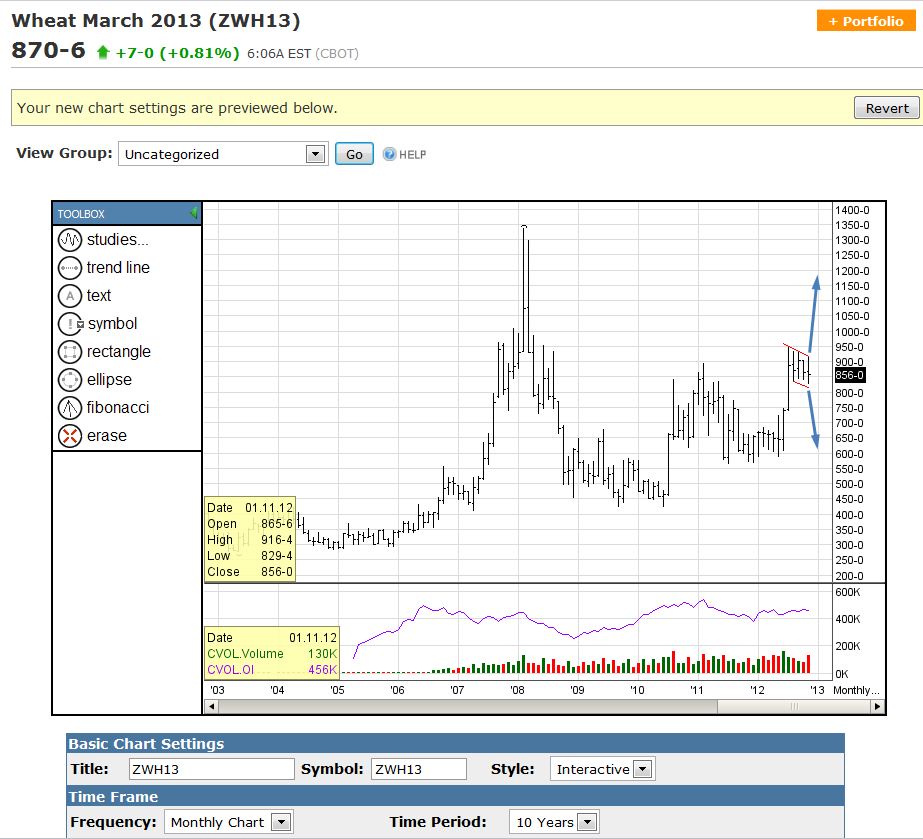
BREAKOUT out of the trend channel in Wheat
Burned my fingers already a few times on this one, as I've incurred some losses earlier due to fake breakouts (or premature activity by me
 ). Now waiting for a clear move outside of the trend channel before taking any trade.
Upside target: $1,200
Downside target: $600
Note: Beware of the back-adjustment of the continuous contract. This one looks different when I apply my standard back-adjustment procedure on my tradestation platform (i.e. no rounding bottom there, but declining lower trend line). Hence, the $600 target for the short setup, instead of something like $700. I will provide my respective TS charts on this one later.
-
Preview
--------------------------------------------------------------------------------
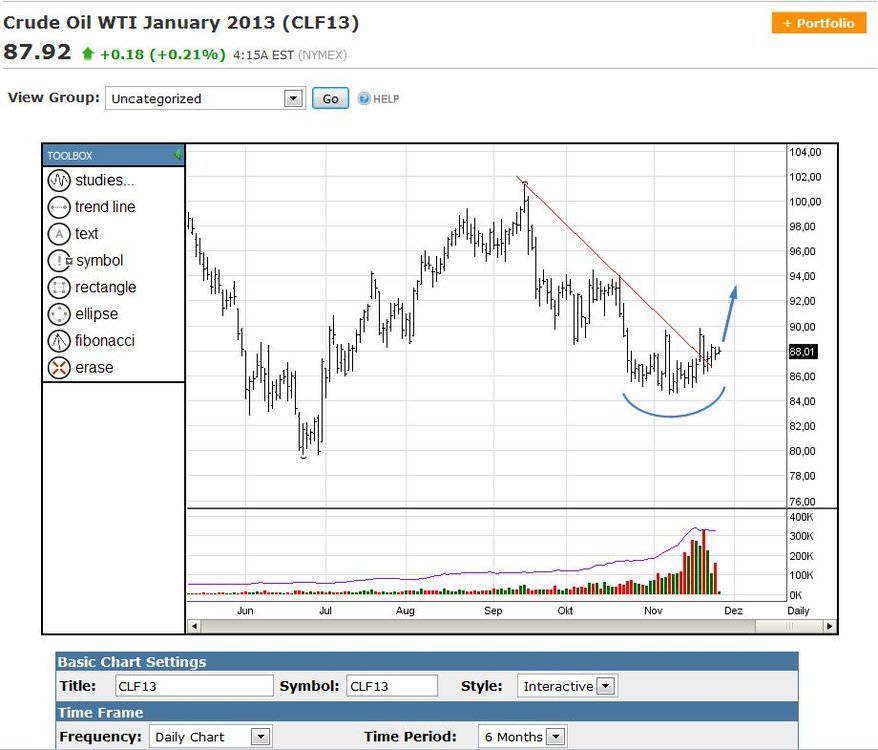
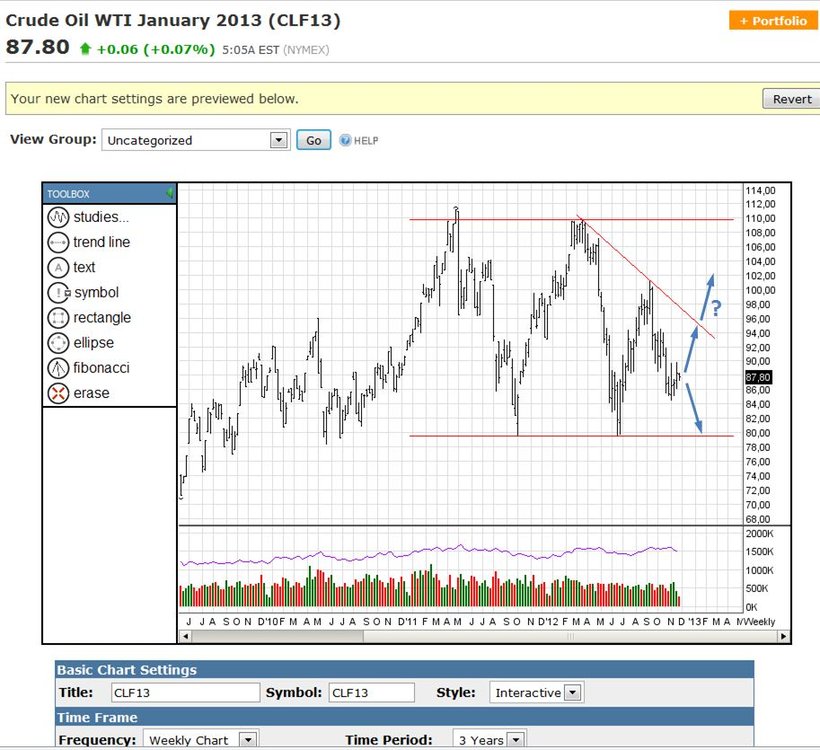
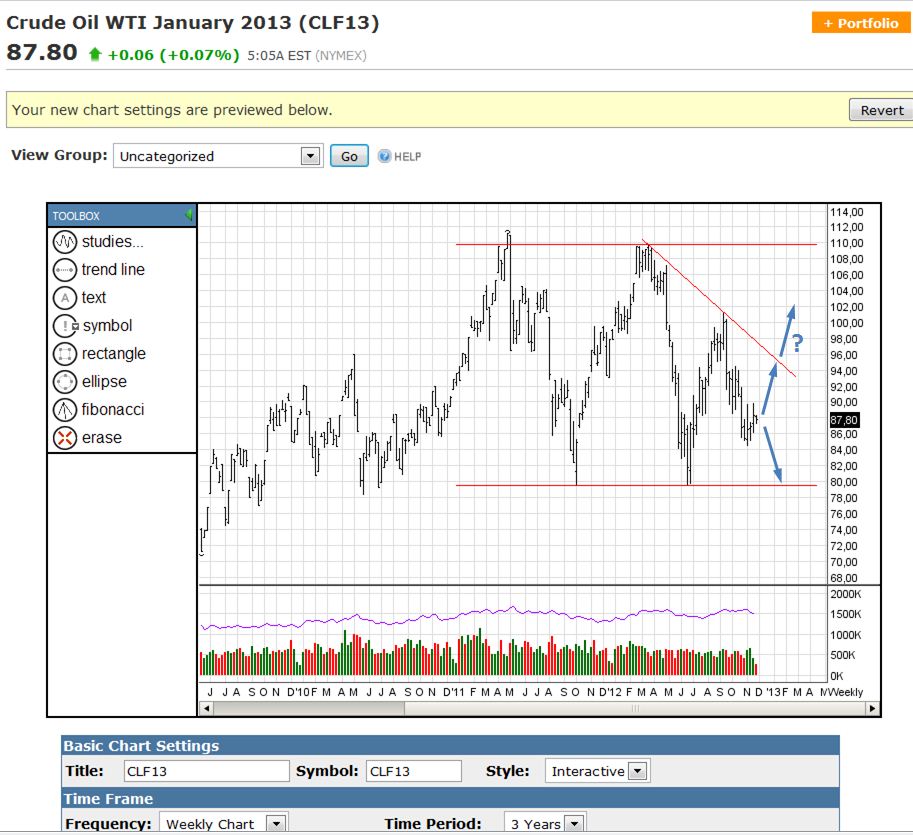
Here is the rationale and the parameters for the LONG crude oil position:
That trade is a bit unusual for me, as it is somewhat "experimental". I could not find anything really helpful in the monthly
or weekly charts - which I like to do first before moving to the daily charts. However, I saw this small rounding bottom on
the daily chart which got my attention.
Price tried to break to the upside twice in that pattern but moved back to continue with the rounding pattern. I took my
chance at $87.50 with a LONG position and expect a breakout of this pattern on "short notice" with a move to around $95.
I will sell 50% of my position there and keep the rest until $105 is reached or I'm stopped out (will adjust my stop level
when $95 is reached). The $105 is derived from the trend line shown in the weekly chart.
My current stop is at $86.275 and I will flip my position, when that stop is hit -> new target then: $80.
Note: Beware of the back-adjustment of the continuous contract. This one looks different when I apply my standard back-
adjustment procedure on my tradestation platform (i.e. no rectangle there, but declining upper trend line). Hence, the $105
target, instead of $110.
-
The trades I am currently in are:
- LONG silver from USD 33.14 (mini-sized December contract)
- LONG crude oil from USD 87.50 (mini-sized January contract)
Note: Sorry, for the "cheap" charts, but currently I have only access to my tradestation platform every 2-3 weeks (I'm on a project
outside my home town). As I do not use any fancy indicators or automated system, I use barchart.com for my analysis, which is fully sufficient, and
place my trades through the webtrading application of tradestation. This is all very rudimentary, but it works. I choose to post my ideas
now with these charts instead of waiting and posting the nicer looking charts, as timing is critical in this business. Will try to post
tradestation (TS) charts whenever possible. I take screenshots of my TS charts with me for reference during the weeks when I have no access to TS.
Hence, my reference below to the TS charts.
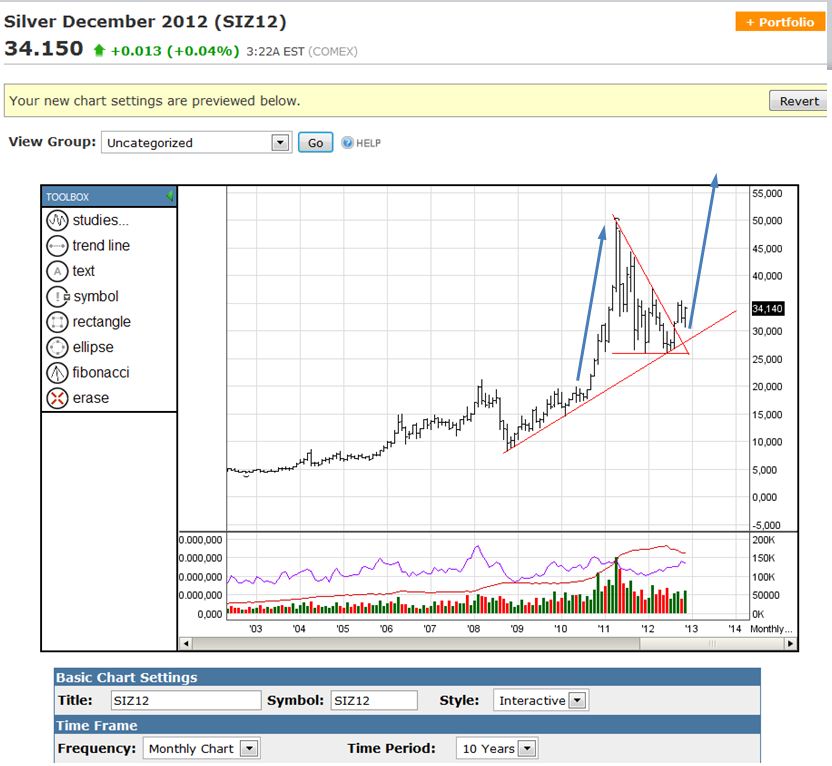
Here is the rationale and the parameters for the LONG silver position:
After developing a major pennant in 2011 and until the summer of 2012, the breakout out of the pennant occurred in September at about $31.
Usually the price move leading to the pennant is copied from the breakout point. This would lead to a target of about $60.
After a move to about $35 price retraced to around $31 where it was "defended". I entered slightly above that level and
plan to sell 50% of my position at around $38-40 and keep the rest until $60 is reached or a reversal pattern occurs.
My stop is at $33.13. I will flip my position with 50% of my original position if that level is reached - with the new target
being $30.

-
Watch out: TLDR material
Hi,
After being around for a while on this forum without any major contribution I thought I could share a little bit of my
journey as a trader and exchange some information with other traders about swing trade ideas for the futures markets.
Your own ideas are more than welcome in this thread as I'm always interested to see further potential opportunities.
But let's first give briefly some background info on my path as a discretionary trader.
After losing a lot of money through intra-day trading (winning periods of 2-3 months interrupted by major blow outs), I
came to the conclusion that intra-day trading is not the right way to go as a retail trader. You might think that my
psychology was the issue here, but I'm sure it's the method which led to my emotional response every 2-3 months - proof
for that is that I do not have that problem when swing trading. Anyway, I believe that intra-day price movements are
largely random; hence, the edge - if one is able to develop one - is very small in my opinion for retail traders (now, that
will provoke one or two traders here, I guess... ;-) ).
Just to be clear, there are for sure excellent traders out there making good amounts of money by trading short-term order flow
or similar. However, those who are able to do that year after year after year - and especially when they approach their
late thirties or fourties - are for sure one in a million.
If you are one of them, good for you! If not, maybe you should try something different...
In contrast to intra-day trading, I am certain that most people can learn and master swing trading strategies - i.e. trading
higher time frames for larger movements - as this is a totally different animal. It is a lot less stressful than intra-day
trading and requires a different skill set. Also, it is possible to have a day job and earn extra money on the side with
swing trading, something that is impossible with intra-day trading. That way, you can reach your financial goals much faster,
than with only one income stream.
Anyway, before elaborating more on the pro's and con's of intra-day versus swing trading, let's get down to business.
My discretionary swing trading strategy is based on classical chart patterns and I look only at price development (sometimes
I take some clues from volume development as well, but that is more secondary), no fundamentals, no fancy stuff.
I hold positions from one day to several months, depending on the situation.
I try to look at various futures markets to generate trade ideas with no preference for any particular contract.
I use fairly wide stops. In order to be able to do this, you have to be well capitalized. There is no way this
strategy will work for you, if you have only USD 5,000 in you account and plan to hold a position requiring USD 3,000 overnight
margin. This would kill you very soon. If you do not have enough money for this, paper trade, earn money somewhere else
in the meantime and come back later to trade with real money if you have enough available.
Furthermore, please note that I might change my mind on a scenario (and my position!) fairly quickly. So, if you plan to follow
any of these ideas, please be aware of that. I try to post any changes of my position in time, but can not guarantee that.
Finally, I do not know whether exposing myself and my trade ideas in such forum will harm my performance. But we will see.
In the next posts I will explain my current trade ideas. The first two are ideas where I already have a position in, the
third one is a breakout I'm waiting for to occur.
-
I think the point of the before/after was to show that the after chart with only 1-2 indicators was pointing out nearly the exact same thing that before chart with several seemingly elaborate indicators. But that's the whole point of an illusion: To distract your attention away from the real goal....usually that is looking for profitable setups. With the before chart, someone can really think "wow, these indicators are really leading us somewhere". But the after chart is drawing the same conclusions, but cheaper and less cluttered. That's what I gathered anyway.Exactly!
That's why I "liked" it, because it is so cluttered. Guess a lot of new traders have similar charts (I did too).
I didn't even see that it is the same price action... lol
-
just saw a guy in the street with a t-shirt written on it ......"optimise for success.....curve fit for comfort"
Great quote!
Was this an ad or something? If so, do you remember the company name? Just curious...
-
before.....after......I like the "before" chart
-
I love the ad!!! .... lol


Swing Trading Futures
in Swing Trading and Position Trading
Posted
Covered my NG long with a profit of 0.041, wait for further signal. Difficult market environment these days... cannot tell whether its a bull or bear market...