
Welcome to the new Traders Laboratory! Please bear with us as we finish the migration over the next few days. If you find any issues, want to leave feedback, get in touch with us, or offer suggestions please post to the Support forum here.

malvado xetra
-
Content Count
68 -
Joined
-
Last visited
Posts posted by malvado xetra
-
-
Ok, Sorry But, I Have To Send All My Charts In Two Threads.
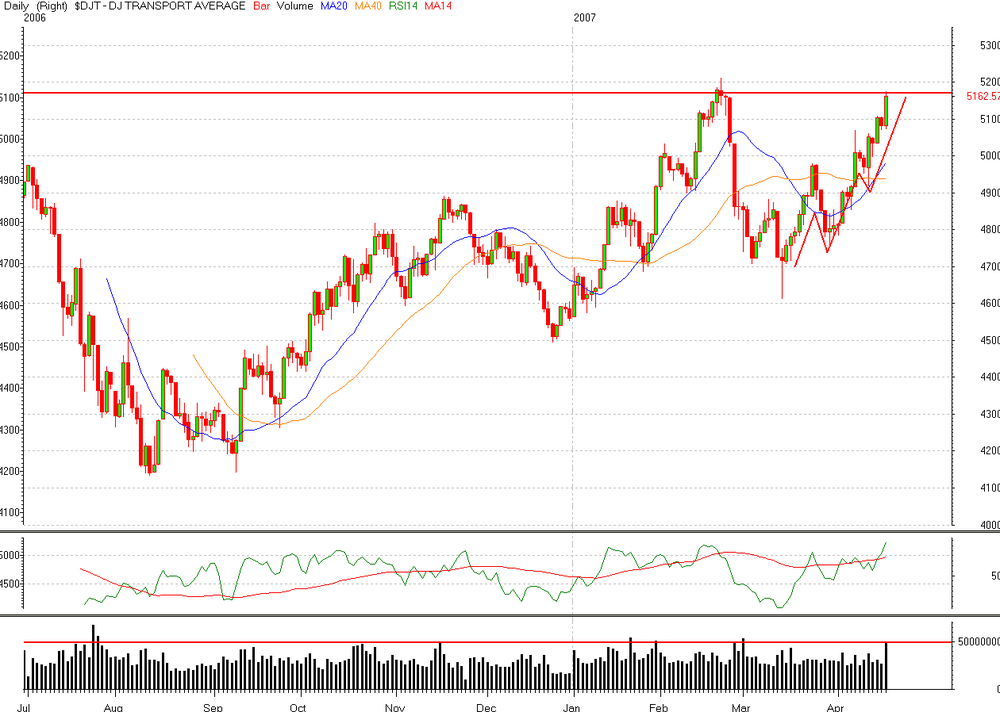
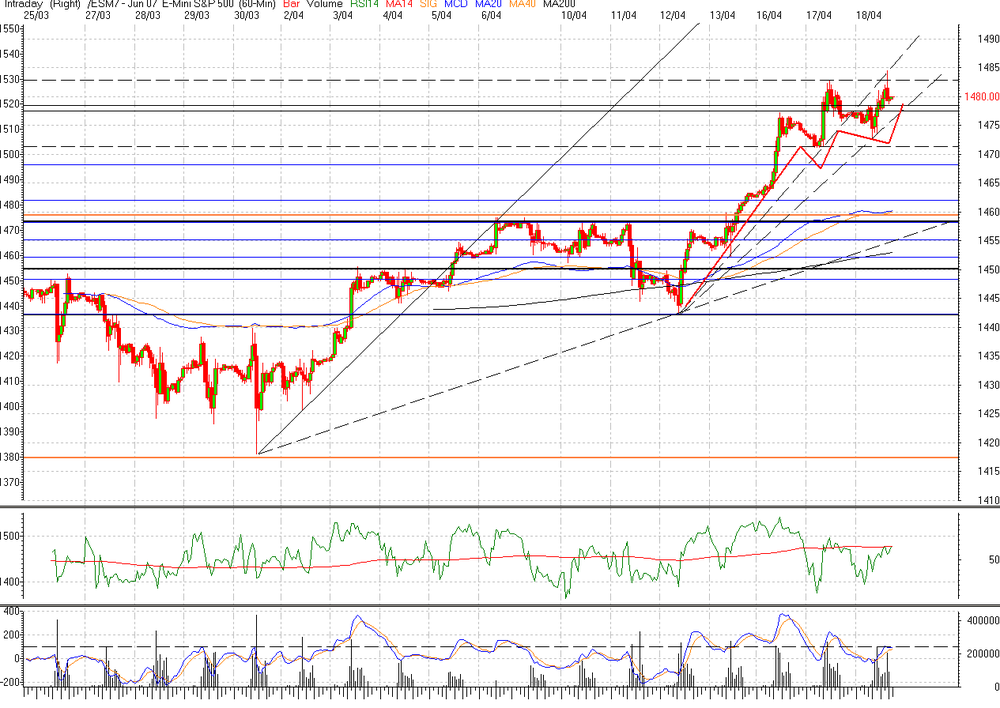
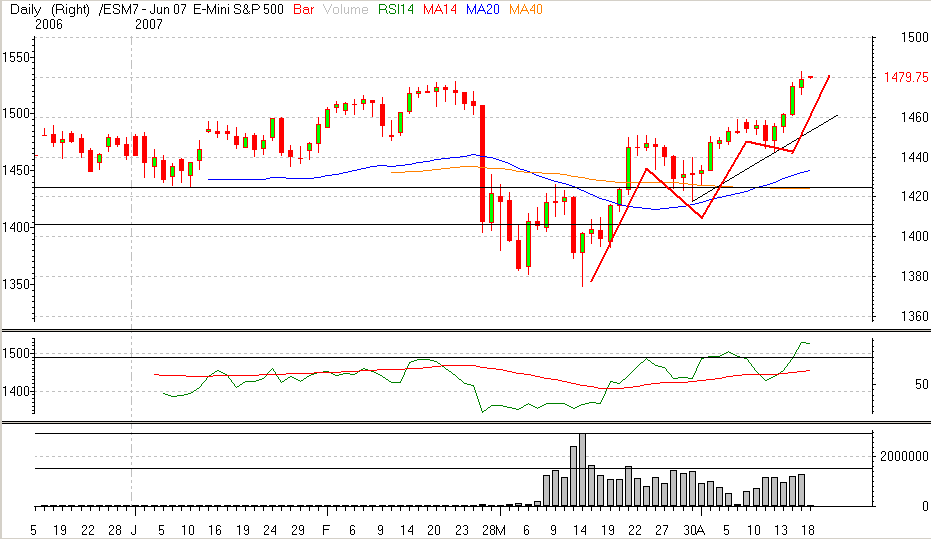
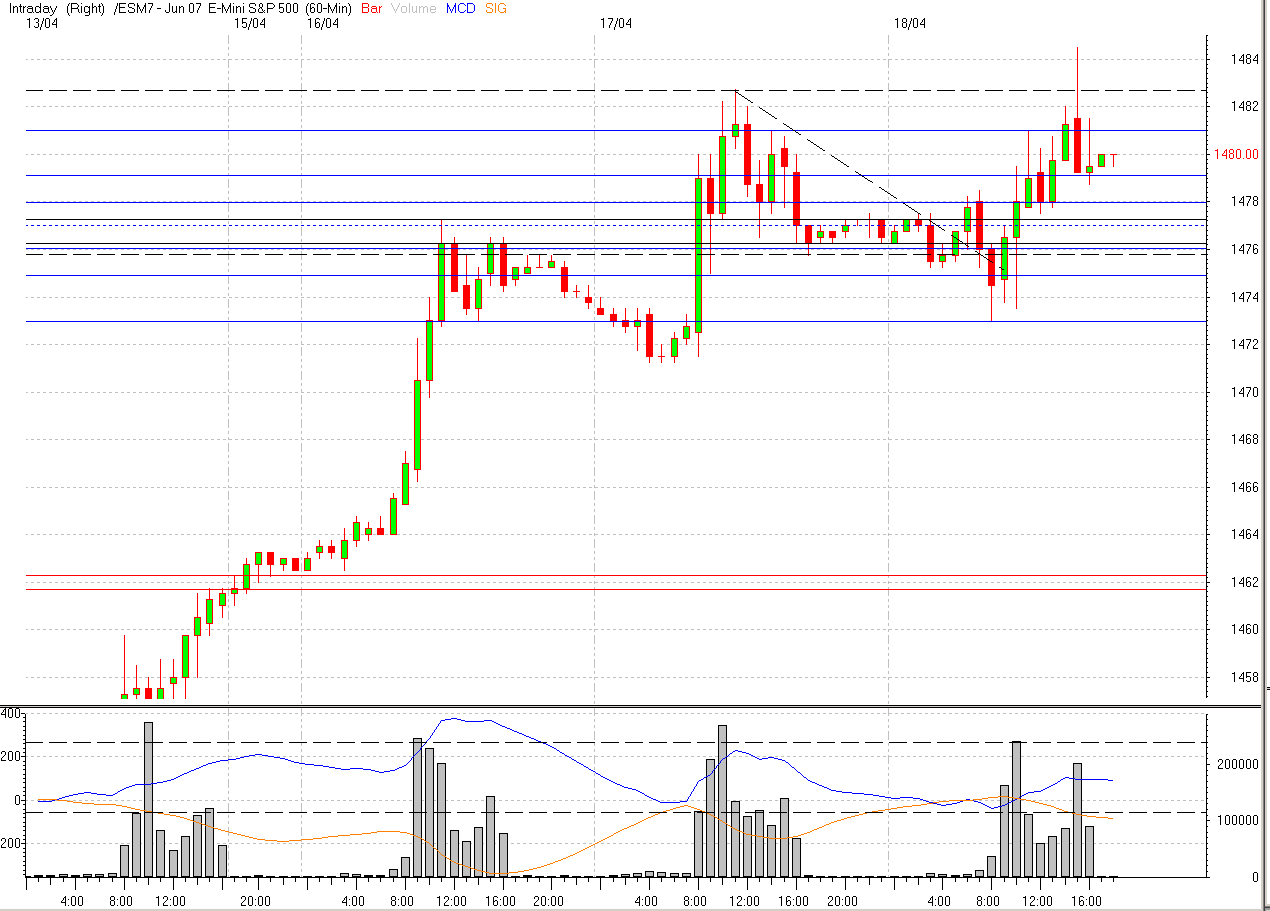
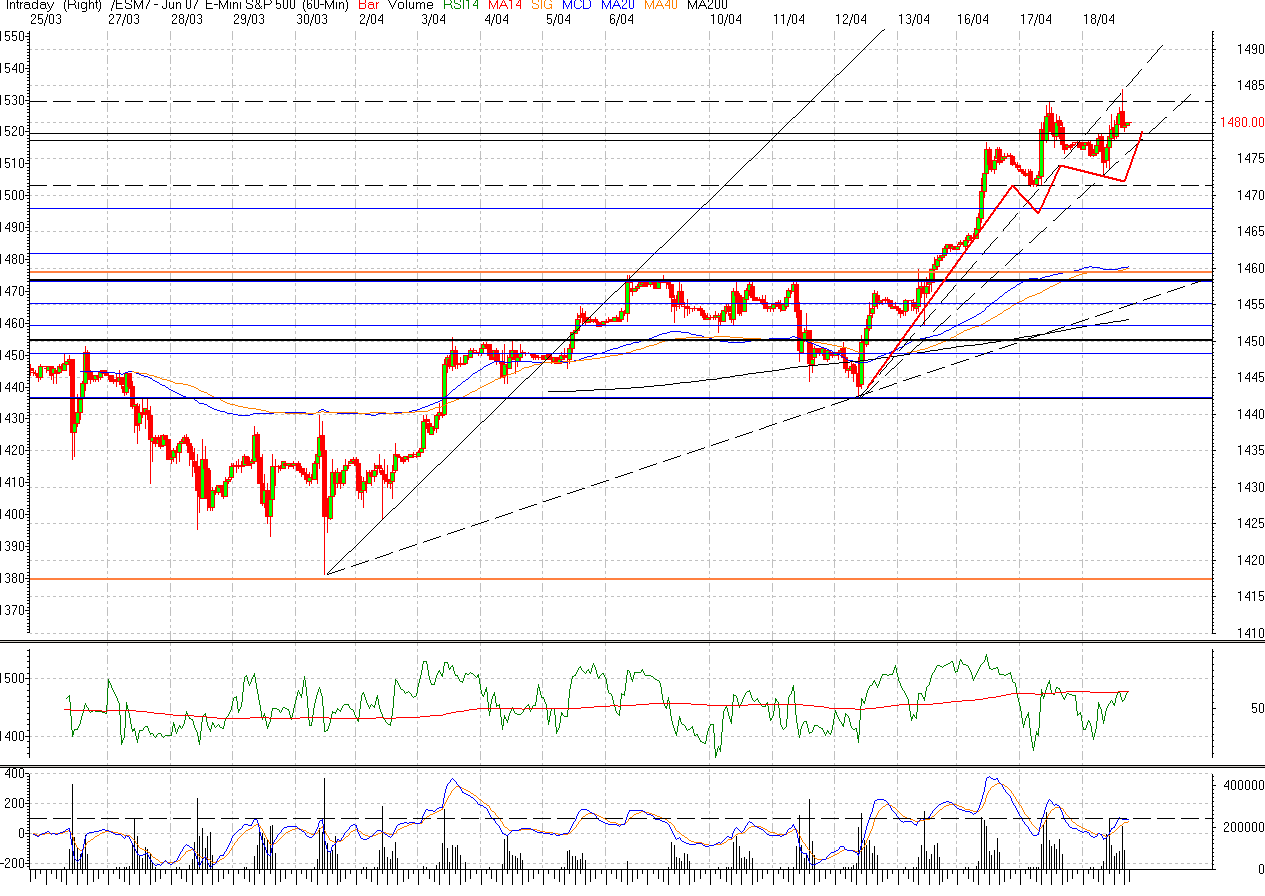
All The Markets Are In The 5th Wave Daily And In The 60 Minute.
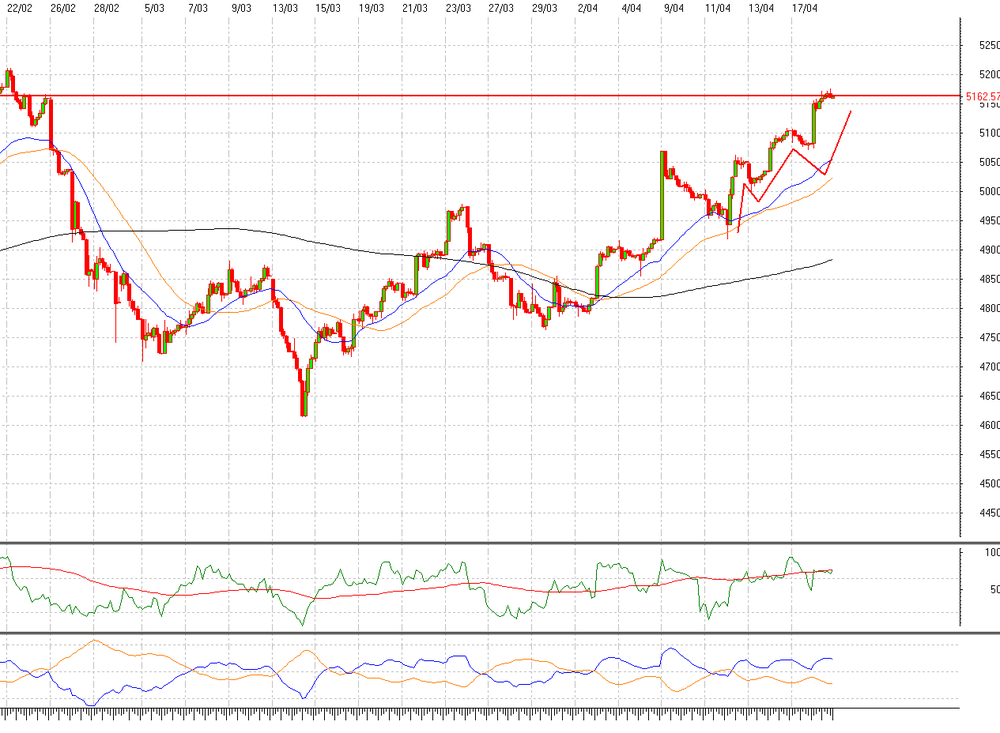
Djt Average Couldnt Reach Its Highs Yet. Look At The Big Volume Bar Waiting For Doji In Daily Chart.
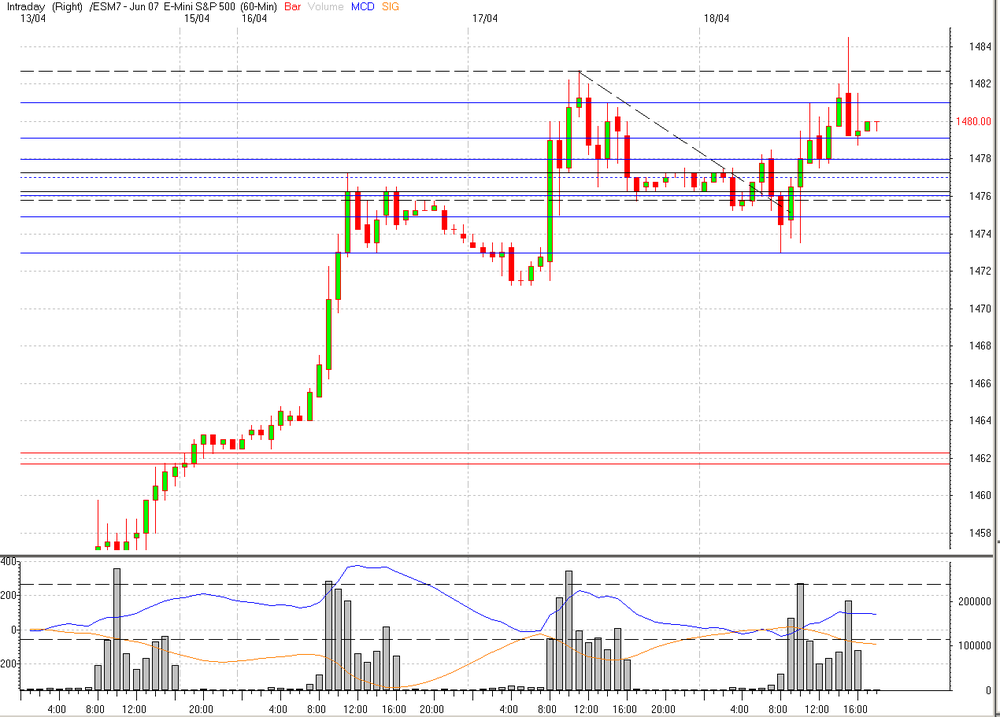
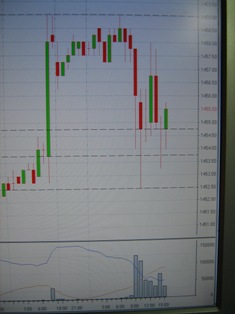
Mini Sp 60 Minutes 5 Day Chart Presents A Big Doji Inverted Hammer With A Big Volume Bar
Nasdaq Composite Has A Candles Figure Asking For A Big Down
Nikkei Cannot Go Up Further
All Rsi Daily Indicators Are Over Bought
It Looks Like The Whole Scenario Is Exhausted
-
I know Tin. the think is how to select a chart from real tick to put it into the sender box of traderslaboratory. there is not any function on the chart clicking the right botton of the mouse
-
Im trying to send some charts from real tick but, I dont know how to do it
-
after seeing daily charts and 60 minutes charts, looking at elliott curves and RSI indicators. Probably, tomorrow will see a big down. I would like to hear some opinions from the forum.
thank you
-
replaying to notouch.
seeing the daily chart of sp 500 I can see that another wave up is commimg but, think that before that we ll see levels at 1442 - 1445 or even 1435 and then we ll get back to the up trend to reapet 1459 and 1470-72
at the moment, I dont see a 1459 for tomorrow. I think tomorrow will go down again. another wave going to 1445 at least have to come. probably I was to bear to think that 1452,25 was going to be todays high but dont see repeating 1459 yet
thank you for replays
malvado xetra
-
I see the dow mini but didnt know that traders call it YM market
-
whats a YM?
thank you
malvado
-
I think the todays recovery in the mini sp500 is a recovery to keep falling.
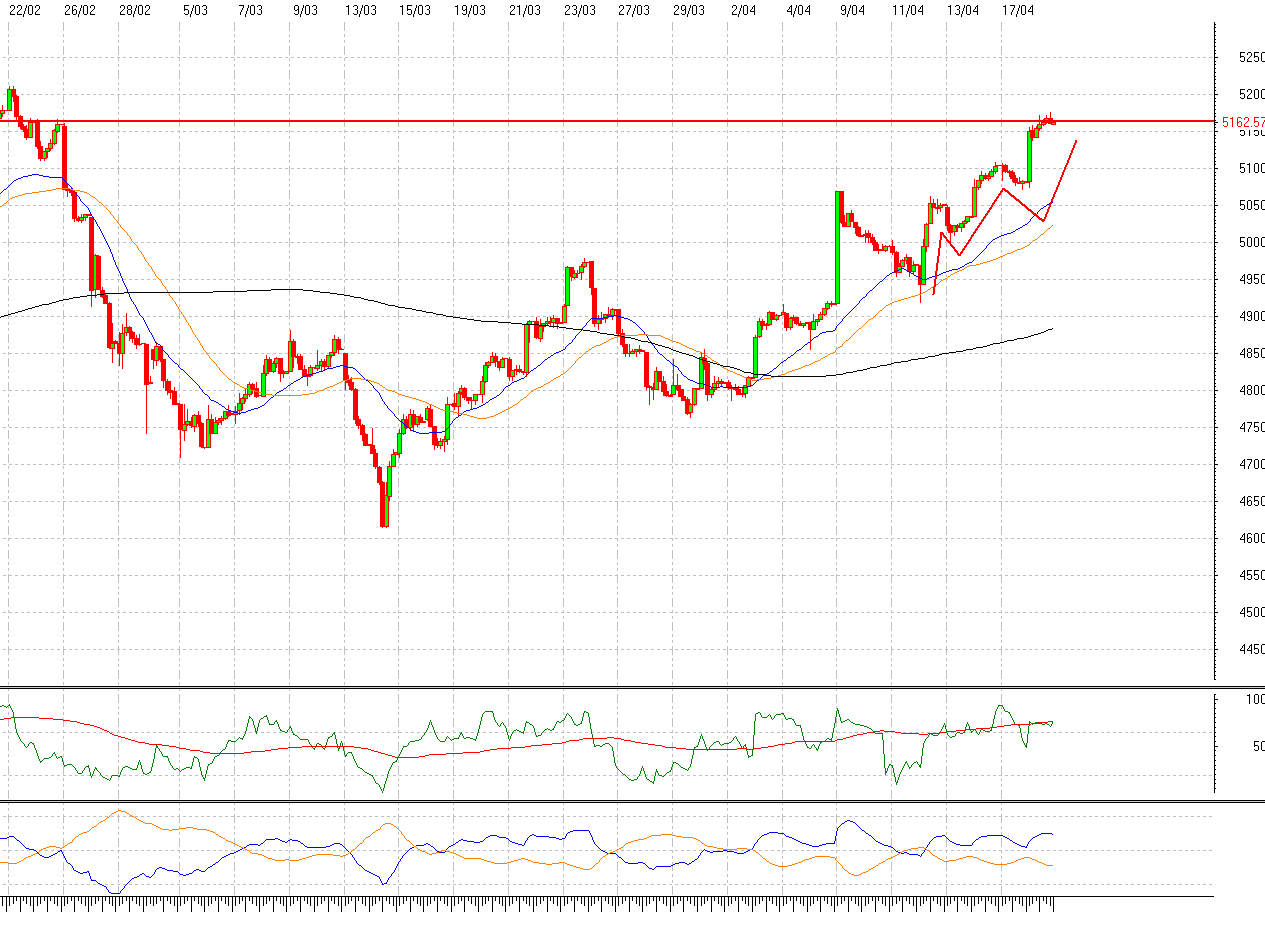
I dont think we see in the following days the level of 1459 again. It is clear that the long term trend is bullish but for the following days there are two scenarios:
1st.- a diamond is going to be formed between levels of 1445 and 1451 (maximum at 1452,25). when this diamond will be finished, will go back to the long term trend strongly to look for levels at 1472.
2nd.- if the diamond doesnt forme finally. will fall to levels of mini sp500 between 1432, 1435. from this levels will go back into the long term trend to highs at 1472.
different opinions are wellcome
-
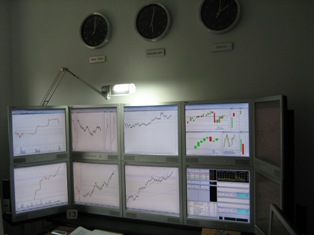
actually, there are 10 if you realise of the two monitors on the right side of the video wall that are in the shadow.
the reason why I use 10 screens and only trade with one future it is because I like to have the whole picture of the market. Such as: US indices, west texas oil, USD/EUR, volume rates, volatility rates and so on. I also see different frame times to see elliott waves interactions in the long term and big supports/resistances. When I get into the market I like to see the forest and not only the big tree I have in front of my eyes. take in account that, I trade swinger so I trade 3 or 4 times monthly more or less. so the big picture is very important if you want to get into the big wave trend and stay inside 3 or 4 days per entry.
best regards
-
I know trader 273
the thing is that I use different computer from my trading one to chat or surf the web. I do this to avoid getting virus attacks. so I was a little lazy to get a graphic from my trading maching and put it into the lap top which I surf. Anyway, thanks for your interest.
malvado xetra
-
dear walterw,
I attache a today´s mini sp picture.
you can se how the reversal 60 minutes candle is formed on the support area located between 1451 (top of past days) and 1454.75 (top of 5th, april). this area was resistance last week, today is support. look at how the base of the head candel lines exactly on the 1454.75. see aswell how the 50% tile area has been support area for today (1453.75 approximately). At the same time observe the volume bars (both are the highest of the day. Anyway, this is an example of combining candles 60 min with volume bars but today I wouldnt enter an order because of we are quite high in sp and elliott tells me that a down is close. I would buy at levels of levels of 1450 but reaching first levels of 1465 if we had this pullback and volume/candles realtionship is positive for a bullish entry
best regards
-
torero,
with real tick, I use 60 minutes candle sticks combine with volume bars. At the same time I also use tick a tick charts of 1 and 5 days. these tick a tick charts I use them to follow highs and lows closly. So, a good pattern of candles and volume must be joint with a good relation of highs and lows at the same time
-
last week saw differents experiences about frozen graphics in the forum. this happens when high volume of information is going through and the computer cannot work whith all of them. then the graphics get frozen or you observe some delays in price.
Ive been studying this problem and it is not about RAM. I think the solution is to enhance your pc processor. if you go to visualize your windows tasks administrator bar you will see how the capacity of your processor gets colapsed when a big volume of orders get into the system. Normally when this task administrator bar reach 52% of used capacity your computer starts delying and as this bar gets higher (60%, 80% or even 100% of used capacity) the graphics begin to freeze and sometimes you even have to boot up your pc back to get real time info.
my computer supplier is setting me a new pc up with a huge processor. about 20Ghz. when I have it, will tell you if the problem was sorted out.
best regards
-
sorry,
I didnt know how to attache a picture first time
-
thats my trading station. I use one more screen from a lap top. and all this video wall is connected to a quite big pc.
best regards
-
normally, when you enter into a breakout you are risking. Why? because you are buying expensive. so, buy cheap and sell expensive. wait for pullbacks, as easy at this. another point to value if a breakout is reliable or not is to watch volume bars. for example, if the volume bar is quite big at the time price is breaking out, it is possible that buyers are getting to the end of that trend and price is about to reversal.
-
dear guy,
I combine 60 min candlesticks with volume bars. A reversal candle must be going with a big volume bar. I mean for big, the biggest of the day, approximately. this combination must be done in support o resistance areas. once you have this pattern you enter your order about the 50% of the tile. But, you have to be carefull that highs and lows are higher in a tick graphic if you are bull or, highs and lows are getting lower in a tick graphic if you are a bear. otherwise, you can be getting in against the market trend of the day. if you combine all this with a high depth of orders in the order book the at the possition you want to enter; it is quite probable that your move will be succesfull. set your stop loss a little bit further of the end of the tile and always bellow or above of the resistance/support
if you want a I sent a graphic to you, let me know
best regards

whats up for tomorrow in the sp?
in Market News & Analysis
Posted
The Last Two Charts